KATHRYN R. MULLEN. Beverage Container Deposit Laws and Their
Effect on Curbside Recycling. (Under The Direction of Dr. RICHARD
N.L. ANDREWS)This paper examines the effect beverage container deposit laws
(BCDLs) have on curbside recycling, focusing on the Orange County
program. A literature study was conducted to help develop a model
which was used to determine the cost increase to a municipal
recycling program when a BCDL is in effect. The results were that
it costed $169.53 per ton to run a municipal recycling program in
1991. If a BCDL had been in effect and the cost to run themunicipal recycling program would have increased to $229.25 (If all
the materials that could be collected in the BCDL were divertedfrom the recycling stream to the BCDL stream). Collections cost
remain constant in a dual system, however revenues decrease
dramatically. Processing cost also decrease but not as
dramatically as revenue resulting in the increased costs to a
municipal recycler under a BCDL system.
I. INTRODUCTION ... 1
1.1 Definition of a Beverage Container Deposit Law... 1
1.2 The History of the Beverage Container Industry ... 2
1.3 States that have Beverage Container Deposit Laws ... 5
1.4 North Carolina's Interest in Beverage Container Deposit Laws ... 9
II. THE EFFECTS OF BEVERAGE CONTAINER DEPOSIT LAWS ON CURBSIDE RECYCLING ... 12
2.1 The Franklin Associates, LTD. Model... 13
2.1.1 Structure and Assumptions... 14
2.1.2 The Franklin Associates, LTD.'s Findings . 15 2.1.3 Analysis of the Franklin Associates, LTD. Study... 20
2.2 The Gershman, Brickner & Bratton, Inc. Study . . 22
2.2.1 Structure and Assumptions ... 22
2.2.2 GBB's Findings... 25
2.2.3 Analysis of GBB's Findings ... 26
2.3 The Rhode Island Model... 27
2.3.1 Structure and Assumptions... 27
2.3.2 Findings of the Rhode Island Study .... 28
2.3.3 Analysis of the Rhode Island Study .... 30
2.4 The Florida Public Interest Research Group Study 32
2.4.1 Structure and Assumptions... 322.4.2 Finding of the Florida PIRG Ed Fund Study . 3 3
2.4.3 Analysis of the Fl. PIRG Ed. Fund Study . . 33
2.5 Review of "Bottle Bills and Municipal Recycling: A
Preliminary Cost Analysis" by the Tellus Institute... 402.5.1 Structure and Assumptions... 40
2.5.2 Findings of the Tellus Institute... 42
2.5.3 Analysis of the Tellus Institute... 44
2.6 Conclusions... 46
III. PROJECTED EFFECTS OF A BCDL ON ORANGE COUNTY'S RECYCLING PROGRAM ... 50
3.1 Scenario for Orange County ... 50
3.2 Landfill Avoidance Costs ... 54
3.3 Conclusions... 59
IV. CONCLUSIONS... 60
4.1 Generalizations about the Effects of BCDLs on
Curbside Recycling Programs... 60
4.2 Can Curbside Recycling and BCDLs Coexist? .... 61
4.3 Escheat Clauses... 62
XV
Appendix A... Al Appendix B... Bl
Appendix C... CI
Appendix D... Dl
Figure 1.1 How a Deposit System Works ... 3
Table 1.1 Generation of Beverage Containers, 1960 to 2000 (InMillions of Tons) ... 4
Table 1.2 Beverage Container Deposit Laws ... 6 Table 1.3 Bottle Deposit Legislation in North Carolina . . 11 Table 2.1 Summary of New York Comprehensive Municipal Recovery
Program's Capital Costs, Annual Operating Costs,
Revenues, Net Operating Costs, And Recyclables RecoveredWith A BCDL in Place (in dollars and tons) ... 16
Table 2.2 Summary of Vermont Comprehensive Municipal Recovery
Program's Capital Costs, And Recyclables Recovered With
and Without A BCDL In Place (In dollars and tons) . . 17 Table 2.3 Comparison of Net Costs To Operate Two Separate
Recyclable Material Recovery Systems or One System - New
York... 18
Table 2.4 Comparison of Net Costs To Operate Two Separate Recyclable Material Recovery Systems or One System
-Vermont... 19
Table 2.5 Islip Residential Recycling System Revenues and
Costs With and Without BCDL in 18,991 Households ... 23
Table 2.6 Anne Arundel Residential Recycling System Revenues
and Costs With and Without BCDL... 24 Table 2.7 Recycling Cost Per Ton... 25
Table 2.8 Comparison of Rhode Island's Curbside Recycling
Program and a Curbside/BCDL Program ... 29
Table 2.9 Comparison of Rhode Island's Curbside Recycling
Program and a Curbside/BCDL Program When Residues areLandfilled... 30 Table 2.10 Cost to the Municipal Recycling Program in
Rhode Island ... 31
Table 2.11 City of Tallahassee Recycling: Government Costs and
Revenues in Calendar Year 1991... 34 Table 2.12 City of Gainesville Recycling: Government Costs
Table 2.13 City of Hialeah Recycling: Government Costs and
Revenues in Calendar Year 1991... 36
Table 2.14 City of Miami Recycling: Government Costs and Revenues in Calendar Year 1991... 37
Table 2.15 Cost of Curbside Program vs. Curbside/Bottle Bill When Only the Materials Collected in the Curbside Program are Considered... 39
Table 2.16 Cost of Curbside Program vs. Curbside/Bottle Bill When Only the Materials Collected in the Curbside Program are Considered and the Landfill Avoidance Cost is not Considered... 39
Figure 2.1 Social Cost Comparisons With and Without a Bottle Bill... 43
Figure 2.2 Municipal Cost Comparisons With and Without a Bottle Bill... 45
TABLE 2:17 Effects Of BCDL On Curbside Recycling Programs 47
Table 3.1 Predicted Effect of a BCDL on the Curbside Recycling Program in Chapel Hill... 51
Table 3.2: Processing and Collection Costs ... 55
Table 3.3 Collection Costs Variance ... 56
Table 3.4 Processing Costs Variance ... 56
Table 3.5 Newspaper Revenue Variances ... ... 56
Table 3.6 Aluminum Revenue Variances ... 57
Table 3.7 Glass Revenue Variances ... 57
ACKNOWLEDGEMENTS
I would like to thank my husband who supported me throughout the writing of this document and had faith in me even when I did not.
Also I want to thank him for his love and support. I would also like to thank my parents and my brother whose encouragement and love were a constant source of emotional strength.
I would like to thank Dr. Richard N.L. Andrews for his guidance during my study at UNC. I am also grateful to Dr. Deborah Amaral
and Dr. Luger for their positive criticism and support during the
preparation of this report.
I am grateful to Amanda Williams who proof-read my final draft. Also I would like to thanK Blair Pollack and Wendy McGee who
This paper presents a study of the effect of beverage container deposit laws (BCDLs) on curbside recycling, focusing on the effects that a beverage container deposit law would have on curbside recycling in Orange County, North Carolina. Beverage Containers are a growing segment of the
waste stream. Also they are very visible component of litter. As landfill space continues to dwindle, new solid waste management policies will need to be evaluated. One of the possible solutions to this problem has been beverage container
deposit laws.
One of the major criticisms of these policies has been the effect a BCDL has on curbside recycling because it pulls
aluminum and glass out of the recycling stream. If these programs can be run simultaneously the amount of recyclables
diverted from the waste stream can increase significantly. It
is speculated that they become more expensive to run because
aluminum, which is the most valuable material in the recycling
waste stream, is diverted to the BCDL stream.
I have evaluated five studies which estimate the effects
of a BCDL in Chapter 2. These studies have different assumptions which affect their outcomes. I evaluate each on
the validity of its assumptions. I use critiques of these
studies construct the framework within which the outcome of a
BCDL on curbside recycling in Orange County is predicted.
1.1 Definition of a Beverage Container Deposit Law
A Beverage Container Deposit Law (BCDL) or a bottle bill,
as it is often called, is a deposit-refund system which is
the brewer/bottler. For the soft drink industry, this is
usually initiated by the distributor. Retailers pay a deposit
to the distributor when they buy the beverages and receive adeposit from the consumer when they sell the beverage. When
the consumer returns the beverage container, the retailer
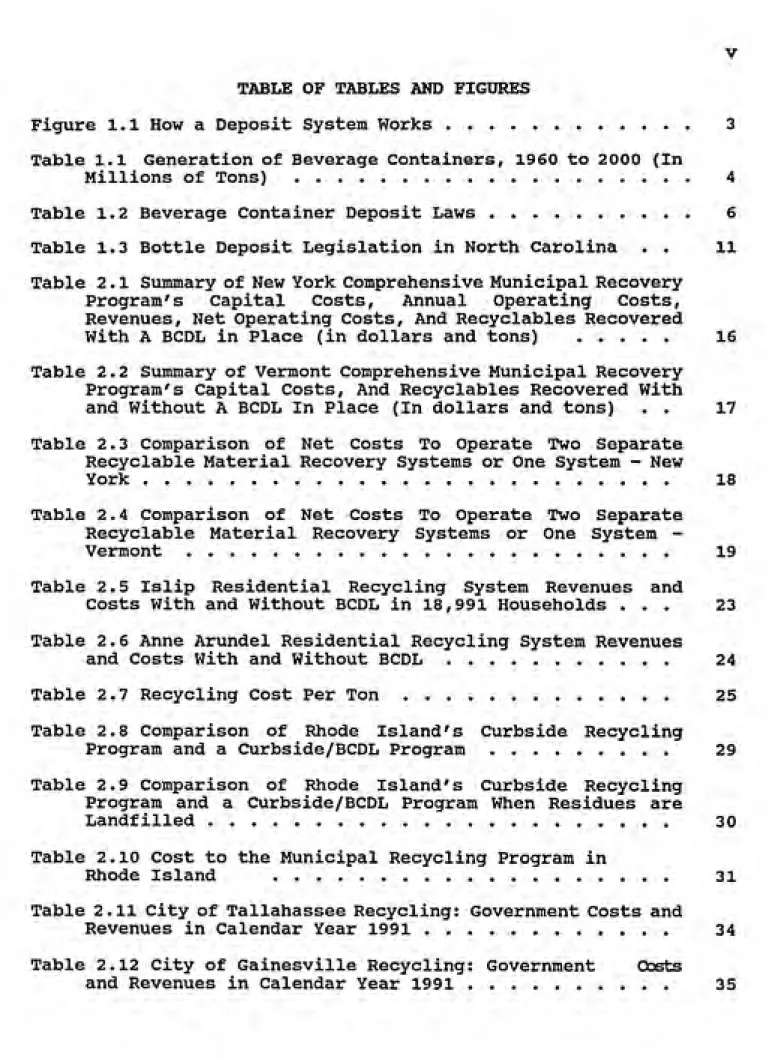
reimburses the consumer, and then is reimbursed by the distributor. Figure 1.1, taken from the US GAO report. Trade¬ offs Involved in Beverage Container Deposit Legislation illustrates the deposit return cycle.
1.2 The History of the Beverage Container Industry
After World War II, the steel and can industry
realized that there was an opening to expand the beverage
industry market. The beverage industry suggests that
consumers were interested in more convenient packaging. In
1935, beer was first packaged in nonrefillable cans. This was
followed by the emergence of the "one way" bottle. By 1970
the container mix was 40% nonreturnable soft drink packaging
and 76% non-returnable beer packaging. By 1986 the mix was 86% nonreturnable soft drink containers and 91% non-returnable
for beer containers^.
Figure 1.1 How a Deposit System Works^
Beverages Are Sold and Depostts Are Paid
Distributor
Retailer
Beverage
Consumer
Empty Containers Are
Redeemed for Deposits
Consumer
Empty Bottle
I
Retailer
Empty Bottle
i
Distributor
^General Accounting Office, Report to Congressional
Requesters, Trade-offs Involved in Beverage Container Deposit
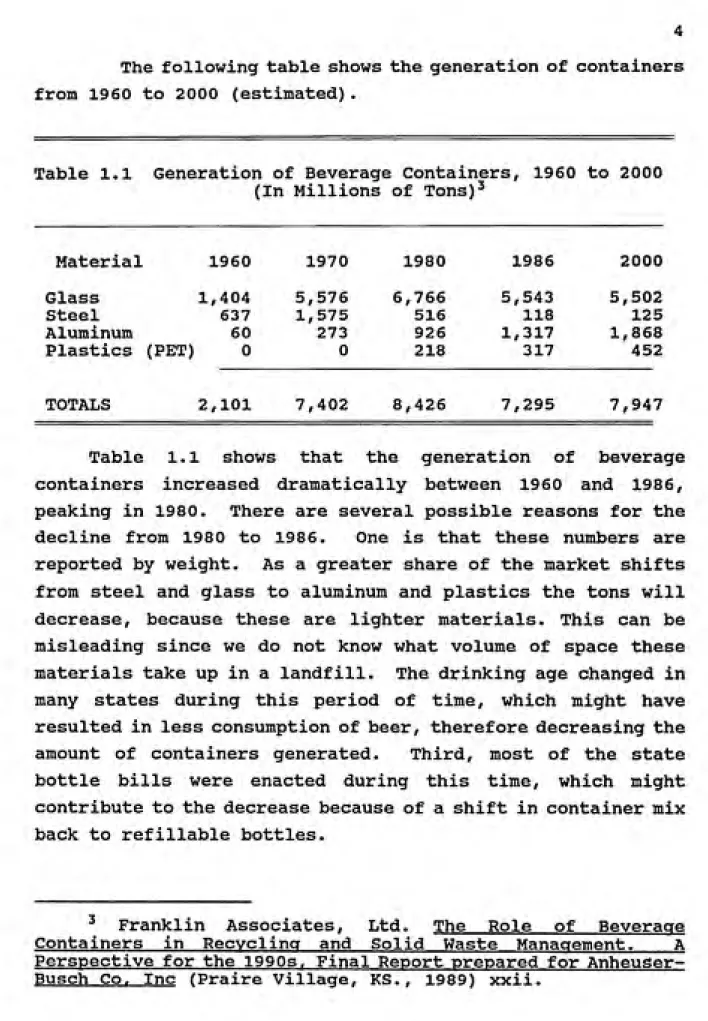
from 1960 to 2000 (estimated).
Table 1.1 Generation of Beverage Containers, 1960 to 2000
(In Millions of Tons)^
Material 1960 1970 1980 1986 2000
Glass * ' 1,404
Steel 637 Aluminum 60
Plastics (PET) 0
5,576 6,766 5,543 5,502
1,575 516 118 125
273 926 1,317 1,868
0 218 317 452
TOTALS 2,101 7,402 8,426 7,295 7,947 Table 1.1 shows that the generation of beverage containers increased dramatically between 1960 and 1986, peaking in 1980. There are several possible reasons for the
decline from 1980 to 1986. One is that these numbers are
reported by weight. As a greater share of the market shifts
from steel and glass to aluminum and plastics the tons will
decrease, because these are lighter materials. This can be misleading since we do not know what volume of space these
materials take up in a landfill. The drinking age changed in
many states during this period of time, which might have
resulted in less consumption of beer, therefore decreasing the
amount of containers generated. Third, most of the state
bottle bills were enacted during this time, which might
contribute to the decrease because of a shift in container mixback to refillable bottles.
' Franklin Associates, Ltd. The Role of Beverage
Containers in Recycling and Solid Waste Manacrement. A
Perspective for the 1990s. Final Report prepared for
Beverage container production will continue to increase
over the next few years. As Table 1.1 shows, the estimated increase from 1986 to 1990 was 8.9%. The number of bottlers also has decreased dramatically. In the soft drink industry the number of manufacturers dropped from 6118 in 1940 to 1011
in 1989.^ The remaining bottlers have increased in size and
serve larger areas, making nonreturnable bottles more convenient.
1.3 States that have Beverage Container Deposit Laws
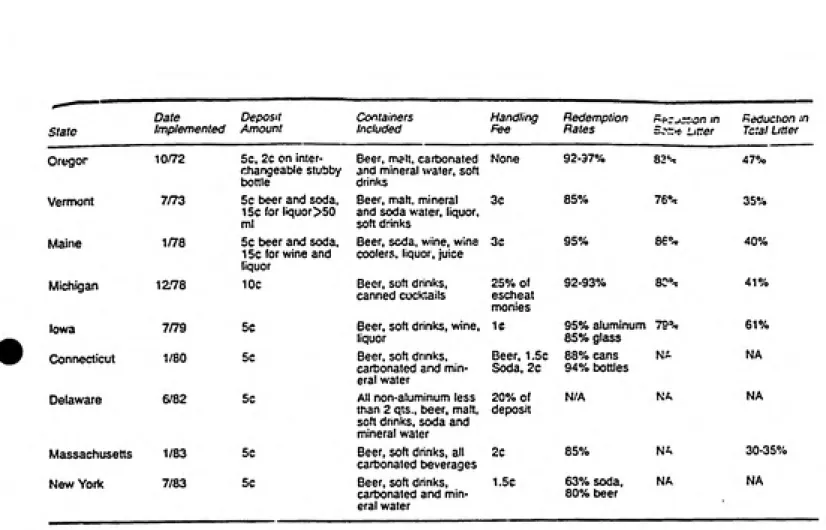
Nine states have adopted Beverage Container Deposit Laws. Table 1.2 shows the provisions of each law. This table
illustrates the wide variety of materials that can be collected and that a deposit system can be one or two - tier.
Two - tier systems have a lower deposit on bottles that can be interchanged between manufacturers.
One could argue that the California Beverage Container
Recycling and Litter Reduction Act should be included in this
chart. The major reason California has been excluded from
this chart is that there is no deposit per se. The containers can be redeemed by consumers for 2. 5<: for containers which are less than 24 ounces and 5<: for containers greater than 24 ounces. Distributors pay the state a 2C and 4<: processing fee
respectively for every beverage they distribute. The beverage
industry likes this initiative better than traditional bottle bills because the redemption is handled in state - certified
redemption centers and administrative costs are covered by the
money paid by the distributors that the consumers do not collect. This money also helps subsidize grants to nonprofit
''" Soft Drink Trends," Beverage Industry Annual Manual
Table 1.2 Beverage Container Deposit Laws^
state Date Implemented Deposit Amount Containers Included Handling Fee Redemption Rates '^rr^-r.-or in S.-'r^ Lirter Reduction :n Tctal LitterOregor 10/72 5c. 2c on inter¬
changeable stubby
tx)tlle
Beer, malt, cartKDnated
and mineral water, soft
drinks
None 92-37% 83=--. 47%
Vermont 7/73 5c beer and soda,
15c for liquor >50 ml
Beer, malt, mineral
and soda water, liquor,
soft drinl<s
3e 85% 76% 35%
Maine 1/78 5c beer and soda, 15c for wine and
liquor
Beer, soda, wine, wine
coolers, liquor, juice
3c 95% 86% 40%
Michigan 1278 10c canned cocktailsBeer, soft drinks.
25% of escheat monies
92-93% 80% 41%
Iowa 7/79 5c Beer, soft drinks, wine, liquor
1C 95% aluminum
85% glass
79% 61%
Connecticut 1/80 5c Beer, soft drinks,
carbonated and min¬
eral water Beer, 1.5c Soda, 2c 88% cans 94% bottles NA NA
Delaware 6/82 5c All non-aluminum less
than 2 qts., t>eer, malt, soft drinks, soda and
mineral water
20% of
deposit
N/A NA NA
Massachusetts 1/83 5c Beer, soft dnnks, all carbonated tieverages
2C 85% NA 30-35%
New York 7/83 5C Beer, soft drinks,
carbonated and min¬ eral water
1.5e 63% soda,
80% beer
NA NA
^Patricia Franklin, " Bottle Bill: Litter Control Measure
related programs. The retailer is totally left out of the
cycle and the distributors do not have to worry about
transporting bottles or having to take more bottles back than
they sold. The return rate is approximately 85% overall.^
For the purposes of this paper this system is not considered
a BCDL, because of the lack of the deposit side of the program.
Arguments often used against deposit systems are that
they are inconvenient and that people will refuse to
participate.^ However, redemption rates in the states that
have beverage container laws are between 63 percent and 97
percent.® The systems seem to be convenient or at least have
enough incentive built in for people to use them. Some people
will argue that just because bottles are getting back, a few people could be doing the returning. If they are being
returned by a third party, however, there might still be social value associated with the system. For example, if homeless people collected bottles which have been discarded and return them it might be a source of income for them. Gershman, Brickner & Bratton conducted a survey in which they asked residents of Islip, NY if they redeemed their bottles. Depending on the material of the bottle, the percentage of people who claimed that they redeemed their beverage
^Container Recycling Institute. Beverage Container
Deposit Systems in the United States (Washington D.C., 1992)
np.
^W.K. Moore and D.L. Scott, "Beverage Container Deposit
Laws: A Survey Of the Issues and Results," Journal of Consumer Affairs 17.1 (1983) 64.^These numbers came from state agencies in the respective
containers ranged from 74 - 80%.' Redemption rates do not
seem to be affected by deposit levels over 2<:. This statement
is based on studies in Michigan, Oregon, and Europe. A
possible explanation for this phenomenon is that "the
consumer's opportunity cost for returning containers is in
excess of the cost of forfeiting a deposit of two to ten
cents". ^°Beverage Container Deposit Laws were originally passed to
help control litter. The idea was that beverage containers
would be too valuable to throw out the window. Money would
also be saved on litter pick-up, and injuries due to broken
glass would decline. Table 1.2 illustrates that bottle bills
are effective as a deterrent of litter. Bottle litter has decreased between 76 and 88% while total litter has been
reduced between 30 and 47%." This helps explain why total
litter is reduced. Several BCDL states confirmed that the cost for litter pick-ups decreased after the law was enacted. (A
detailed explanation of various litter surveys can be found in
Appendix A).
The decline in available landfill space, and the
difficulties in siting new landfills and incinerators have
focused the nation's attention on waste reduction andrecycling. Senate Bill 111 passed in North Carolina requiring
'"Impact of Container Deposits on Curbside Recycling: Two
Case Studies", (Falls Church, VA: Gershman, Brickner, & Bratton, July 1991): V-5.
^°William Lesser and Ananth Madhaven, "Economic Impacts
of a National Deposit Law: Cost Estimates and Policy
Questions." Journal of Consumer Affairs 21.1 (1987) 132.
"These numbers came from a wide variety of state agencies
which are documented in Beverage Container Deposit Systems in
the United States which is written by the Container Recycling
1993.^^ Proponents of the BCDL suggest that bottle bill
legislation will help municipalities reach the 25% recycling
goal. If materials collected in the BCDL system are not
counted toward materials recycled then a BCDL would be a
detriment to counties trying to meet this goal.
BCDL supporters suggest that since BCDLs cause a
container mix shift toward returnable bottles, and because of
the high return rate which efficiently collects bottles for
recycling, solid waste is decreased. (See Appendix B for a
discussion of the effects of BCDLs on solid waste in Michigan
and Maine).
1.4 North Carolina's Interest in Beverage Container
Deposit LawsTable 1.2 shows that no new Beverage Container Deposit
Laws have been passed since 1983. However, due to the
reduction of landfill space and the difficulty of siting new
solid waste disposal facilities, a new interest in methods
that increase recycling has emerged. This interest includes
beverage container deposit laws. Proponents see this as a way
to promote recycling and source reduction. Source reduction
occurs because there is often a shift back to returnable
containers. Legislators in both the federal government and in
North Carolina have tried to pass Beverage Container Deposit
Laws during the last ten years.
At the national level, bottle bills have been introduced
almost every year since 1977. The major supporter of the
bills at the national level has been Rep. Paul Henry (R-MI).
^^Lee M. Mandell and Matthew R. Banks,What are We Doing
In 1991 a bottle bill was introduced to be considered as an
amendment to the reauthorization of RCRA." The provisions
of this proposed bill are presented in 40CFR part 244. The
intent is to reduce waste by making all beverage containers
returnable and encouraging the recycling of beverage
containers. The beverages included in this bill are
"carbonated natural or mineral waters, soda water and similar
carbonated soft drinks; and beer or other carbonated malt
drinks in liquid form^^". The deposit level is set at 5<:
except in areas with a lower deposit already. There is no
handling fee proposed. The Comprehensive Recycling Act of
1991 (H.R. 945) Which would set recycling goals in programs of
the state's choice is an alternative to the BCDL.^^ It
requires that states offer recycling to 20% of their state
within two years of the bill's passage. The beverage industry
supports this bill. A bottle bill was voted on July 2,1992 by
the full Energy and Commerce Committee and was defeated by a
27 to 17 vote.
In North Carolina beverage container deposit laws have
been introduced 24 time, first in 1969. Table 1.3 lists all
the bills that have been introduced on the subject since 1969.
The last bill. House Bill 1007 introduced by Karen Gottovi
(D-Wilmington) in 1991, was defeated. It would have enabled the
Legislative Research Commission to study the issue of a
beverage container deposit law.
^^Stephen Barlas, "Beverage Industries Support Bottle Bill
Challenger," Beverage World June 1991: 65.
^^40CFR Ch 1 (7-1-91 Edition) Part 244 - Solid Waste
Management Guidelines for Beverage Containers, 279.
15
Table 1.3 Bottle Deposit Legislation in North Carolina
Year______Bill No. Short Title____________________Disposition
1969 H 1017 Soft Drink / Bottle Deposit left in committee
S 791 Soft Drink Containers, cleaning Rat. Ch. 1068
1971 S 177 Deposit on Soft Drink or Beer Cans/Bottles unfav.
1973 H 1329 Redemption Beverage Containers reptd. unfavorably
S 828 Senate version of H 1329 left in committee
S 959 Control Beverage Container Litter left in committee
1975 H 457 Beverage Container Return postponed indef. S 365 Senate version of H 457 reptd. unfavorably 1977 H 697 Refund Required on Drink Bottles reptd. unfavorably H 1181 Drink Bottle Deposit Referendum reptd. unfavorably H 1203 Drink Bottle Tax Fund, Uses reptd. unfavorably H 425 Litter Control Resource Recovery left in Sen. Comm. 1979 H 857 Deposit for Beverage Container reptd. unfavorably
H 1419 Bottle Bill Referendum Funds reptd. unfavorably 1981 H 513 Beverage Container Referendum reptd. unfavorably
H 1292 LRC Studies Res. 61 Sec 1 (14)
1985 H 1141 Soft Drink Bottles / Alcohol in Parks reptd. unfav.
1987 H 1212 Recyclable Containers Required left in committee
1989 H 1225 Containers; Deposit(p.70) left in committee S 958 Solid Waste Advance Fee left in committee H 2365 Raise Soft Drink Tax left in committee
1991 H1007 Plastic/Glass Container Deposit postponed indef. H 97 Uniform Color Disposable Glass left in committee
S 229 Simplify ^oft Drink Tax(study) Incorp. in Ch.754
Source: Computer Search Completed by the North Carolina
II. THE EFFECTS OF BEVERAGE CONTAINER DEPOSIT LAWS ON
CURBSIDE RECYCLING
One of the arguments most frequently used against
beverage container deposit laws is that they have a negative
impact on curbside recycling. One of the strongest arguments
invoked is that a BCDL pulls aluminum, which has the most
stable and profitable market of recyclable materials, out of
the recycling waste stream. The revenues gained from the sale
of recyclables help offset some of the costs of running a
recycling program. Proponents of BCDLs, however, argue that
the amount of materials pulled into the waste stream are
increased by having a dual system. They suggest that
collection costs are avoided since redemption centers are at
retailers where the consumer already shops. They also suggest
that there is no cost to the municipal government, so they
argue that BCDLs are cost-effective ways to increase the
amount of recyclables.
Since the nine states with BCDLs had enacted there laws
before curbside recycling was popular, there are no actual
case studies available. In this paper, I use five studies
which estimated the effects of BCDLs on curbside recycling, in
order to develop a model to determine the structure of a model
that will be used to estimate the effect that a beverage
container deposit law would have on curbside recycling,
specifically in Orange County, North Carolina. These studies
include one conducted by Franklin Associates, LTD. for
Anheuser-Busch Companies,Inc; one conducted by the National
Container Recycling Coalition; one conducted by Gershman,
Brickner & Bratton, Inc. for the National Soft Drink
Association; one by the Tellus Institute; and one by the
Florida Public Interest Research Group. I chose to examine the
results of these studies when fighting BCDLs, for example, in
the pamphlet "Why Comprehensive Recycling Is a Solid Winner.
Why Forced Deposit Laws are a Solid Waste" which distributed
by the National Soft Drink Association all three studies are
guoted to show that comprehensive recycling costs more when a
BCDL is in place. I chose the study by the National Container
Recycling Coalition (Pat Franklin) because it shows that a
dual system can be cheaper than a single comprehensive
recycling system and because Rep. Paul Henry has quoted it at
a congressional hearing on a national beverage container
deposit law. I chose the FIPIRG because it supported the
NCRC's findings. In the next five sections, each study is
examined in depth.
2.1 The Franklin Associates, LTD. Model
The report, The Role of Beverage Containers in Recyclincf
and Solid Waste Management A Perspective for the 1990s, was
prepared by Franklin Associates, LTD. for Anheuser-Busch in
April of 1989. It examines the economic costs associated with
running a dual system which includes a BCDL and comprehensive
curbside recycling compared to a single comprehensive curbside
recycling program. They applied their model to New York State
and Vermont. The model estimated amounts recycled, operating
and processing costs, and capital costs. These values were
estimated for three different size communities and then a
weighted average was calculated to determine these figures on
14
2.1.1 Structure and Assumptions
This is the most complicated model discussed in this
chapter. The seven major assumptions made by Franklin
Associates, LTD are listed below:1) The recycling program would be operated statewide and
would be mandatory. A participation rate of 80-90% is
needed to sustain this model. Also the capture rate of
recyclables must be high (85-100%).
2. Adequate capital investment will be made to collect and
process recyclable materials. ,
3. Newspapers, glass containers, plastic containers,
and aluminum cans will be collected in the program.
4. When mandatory recycling is the only system in place,
buy-back centers, drop-off centers and scrap dealers
will operate.5. "Revenues realized from the mandatory recycling paxpam
are for fully-prepared materials brokered to or delivered
directly to end users of recovered materials. Programs
structured to operate via intermediate processing facilities
(IPCs) where materials flow to a scrap dealer for further
preparation and marketing will realize a lower revenue."^*
6. All materials will be accepted by the market, "however
prices will fluctuate cyclically for all materials.''^" The
most dramatic fluctuations will be for paper which will
^^Franklin Associates, LTD. 50,
fluctuate from negative values to $50 a ton.
7. "Where beverage containers deposit laws are in effect,
there will be two distinct recyclable materials
recovery systems in place, one operating via retail
stores and wholesalers and one via
municipally-sponsored recovery programs. (In fact, deposit-type
beverage containers could be placed in a mandatory
recycling program because the citizen values
convenience more highly than deposits) . "^°.
2.1.2 Franklin Associates, LTD's Findings
Tables 2.1 and 2.2 show the final calculations of cost
per ton for the New York and Vermont municipal recycling
markets at 80 and 90% participation rate. The Franklin
Associates, LTD. conclude that a dual system costs more per
ton than a single municipally based program. The amount
collected in the municipal recycling program is reduced for
the curbside program, therefore, the operating costs decrease.
The material revenue costs decrease more though because
aluminum is the highest revenue generator and almost all of
it goes to the BCDL. In Tables 2.1 and Table 2.2 the quantity
of recyclables collected in the municipal recycling program
decrease because the beverage containers are diverted to the
BCDL system. Tables 2.3 and 2.4 show that more materials are
collected in a dual system overall. They also show that
curbside recycling programs' cost-effectiveness depend on the
amount of materials collected and on the revenue they
generate.^' The Franklin
^^Franklin Associates, LTD 49-50,
SUMMARY OF NEW YORK COMPREHENSIVE MUNICIPAL RECOVERY PROGRAM*8 CAPITAL COSTS«
ANNUAL OPERATING COSTS, REVENUES, NET OPERATING COSTS, AND
RECYCLABLES RECOVERED WITH AND WITHOUT A BCDL IN PLACE
(In dollars and tons)
Category
Capital Investment
Operating Costs
Revenue @ 90% Participation
Net Operating Costs
Quantity of Recyclables
Recovered @ 90% Participation
tonsNet Operating Costs - $/ton
No BCDL
287,018,000
180,258,000"
93,800,000
86,458,000
1,461,000
59.18
With BCDL
287,018,000
148,245,000
45,930,000
102,315,000
1,173,000
87.22
Dlff«renoa
(32,013,000)
(49;870,000) *
15,857,000
(288,000)
28.04
Revenue § 80% Participation
67,885,000
28,975 ,,000
(38,910,000)
Quantity of Recyclables Recovered
@ 80% Participation - tons
972,000761,000
211,000Source: Franklin Associates, Ltd.
SUMMARY OF VERMONT COMPREHENSIVE MUNICIPAL RECOVERY PROGRAM* 8 CAPITAL
€
SOBT»t
ANNUAL OPERATING COSTS, REVENUES, NET OPERATING COSTS, AND
RECYCLABLES RECOVERED WITH AND WITHOUT A BCDL IN PLACE
(In dollars and tons)
Categoiry
Capital Investment
Operating Costs
Revenue @ 90% Participation
Net Operating Costs
No BCDL
11,213,800
5,217,000
2,443,000
2,774,600
With BCDL
11,213,800
4,234,000
881,0003,353,000
Differenoa
(983,000)
(1,562,000)
579,000Quantity of Recyclables
Recovered ©90%
Participation - tons
Net Operating Costs - $/ton
27,600
100.52
20,900 160.43
(6,700)
59.91
Revenue 6 80% Participation
Quantity of Recyclables
Recovered § 80%
Participation - tons
1,827,000
17,300
503,000
12,300
(1,324,000)
(5,000)
Table 2.3 Comparison of Net Costs to Operate Two Separate
Recyclables Materials Recovery Systems or One
System - New YorkNet Annual Costs of
Recovery Options Municipally-based nondeposit materials
Beverage container
deposit system
Total Cost
Single municipally-based system
Increased cost of two
separate systems
system
Dollars $/ton Tons
Recovered
102,300,000 87 1,173,000
124,300,000 235 529.000
226,600,000 134 1,702,000
86,500,000 59
1,461,000^°
140,100,000 75Source: Franklin Associates, Ltd. 95,
20,
Table 2.4 Comparison of Net Costs to Operate Two Separate Recyclables Materials Recovery Systems or One
System - Vermont^^
Net Annual Costs of
Recovery Options
Municipally-based
nondeposit materials Beverage container deposit system
Total Cost
Single
municipally-based system
Increased cost of two
separate systems
System
Dollars $/ton
3,335,000 160
2.575,000 121
2,928,000 140
2,775,000 101
3,153,000 39
Tons
Recovered
20,900
21.300
42,200
27,60022
Source: Franklin Associates, Ltd. 93.
^^Tonnage Recovered in private program is excluded;
refillable bottles are also excluded.
Associates, LTD. concluded:
"Comprehensive materials recovery programs are more cost-effective when they include beverage containers... There would be additional overall
savings in a single system because the beverage
container deposit system operating independently
has a net cost also. In either case the
unrecovered costs are borne by the citizens ||23
The Franklin Associates, LTD. also conclude that a single
comprehensive system is more cost efficient than a dual system.
2.1.3 Analysis of the Franklin Associates, LTD.
Study
The beverage industry frequently quotes this study to support their opposition to BCDLs. Supporters of BCDLs feel that the bias of this study can be seen in the executive summary which states that "An opportunity of uncommon circumstances now exists for the beverage industries and packagers to participate in comprehensive recyclable materials
recovery programs and, at the same time, work toward solutions
that could phase out beverage container deposit laws." One major criticism of this study is that the participation rate of 90% is not realistic. It is more likely that New York and Vermont could reach levels comparable to those in model
recycling programs like the one in Seattle, Washington where
they are recycling around 40%. Critics of this study suggest that if participation rates are low in curbside programs then the BCDL becomes more important due to the fact that more
materials are collected in a dual system. As we saw in Chapter
1 return rates are extremely high for BCDL.
The Franklin Associates factor a cost for a BCDL into
their cost analysis. This figure is based on costs that are
incurred by the beverage industries (See Appendix D).^^ The
Franklin Associates suggest that the costs looked at in this paper are those that the average citizen pays. They suggest that taxpayers will have to pay for increased comprehensive
recycling as well as costs incurred by the beverage industries
(these costs would be seen in higher prices and possibly less
consumption resulting in lost sales and excise, and in the case of alcoholic beverages, taxes). Pat Franklin of the National Container Recycling Coalition, suggests that if only the costs to the municipality are considered, and if one
assumes that there is no cost associated with a BCDL for the
municipality (this point will be more fully scrutinized in the
Rhode Island Model section) the costs to Vermont to run a dual program would be $22/ton and the cost to New York would be
around $60/ton.^^
One other point Ms. Franklin makes is that the capital
investment needed to sustain a program with these costs is probably not feasible. The Franklin Associates projected $267
million capital investment for the New York comprehensive
recycling program and an $11 million capital investment in Vermont. New York allotted $26 million and Vermont allotted $3.5 million for recycling efforts statewide in 1989. If the
Franklin Associates estimates are right the governments of those state would have to pay $241 and $5.2 million
respectively to run a comprehensive recycling program.^^
^^Mandell and Banks 10.
^^ Pat Franklin, Critique of the Franklin Associates.
LTD.Study. National Container Recycling Coalition, September18, 1989. 26
2.2 The Gershman, Brickner & Bratton, Inc. Study
In July 1991 Gershman, Brickner & Bratton, Inc. completed
a study. Impact of Container Deposits on Curbside Recycling;
Two Case Studies for the National Soft Drink Association.
2.2.1 structure and Assumptions
This study compared the town of Islip, New York with
Anne Arundel County, Maryland. GBB analyzed the economic
effects of the BCDL in Islip and estimated the effects in Anne
Arundel based on actual cost figures from 1990. A detailed
description of their model is shown in Appendix D. The
results of the analysis are shown in Table 2-5 and Table 2-6.
One assumption they make but do not state is that all the
waste that is collected in the BCDL would be transferred to the recycling program.GBB then developed a model for a generic community of
100,000 people with 40,000 households. The major assumptions
in this study are that the recycling quantity per household is
6.4%, that processing costs are 50 dollars per ton, and that
collection costs are 2 dollars per household per month. The
detailed analysis of the generic community is shown in
Appendix F. The findings of the study for a community which
Table 2.5 Islip Residential Recycling System Revenues
and Costs With and Without BCDL in 18,991
Households (1990)Revenues or (Costs)
Paper
Non-Deposit Containers
Deposit Containers Total Revenues
With BCDL
$(55,599) $ 24,578
$ 26.338
$ (4,683)
Without BCDL
$(55,599)* $ 24,578
$107.804
$ 76,783
Costs
Collection
Processing
Operating Costs
Revenue or (Costs)
Net Program Costs
With BCDL
929,311
365.500
$1,299,494
$(4.683)
$1,299,494
Paper had a negative value during 1990.
Without BCDL
929,311
415.700
$1,268,228
- $76.783
$1,268,288
Table 2.6 Anne Arundel Residential Recycling System Revenues
and Costs With and Without BCDL
(1990) Revenues or (Costs)
Paper
Non-Deposit Containers Deposit Containers
Total Revenues
With BCDL
$ 6,219 $ 27,556
S 22.715
$ 56,490
Without BCDL
$ 6,219 $ 27,556
$ 90.982
$124,757
Costs With BCDL Without BCDL
Collection
Processing
Operating Costs
Revenue
Net Program Costs
316,777
231.158
', 547,935
- $56.490
$419,455
316,777
274.995 591,772
S467.015
$467,015
Table 2.7 Recycling Cost Per Ton ^^
Tons Net Cost Cost/Ton
With BCDL 8,844 1,284,565 $145
Without BCDL 10,601 1,235,199 $117
The final part of the GBB report is a survey they took of
Islip, New York residents. 13,000 surveys were sent out and
2,919 were returned. In GBB's summary of major findings they
point out that 49% of the residents of Islip would like to
eliminate the BCDL. However, 99.3% of the respondents also
said either they or a member of their household participated
in the program. Also they suggest that the most important
packaging feature is recyclability while refillability and
redemption value rate much lower.
2.2.2 GBB's Findings
The major findings of the GBB study are listed below.
281) "BCDL has a negative impact on revenues to recycling
programs from sale of containers. The increased costs to
process and collect materials in a non-BCDL community are more
than offset by the revenues from the sale of additional
deposit containers."^'
2) "Over 70% of the revenue in Anne Arundel County
2^GBB IV-3.
28,
GBB I-l.
29,
comes from the sale of beverage containers."'° This is
calculated by taking the $90,982 worth of revenue created by
deposit material and dividing by the total revenue figure of
$124,757. The revenue from deposit containers offsets 15% of
the total costs of the curbside program.
3) The recycling rate is 18% and the redemption rate is
1.6% in Islip. The recycling rate in Ann Arundel, MD. is
17.7%.4) With a dual system, 23% of beverage containers still
end up being disposed.
5) The generic analysis shows that a community can
offset up to 12% of its operating costs from the sale of
beverage containers.
2.2.3 Analysis of GBB's Findings
The analysis of the effect of a BCDL on Islip, New York
is different then the rest of the studies examined in thischapter due to the fact that it looks at a BCDL already in
place and what would happen if it were removed. The structure
of this study is to assume that all of the materials collected
in the beverage container deposit system would be transferred
to the curbside recycling program. However this assumption
probably overestimates the number of beverage containers that
would return to the curbside program. Some people might not
be served by the curbside program and would be unwilling to
use drop-off services, and some people might not be willing to
recycle without the economic incentive. Even so, the
processing costs should have increased proportionately to the
amount of materials added to the system so the numbers
generated should be valid. Also Islip might not be a typical
situation since it is known for its garbage problems.
2.3 The Rhode Island Model
Patricia F. Franklin of the National Container Recycling
Coalition, presented a paper at the Windstar in Washington
Conference on September 15, 1990, called "Curbside Recycling
and Deposits— Removing More from the Waste Stream for Less**.
A model which is similar to the GBB model is used to determine
the effect of a BCDL on curbside recycling in Rhode Island for
four scenarios. The scenarios are a Curbside program
(residues being landfilled), a Curbside program (residues not
being landfilled), a Curbside/BCDL program (residue being
landfilled), and a Curbside/BCDL program (residues not being
landfilled). Residues are primarily made up of contaminated
glass which some reports say is being landfilled.
2.3.1 Structure and Assumptions
The major assumptions are:
1) The recycling program would serve 660,000 residents of
Rhode Island (approximately half the state) in one
comprehensive program.
2) The data for only a curbside program are projections
for 1990 made by the Johnson Material Recycling Facility
Financial Analysis.
3) In a dual system no beverage containers end up in the
curbside recycling program.
4) There is no cost to the municipal government for
5) 85% of beverage containers are returned through the
BCDL.
6) Operating and per-ton collection costs remain the same
under a dual system ($82/ton).
7) Total beverage containers generated annually are
estimated to be 306,240,000 which is based on a figure of 464
per capita. The markets shares of each container are shown in
table 2.8. They are based on statistics used in "The Role of
Beverage Containers in Recycling and Solid Waste Management"
which was written by the Franklin Associates, LTD.
8) The revenues for the materials are as follows:
Aluminum = $958 per ton Glass = $48 per ton
Plastic (PET) = $157 per ton
2.3.2 Findings of the Rhode Island Study
The major finding of this study is that a dual system can
be cheaper on a cost-per-ton basis than a single curbside
recycling program as shown in Table 2-8.^' This table shows
the results when the residues are recycled. The more
realistic scenario is that the residues will be landfilled.
Some bottles may be unrecyclable due to dirt or breakage. The
National Container Recycling Coalition's estimation of cost
per ton and tons collected when the residues are landfill is
shown in Table 2.9.^^
^^Patricia Franklin 48.
32t
ͣ
^Pat Franklin, Curbside Recycling and Deposits —
Table 2.8 Comparison of Rhode Island's Curbside Recycling
Program and a Curbside/BCDL Program
Material
Rhoae Island Curbside Program
(Protected 1990 Figures) Combined Curbside Recycling/Bottle BHi________{Estimated Figures)_______ Tons Cost of Tons Cost of
Removed Revenue Collection (1) Removed Revenue Collection
Newspaper 27,800
Aluminum HOPE PET Tin Glass Residue Totals 625 725 800 2,600 6,700 7.500 43,600 599,000 106,500 125,300 39,000 322,700 0 2,291,300 51.500 59,200 65,900 214,300 552.200 618.200 27.800 2.666 725 1.562 2.600 22.605 (2) 3,450 43.600 0 106.500 0 39,000 147.936 0 2.291,300 0 59.450 0 213.200 252.724 282.900
46,750 51,236,100 $3,853,400 61,408 $337,036 $3,087,874
Operating costs
Collection costs
Subtotal operating cos:
Revenue
Net operating cost Cost per ton of
material removed
Curbside Program
Without Bottle Bill
$1,779,600
•*ͣ $3,853,400 $5,633,000 -$1,236,100
$4,396,900
$94.05
Combined Curbside
Bottle Bill Program $1,779,600
$3,087,874 $4,867,474 -$ 337.036
$4,530,438 $73.77
(1) $82.42 was used as Vte average cost of collection per toa l>ased on total collection costs of $383,500
in the Johnston MRF Financial Analysis. Column may not sum to total due to rounding.
(2) 19,523 tons oollectec through BCDL 3.082 tons collected through curbside program. Assumes that
46% of trie glass in the curbside program is non-t>everage container glass (per "U.S. kxJustrial Outlook
Table 2.9 comparison of Rhode Island's Curbside Recycling
Program and a Curbside/BCDL Program When Residues are
Landfilled
Rhode Island's
Curbside Program
Estimated Figures |
for a Combined Curbside/BCDLProgram
Total Tonnage 39,250 57,958
Cost per Ton $112.02
$78.17 1
2.3.3 Analysis of the Rhode Island Study
The reason the dual system is cheaper is the assumption
that there are no costs associated with a BCDL. However,
there are costs at all levels in the beverage industry, and
there are administrative costs associated with implementing a
BCDL. Temple, Barker and Sloan estimate that the
administrative costs of the BCDL range from $l,700-$57,000
annually for the nine bottle bill states. Some of these
administrative costs include regulatory development, and
information and enforcement. These costs include salaries for
either full or part-time employees who provide regulatory
support, answer consumers' questions and provide information,
or for employees who enforce the regulations.^^ Most of
these tasks may be executed at the state level. If that is
true then the assumption that there is no cost for a BCDL to
the municipal government may be valid. If the costs to the
municipality running the curbside program are evaluated, only
the materials collected from the curbside program should be
considered in the cost per ton analysis. Below are the
33n
^Temple, Barker and Sloan, Economic Impacts of a National
Beverage Container Deposit Lav, Prepared for the National Soft
results of looking at the problem in this context. A detailed
explanation of calculation of these nvunbers are shown in
Appendix G.
Table 2.10 Cost to the Municipal Recycling Program in
Rhode Island""""
Tons Removed in
Curbside Program
Only
Cost per Ton
Curbside Program (residues
landfilled)
39,250 $112.02
Curbside/BCDl
(residues landfilled)
34,250 $135.12
Curbside Program (residues not landfilled)
46,750
$94.05 1
Curbside/BCDL
(residues not landfilled)
37,657 $122.74
The costs of running a dual program becomes more
expensive when the situation is framed in this manner. The
costs to run a dual program increase by 20% when residues are
landfilled and by 31% when they are recycled. The material
collected in a dual system also increases. When the residues
are landfilled the total amount of recyclables in the system
increases by 48% and when residues are recycled they increase
by 31% (See Table 2.9 for total amount collected in a dual
system) . The most likely scenario is the one where residue is
landfilled. In the BCDL system less residues are generated due
to the fact that the collection process under a BCDL is more
efficient. In other words, if a person tries to return a
bottle that is not properly cleaned for recycling under a
BCDL, the retailer will most likely reject the bottle and not
Rhode Island has an unusually high percentage of glass
bottles. Approximately 30% of their beverage containers are
glass bottles which is above the national average of 20%. In
other states where the glass percentage is lower, more
beverages would be packaged in aluminum or plastic. Both of
these materials have higher revenues and would probably hurt
the recycling program more under the bottle bill. Finally Ms.
Franklin suggests that the increased tonnage in a dual program
would result in an avoided disposal cost of between $448,000
and $570,000 (with a tipping fee of $30 a ton). The issue of
avoided disposal costs is discussed more thoroughly in the
next study.
2.4 The Florida Public Interest Research Group Study
Bill Wood of the Florida Public Interest Research Group
Educational Fund (FIPIRG) conducted a study which is very
similar to the study conducted by Pat Franklin of the National
Container Recycling Institute (in fact the CRI and the
National Environmental Law Center contributed research
assistance). It projects the effects that a BCDL would have
on curbside/drop-off recycling in four communities in Florida.
2.4.1 Structure and Assumptions
The impacts of a beverage container deposit law on
curbside recycling in four cities in Florida were assessed.
The four cities studied were Tallahassee, Gainesville,
Hialeah, and Miami. The first assumption is that all
beverage containers are pulled from the curbside programs.
Since the author had difficulty collecting data for the actual
scrap revenues and other values, he used the values given in
the GBB study analyzed above. The author suggests that the
case scenario. One of the major criticisms he has of the GBB
study is that it fails to take into account the avoided
disposal costs. In this study avoided disposal costs are
estimated as the avoided landfill tipping fee. Mr. Wood feels
these are conservative estimates of avoided disposal costs
because they do not take into account lowered processing,
transportation, and other solid waste management costs. The
information for material tonnage was taken from actual data
for the county and then a percentage based on population was
calculated and used to determine the amounts of materials generated for each city.
2.4.2 Finding of the Florida PIRG Ed Fund Study
Tables 2.11 - 2.14 show the results of this study. The
details of how these numbers were calculated are shown inAppendix H. The data show that a dual program is less
expensive to operate on a cost per ton basis when avoided
disposal costs are subtracted. These are higher in a dual
system because more waste is diverted in the dual system. The
Florida PIRG Education Fund conclude that more waste is
diverted in a dual system, and the government management costs
are decreased. They estimate beverage container recycling
will quadruple in Florida if a BCDL is passed.
2.4.3 Analysis of the Fl. PIRG Ed. Fund Study
The two assumptions that influence the results of this
Table 2.11 City of Tallahassee Recycling: Government
Costs & Revenues in Calendar Year 1991I. Curbside without Bottle Bill (as exists now)
II. As Projected via Curbside and Bottle Bill Combined
I. Curbside II. Curbside and
W/O BB BE Combined
COSTS/REVENUES
Collection Costs $644,823
Processing Costs 129.954
Total Operating Costs $774,777 $728,290
Revenue from Sale of - 198,397 - 91,263Scrap Materials
---$576,380 $637,027
Avoided Disposal Costs - 82.152 -114.948
Net Operating Costs $494,228 $522,079
TOTAL TONS DIVERTED: 4,564 6,386Table 2.12 City of Gainesville Recycling: Government
Costs & Revenues in Calendar Year 1991I. Curbside without Bottle Bill (as exists now)
II. As Projected via Curbside and Bottle Bill Combined I. Curbside II. Curbside and
w/o BE BE Combi ned COSTS/REVENUES
Collection Costs $260,000
Processing Costs 71.000
Total Operating Costs $331,000 $311,000
Revenue from Sale ofScrap Materials:
Newspaper (ONP) 7,047
---Plastic
PET ---HDPE
Glass 14,230
Aluminum 6,752 Metal 1,801 - 39,970
$291,030 Avoided Disposal Costs - 120.960
Net Operating Costs $170,070
TOTAL TONS DIVERTED: 2,688GOV'T COST/TON DIVERTED: $63
Source: Florida Public Interest Research Group 61.
3, 7,
403 392
1,331 - 22,366
$288, 634 -228. 634
$103, 774
4. 108
Table 2.13 City of Hialeah Recycling: Government
Costs & Revenues in Calendar Year 1991
I. Curbside without Bottle Bill (as exists now)
II. As Projected via Curbside and Bottle Bill Combined
Diversion savings shown as two figures:
now; Dade Landfill disposal rate of $45/ton and after 10/92 when rate is estimated to rise to $54/ton.
I. Curbside
w/o BE
COSTS/REVENUES
Government Operating Costs (Collection & Processing)
Revenue from Sale of
Scrap Materials
Avoided Disposal Costs Net Operating Costs
TOTAL TONS DIVERTED:
$400,000
- 108,000
$292,000
now
II. Curbside and
BE rnmbi ned
$376,000
- 50,000 . $326,000
after noH after
-178.000 -213.000 -285.000 -342.000
$114,000 $79,000 $41,000 $0
3,948 6,332
GOV'T COST/TON DIVERTED: $29
after
$20 m
after
Table 2.14 City of Miami Recycling: Government Costs & Revenues in Calendar Year 1991
I. Curbside without Bottle Bill (as exists now)
II. As Projected via Curbside and Bottle Bill Combined
Diversion savings shown as two figures:
now: Dade Landfill disposal rate of $45/ton and
after 10/92 when rate Is estimated to rise to $54/ton.
I. Curbside
w/o BB COSTS/REVENUES
Government Operating Costs (Collection &
Processing)
Revenue from Sale of
Scrap Materials
Avoided Disposal Costs
Net Operating Costs
TOTAL TONS DIVERTED:
$526,000
- 72,000
$454,000
II. Curbside and BB Combined
$494,000
- 33,000
after
$461,000
noM after
-113.000 -136.000 -408.000 -489.000
$341,000 $318,000 $53,000 $0
2,516 9,064
GOV'T COST/TON DIVERTED: $136
after
$126 $€
after
n/at$0]
government to run a BCDL and that the landfill diversion costs
for a dual system are more due to the fact that more materials
are collected in a dual system. The first issue, no cost to
the municipality, was discussed in the analysis of the Rhode
Island Model and is the same for this study. The consumer
ends up paying for the system, but from a municipal government
viewpoint, if all enforcement and administrative costs are
handled by the federal government, then this can be a valid
assumption. The results of
looking at only the materials collected in the recycling
program before and after the passage of a BCDL are shown in
Table 2.15. As one can see there is no consistency. In the
case of Tallahassee, it costs more to run a curbside program
under the dual system, whereas the three other municipalities
would save money under a dual system when a landfill avoidance
cost is considered. If the municipal point of view is used
and the landfill avoidance costs are not considered the dual
system is always more expensive than the curbside only
solution. This is shown in Table 2.16. The assumption
that the landfill avoidance cost will be greater for a dual
system depends on the amount of materials collected in each
system. This assumption is valid today. Most recycling
programs capture below 4 0% of recyclables. If that 40% is
constant across all materials, in other words 40% of newspaper
and 40% of beverage containers, etc. are captured, then the
BCDL which has a return rate of approximately 85% (See Chapter
1) captures more materials than curbside/ drop-off.
Unfortunately very few studies actually break down the actual
amounts of each material that are generated and recycled, so
it is difficult to determine the actual percentage of each
material that is being recycled. If curbside recycling ever
reaches the point where it captures 85-90% of the beverage
container waste stream then this assumption will not hold
true. However as we saw in the Franklin Associates, LTD.
39
Table 2.15 Cost of Curbside Recycling vs. Curbside/Bottle
Bill When Only the Material Collected in the Curbside Program
are Consider
Town Tonnage in
Curbside after
BCDL enacted^*
Cost per Ton of only
Curbside
Cost per Ton
Curbside after
BCDL
Enacted'^
Tallahassee 3,703 $108 $149.09
Gainesville 2,138 $63 $48.54
Hialeah 2,820 $29 $14.54
Miami 2,039 $136 $25.99
Table 2.16 Cost of Curbside Program vs.Curbside/Bottle Bill
When Only the Materials Collected in the Curbside Program are
Considered and the Landfill Avoidance Cost is not Considered
Town Cost of Curbside
Only when Landfill Avoidance isn't
Considered
Cost of Curbside when a BCDL is
enacted and
Landfill Avoidance
isn't Considered
Tallahassee $125.74 $172.03
Gainesville $108.27 $135.00
Hialeah $73.96 $115.60
Miami $180.45
$226.09
^^These number were reported by the various cities and
have been adjusted to not include the estimated residue
material.
35r
'These numbers were calculated by taking the total cost
very expensive.
One criticism of this study is the way they calculated
the numbers for the curbside with BCDL program. They
took the number presented in the GBB generic analysis and
determined the percentage difference between the curbside-only
program and the dual program (for example, in the Tallahassee
scenario, the total costs were calculated by taking $774,777
the value for a single program in the generic analysis vs.
$728,290 for a dual program and saying that this is 94% of the
first value). The value for the second column of the generic
GBB analysis were actually based on the number of households
times the average collection costs, and the operating costs
times an estimated quantity of recyclables (which was
determined by estimating what would happen to each material
if a BCDL were enacted) , not a percent difference. The
numbers for the dual program in the Florida PIRG Education
Fund study may not be very accurate.
2.5 Review of "Bottle Bills and Municipal Recycling: A
Preliminary Cost Analysis" by the Tellus Institute
A study called "Bottle Bills and Municipal Recycling: A
Preliminary Cost Analysis" was preformed by Frank Ackerman and
Todd Schatzki of the Tellus Institute for the U.S.
Environmental Protection Agency. This study was revised on
May 2, 1990. It compares the social costs and the municipal
costs of four systems of solid waste management which are
presented below.
2.5.1 Structure and Assumptions
This study looked at a generic community of 500,000
They used four scenarios based on the Tellus Institute Waste
Plan model. The four scenarios are listed below:^*
1) No recycling of any kind is conducted. All waste goes
to the landfill.
2) A BCDL, which diverts 85% of beer and soft drink
containers from the landfill, is in place. All other
waste goes to the landfill.
3) A curbside recycling program is in place which recycles
newspaper, glass, aluminum, and plastic containers.
These materials are then sent to a Municipal Recovery
Facility (MRF). The diversion rate of the curbside
program is 42-56%.
4) When both the BCDL and the curbside program are in
place. The BCDL diverts 85% of beer and soft drink
containers. The curbside recycling program divert 85%
of the remaining waste. The rest of the waste is
diverted to the landfill.
The Tellus model then compared the total social costs of
the four scenarios and the total municipal costs of the four
scenarios. They did this by graphing the total solid waste
system costs against landfill tipping fees. They felt that
"the higher the tipping fee, the more attractive any given
recycling option becomes^^". The social costs included the
BCDL cost per ton based on the value of $278 per ton for New
York in the Franklin Associates, LTD. model. The municipal
^^Frank Ackerman and Todd Schatzki. Bottle Bills and
Municipal Recycling; A Preliminary Cost Analysis (Boston:
costs do not use this figure and represent the cost to the
solid waste authority. These costs were graphed against
tipping fees which represented landfill avoidance costs.
2.5.2 Findings of the Tellus Institute
The Tellus Institute found that as tipping fees increase
recycling options became more cost-effective. The slopes of
these graphs represent the change in solid waste system cost per dollar of tipping fee, in other words the tonnage landfilled (Tellus, 1990). Figure 2.1 shows the results of the social cost versus the landfill tipping fees. The two
scenarios containing BCDL are higher in costs. At $0 tipping
fee, recycling options are more expensive than no recycling. This changes at $24 for a curbside program and at $48 for a
dual program. On the social graph, if the graph were
continued, the BCDL would become most attractive at $260. Theformula they used to calculate this is
Net BCDL system cost = avoided garbage collection costs +
avoided tipping fees.^
This formula was rearranged to determine:
Tipping fee required = bottle bill system cost
-for bottle bill break-even avoided garbage costs.
This cost of $260 was calculated using the value of $278
from the Franklin study. The value $18 was used for avoided
collection costs. This value may seem small but collection
costs are based mostly on the number of stops and they do not
decrease significantly due to a reduction in volume.
Figure 2.1 Social Cost Comparisons With and Without a Bottle
Bill
Total Cost (Millions)
0 10 20 30 40 50 60 70 80 90 100
Tip Fee ($/Ton)
--- W/ BCDL. No Curbslde-4- W/ BCDL, W/ Curbside
-*- No BCDL, W/ Curbslde-s- Nothing
ͣ
44
The municipal cost graph is shown in figure 2.2. If we
look at the Municipal Graph, a BCDL with no curbside is most
cost effective at tipping fees of less than approximately $42.
From approximately $42-$52 the three scenarios (a dual system,
a BCDL only, and curbside only) are indistinguishable, but
clearly better than no BCDL and no curbside. At greater than
a $52 tipping fee, a dual system is most cost-effective. The
final conclusion of this report is that "under our
assumptions, a bottle bill is not cost-effective if viewed as
purely a solid waste management option for a large community
(Tellus 1990)." However they go on to state that other
issues associated with cost-effectiveness such as the cost of
litter prevention have to be considered. For New York the
increased cost of the BCDL could be broken down into a litter
prevention cost of $6.00 a person.^' They also suggest that
further study is needed to determine if more or less material
is diverted from landfilling and incineration due to the
effects of a BCDL on curbside recycling.
2.5.3 Analysis of the Tellus Institute
The most disputed part of this report is the use of the
value $278 per ton as the net cost of the beverage container
deposit system. This was the value used by the Franklin
Associates, LTD. for the system in New York. When the Tellus
Institute uses the value shown in the Franklin Associates,
LTD.Report for Vermont ($168 per ton) the tipping fee is
reduced to $150. Although this is high it represents a
reduction in cost of about 40% overall.
These values as determined by the Franklin Associates,
LTD. were based on the costs to the wholesalers and
Figure 2.2 Municipal Cost Comparisons With and Without a
Bottle Bill