All Over the Map
All Over the Map
A 10-Year Review of State Outbreak Reporting
All Over
the Map
Acknowledgments
All Over the Map: A 10-Year Review of State Outbreak Reporting was researched and written by
Caroline Smith DeWaal, Sarah A. Klein, Caitlin Catella, Cindy Roberts, and Xuman Amanda
Tian. We gratefully acknowledge the assistance of Michael F. Jacobson, Jaclyn Witmer, Sharon
Cannistra, and Patrick O’Leary for this project. We also thank the officials working in health
departments across the United States, who provided inspiration for this report.
Copyright © 2011 by Center for Science in the Public Interest
Report designed by Cheryl Halterman, Heinauer Design
Front cover images of bacteria copyright, Dennis Kunkel Microscopy, Inc.
First Printing January 2011
Printing: 5 4 3 2 1
The Center for Science in the Public Interest (CSPI), founded in 1971, is a non-profit
health-advocacy organization that conducts education, research, and health-advocacy programs in nutrition
and food safety. CSPI is supported by its 850,000 members in the United States and Canada
and by foundation grants.
Center for Science in the Public Interest
1220 L Street, NW, Suite 300 • Washington, DC 20005
Tel: 202-332-9110 • Fax: 202-265-4954
Email: [email protected] • www.cspinet.org
All Over
the Map
Contents
Executive Summary...i
Introduction...1
State Outbreak Reporting ...2
Analyzing Individual State Outbreak Reporting ...4
Outbreak Reporting: The Process ...5
Overall Findings from 10 Years of Outbreaks ...8
Methodology...10
Uses & Limitations of the Study ...10
Conclusion & Recommendations ...11
State Profiles ... 15 - 65
Endnotes ...66
Figures
Figure 1. Foodborne Illness Outbreaks Reported to CDC ...2
Table 1. Ranking States on Reported Outbreaks per Million
Population (1998-2007) ...3
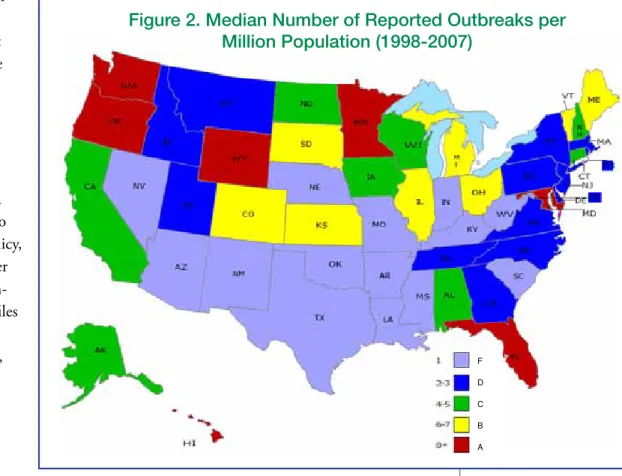
Figure 2. Median Number of Reported Outbreaks
per Million Population (1998-2007) ...3
Figure 3. Avenues for Reporting Foodborne Illnesses ...6
Figure 4. Foods Linked to Solved Outbreaks (1998-2007) ...8
Figure 5. Pathogens Implicated in Foodborne
Illness Outbreaks (1998-2007) ...8
i
Executive Summary
Preventing foodborne illness is a multi-tiered effort from the farm to the table,
involving food producers and handlers, scientists, government officials, advocates and
consumers. Vital to this effort are local and state public health officials, who track,
investigate, and report foodborne illness outbreaks to the Centers for Disease Control
and Prevention (CDC). Importantly, it is the compilation of outbreak data that helps
to quantify the problem of foodborne illness in America—and helps with the design
and implementation of strategies to minimize it. Despite the critical importance of
outbreak detection and reporting to this effort, great variability exists among the states
on outbreak surveillance and reporting.
FINDINGS
Using 10 years of outbreak data collected from CDC, the Center for Science in the
Public Interest (CSPI) analyzed states’ reporting of outbreaks and created a profile of
performance for each state. While differences in structure and resources make it difficult
to compare states, the profiles offer a 10-year retrospective on each state, and reveal key
issues for consideration by public health officials.
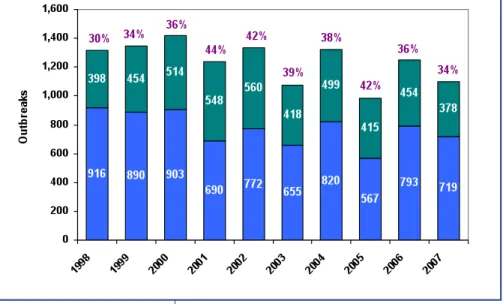
• The percentage of solved outbreaks—those with both an indentified food
and identified pathogen—has declined over the 10-period, from a high of 44
percent in 2001 to 34 percent in 2007.
• In some years, nearly 70 percent of outbreaks are not solved, meaning that at
least one essential data point (food or pathogen) is missing.
• We have given states A to F letter grades based on the number of reported
food-related outbreaks per million residents. States with the most outbreaks
received an A. While it may seem counter-intuitive to give the best grade
to states with the most outbreaks, those states are the most likely to have
robust detection and reporting systems, not the most actual outbreaks. (Note
that most of the states receiving an F are southern states with climates most
conducive to pathogen growth.)
F
Seven states received an A: Florida, Hawaii, Maryland, Minnesota, Oregon,
Washington, and Wyoming.
F
Fourteen states received an F: Arizona, Arkansas, Indiana, Kentucky,
Louisiana, Mississippi, Missouri, Nebraska, Nevada, New Mexico,
Oklahoma, South Carolina, Texas, and West Virginia.
These findings suggest that many states lack adequate funding for public health services,
leading to health departments that are overburdened and understaffed. The result is
decreased outbreak investigation and detection and an incomplete picture of foodborne
illness across the country. This paucity of information impedes efforts to prevent
foodborne illnesses.
All Over
the Map
RECOMMENDATIONS
Many players can be involved in detecting and reporting outbreaks. CSPI recommends
the following actions:
• Consumers should notify their local health department when they suspect they
have been sickened by food and should seek medical treatment whenever needed.
• Physicians should report suspected cases of foodborne illness to local health
departments and be more assertive about pursuing laboratory testing to detect
and confirm these illnesses.
• Physicians, labs, and health departments should work together to improve the
mechanisms of reporting and the timeliness of investigations so that outbreaks
can be solved and contained efficiently.
• State legislators and governing officials should give local, county and state health
departments adequate support for their investigatory and epidemiological staff.
• Federal officials should provide increased guidance and assistance to states to
improve local investigation and reporting. Federal agencies should coordinate
activities so that they are not adding to states’ burdens by shifting federal activities
onto state and local public health departments.
Most importantly, state legislators should consider the public health and economic
toll of foodborne illness when making budget decisions, and should ensure that health
departments are properly funded to carry out their critical public health mandates.
In addition to funding, states should recognize the critical importance of outbreak
investigation and reporting, as well as the other important activities that can prevent
outbreaks also conducted by these officials (for example, inspections of restaurants,
nursing homes, hospitals and day care facilities).
ii
All Over
the Map
Introduction
When it comes to food safety, state and local public health departments—and the people
who staff them—are vital to protecting the public. They serve as the frontline detectives
in investigating foodborne disease outbreaks. As this report documents, however, the
quality of reporting from the states to the Centers for Disease Control and Prevention
(CDC) varies greatly, whether looking at a single-year snapshot or a multi-year review.
An outbreak occurs when two or more people (called “cases”) get sick from a common
food source. Outbreaks are identified from multiple clusters or cases of illness, and
are often linked together by specific foodborne pathogens. The process of identifying
outbreaks has changed dramatically with the advent of modern tools like PulseNet—
the surveillance system of foodborne bacteria DNA monitored by CDC—that help
investigators link illnesses and clusters that occur in different states. But the hard work
of outbreak investigations is still conducted largely at the local and county level, where
public health officials—often with a number of additional job responsibilities—are
tasked with interviewing individuals who became ill and identifying through those
interviews the common food source. The job is not unlike a game of Clue, where
investigators narrow down the food source through a process of elimination. In a
multi-state outbreak, this investigative process occurs in different communities by
different teams of investigators, and their findings are shared and peer-reviewed to reach
agreement on the common food source.
Outbreak investigations are vital to identifying contaminated food and removing it
from the market. A prompt investigation can result in faster recalls and prevent many
people from becoming ill. This on-the-spot information is invaluable from a public
health standpoint. Equally important, however, the information feeds into systems of
preventive controls— “HACCP” systems—in use throughout the food industry. These
systems begin with a hazard analysis that employs data from outbreaks to help identify
key hazards linked to specific foods, leading to the development of facility-specific
control plans to manage those hazards.
For over a decade, the Center for Science in the Public Interest (CSPI) has compiled
outbreaks reported to CDC with both an identified food and identified pathogen into
its own Outbreak Alert! Database. The resulting database contains only the portion of
outbreaks with complete data (hereinafter referred to as “solved” outbreaks). CSPI’s
Outbreak Alert! report reviews this data annually, and provides insights into both the
most recent data and an overview of foodborne illness outbreak trends.
During the decade from 1998-2007, the majority of outbreaks (sometimes as much as
70 percent) reported to CDC had no known pathogen or food vehicle (Figure 1), and
could not be included in the Outbreak Alert! Database. Starting in 1998, the number
of solved outbreak investigations increased for several years and reached a high of 44
All Over
the Map
percent in 2001, but since then the number of outbreak reports that met CSPI’s criteria
diminished. That percentage declined to 34 percent in 2007, the lowest percentage of
solved outbreaks in any year since 1999. As the percentages of solved foodborne illness
outbreaks decline, experts, government regulators, and the food industry have less
information they can use to help make improvements.
State Outbreak
Reporting
CSPI analyzed states’ reporting of
outbreaks to CDC from 1998 to 2007.
Figure 2 depicts states’ performance
(adjusted for population) and indicates
major variability among the states.
Oregon and Minnesota,
well-recognized as having strong programs
for surveillance, investigation, and
reporting of foodborne outbreaks,
reported nine and eight outbreaks per
million people per year, respectively.
Those states are known for having
excellent laboratory facilities and strong
public health departments that quickly
interview individuals who are suspect
outbreak cases. Five states—Florida, Hawaii, Maryland, Washington, and Wyoming—
with a range of nine to 24, had as good as or even better reporting records over the
ten-year period.
On the other end of the spectrum, 14 states reported just one outbreak of foodborne
illness per million people. Fifteen states had reporting rates almost as low, reporting only
two to three outbreaks per million people. Many states reporting the lowest numbers
of outbreaks are in the southern area of the country where warmer temperatures alone
could lead to increased risk of foodborne illness and outbreaks. Several states with shared
borders—such as Florida and Georgia, Maryland and West Virginia, and Wyoming
and Nebraska—showed surprisingly wide fluctuations in outbreak reporting, despite
similarities of climate and population. These findings lead to the conclusion that fewer
outbreak reports do not necessarily indicate a lower prevalence of outbreaks. Thus,
though it may seem counter-intuitive, CSPI gave states with the highest number of
reported outbreaks the best grade. And the worst grade goes to states that report only one
outbreak per million population. Only these states can explain whether this reflects the
actual incidence of foodborne illness in their state, or inadequate resources and focus on
investigations and reporting. The individual state profiles in this report should assist with
that analysis.
2
All Over
the Map
Using 10 years of data—from CDC’s new outbreak reporting system, together with
CSPI’s Outbreak Alert! Database—this report illustrates the history of foodborne illness
outbreaks, investigations, and reporting in each state.
Studying both overall
reporting and solved
outbreaks, the report
shows how each state
has performed in
reporting outbreaks
to CDC since 1998.
Though individual
state profiles cannot
be directly compared
to one another due to
funding, staffing, policy,
population, and other
variables over the
ten-year period, the profiles
create an individual
portrait of each state,
and can serve as a
baseline for progress
moving forward on
food safety.
F D C B AFigure 2. Median Number of Reported Outbreaks per
Million Population (1998-2007)
All Over
the Map
3
‘A’ and
Benchmark States (8+ outbreaks per million)
Benchmark: Minnesota (8 outbreaks per million), Oregon (9 outbreaks per million)
‘A’ States: Florida, Hawaii, Maryland, Minnesota, Oregon, Washington, and Wyoming
‘B’ States (6-7 outbreaks per million)
Colorado, Illinois, Kansas, Maine, Michigan, Ohio, and Vermont ‘C’ States
(4-5 outbreaks per million)
Alabama, Alaska, California, Connecticut, Iowa, New Hampshire, North Dakota, and Wisconsin
‘D’ States (2-3 outbreaks per million)
Delaware, District of Columbia, Georgia, Idaho, Massachusetts, Montana, New Jersey, New York, North Carolina, Pennsylvania, Rhode Island, South Dakota, Tennessee, Utah, and Virginia
‘F’ States (1 outbreak per million)
Arizona, Arkansas, Indiana, Kentucky, Louisiana, Mississippi, Missouri, Nebraska, Nevada, New Mexico, Oklahoma, South Carolina, Texas, and West Virginia
Table 1. Ranking States on Reported Outbreaks per Million
Population (1998-2007)
Analyzing Individual State Outbreak Reporting
Over the last 10 years, state food-related outbreak reports to CDC have experienced
dramatic fluctuations. Reports for a single year ranged from 1,400 annually to fewer
than 1,000, with occasional year-to-year variations of more than 25 percent. There was
also a troubling decline in the quality of state investigations reported to CDC. Overall,
states reported 33 percent fewer solved outbreaks to CDC in 2007 than in 2002.
When states are compared, there are huge variations in reporting. As state budgets and
staffing vary substantially, as does climate and geography, this report can describe the
findings, but cannot determine why such variations in reporting exist.
To examine state performance, CSPI uses both the overall state reporting as reflected
in CDC’s larger data set broken out by state, and CSPI’s Outbreak Alert! Database that
contains only the solved outbreaks reported to CDC.
For this survey of the states, CSPI developed an individual profile for each state to
examine these indicators:
1) Ten-year overview of reporting trends. The box listing overall reporting trends
contains information on the number of outbreaks reported to CDC from
each state between 1998 and 2007, the number of the total that represents
solved outbreaks, and the solved outbreaks that affected only residents of the
state.
2) The companion chart shows three trend lines representing: total reported
outbreaks in the specific state (blue); the trend of solved outbreaks in the
specific state including multi-state outbreaks (red); and the trend of solved
outbreaks in the specific state excluding multi-state outbreaks (yellow).
13) Data describing the total number of illnesses, hospitalizations, and deaths for
each state were extracted from the September 17, 2009, CDC Foodborne
Outbreak Online Database with multi-state outbreaks excluded (see the box
at the bottom of each state profile).
Using only the solved outbreaks in the specific state (depicted in the chart in yellow),
CSPI analyzed two additional criteria:
4) Pathogens most frequently reported from outbreaks occurring in the state,
whether confirmed or suspected (excludes multi-state outbreaks). Pathogens
linked to only one outbreak were grouped together in the category “Other.”
Pathogens were assigned individuals colors in the ‘Pathogens Implicated in
4
All Over
the Map
1 Note that the Y-axis varies from state to state in the ‘Outbreak Size’ and ‘Trends in Reported & Solved Outbreaks’ charts. That is due to
the widely varying numbers of reported outbreaks among states. Readers should take special care when viewing the trend lines of several states because of variations in the Y-axis.
Outbreaks’ chart to create uniformity and ease of understanding, though the
format differs (pie chart, bar chart or table) depending on the amount and
complexity of the data available.
5) Outbreak sizes for solved outbreaks from each state (excluding multi-state
outbreaks). Solved outbreaks were grouped together into six categories (2-10,
11-25, 26-50, 51-100, 101-200, and 201+).
Outbreak Reporting: The Process
State and local health departments play a critical role in the investigation of foodborne
illness and the reporting of outbreaks to the federal government, but they are certainly
not the only participant in this complex reporting regime. Whether outbreaks are
identified and reported—or escape detection
entirely—depends on the actions of
consumers, the medical community, and state
officials.
There are two basic routes through which
outbreaks are identified. According to a
recent study of Minnesota, the most common
source of reported outbreaks was through
consumer complaints directly to the health
department. Depending on that health
department’s ability to get investigators into
the field, such complaints may represent the
most efficient and rapid path to outbreak
detection. In Minnesota, for example, this type of consumer-complaint-driven
investigation results in almost 80 percent of outbreak detection (Li et al., 2010).
The second route is laboratory-based, which starts if a consumer seeks traditional medical
care; even then, many variables come into play. A consumer may or may not seek
medical treatment for illness, depending on the severity of illness or access to medical
care. When treatment is sought, a physician may or may not order appropriate lab tests
and even if ordered, positive results may or may not be forwarded to a public health
agency. Forwarding is less likely if the detected pathogen is not one of the reportable
pathogens as defined by the state.
2All Over
the Map
5
Consumer Reporting of Foodborne Illnesses
In a CDC study of the general public’s beliefs about sources
of gastrointestinal illness, 22 percent of respondents who had
experienced vomiting or diarrhea in the previous month
believed their recent gastrointestinal illness resulted from a
specific meal eaten outside the home (Green et al., 2005). The
infrequency with which the public suspects foodborne illness—
as opposed to a “stomach virus” or other type of illness—
hampers the ability of health departments to identify and
investigate foodborne illness outbreaks.
2 CDC and the Council of State and Territorial Epidemiologists (CSTE) publish a list of Nationally Notifiable Infectious Conditions,
those illnesses thought to be critical enough to public health to warrant notice to federal public health authorities. However, reporting of nationally notifiable diseases to CDC by the states is voluntary. Reporting is currently mandated (i.e., by state legislation or regulation) only at the state level. The list of diseases that are considered notifiable, therefore, varies slightly by state. These generally include Salmonella species (spp.), shiga-toxin producing E. coli, Shigella, Listeria monocytogenes, Clyclospora, Vibrio spp., and Clostridium botulinum.
Identifying the pathogen, however, is just one step to solving the outbreak.
Investigators must still identify the food that is the cause of the outbreak. This
takes field investigation to interview suspect cases and gather and analyze suspect
foods. Often though, there is a “lag-time” between onset of illness and notification
to the health department of between two days (if a consumer reports directly to the
health department) and 19 days (the median time if reports are received through the
laboratory-based route) (Li et al., 2010). During this time, consumers’ memories of
what they ate falters; food is consumed or discarded; and additional persons may become
ill from the same source.
Regardless of how the illness reaches the notice of the health department, that
agency may or may not be funded or staffed to perform analysis or provide essential
epidemiologic support to the investigating epidemiologists, resulting in a stunted
investigation. Even a culture-confirmed case may or may not be investigated to
determine the food vehicle or exposure data. A state may or may not report the outbreak
to CDC. Other foodborne illnesses may appear sporadic as only one or two people
become ill in each state.
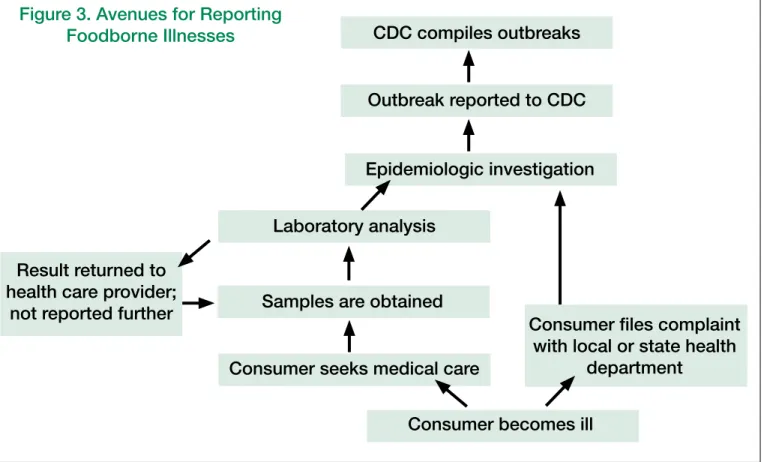
The following diagram (Figure 3) illustrates how foodborne illnesses may—or may
not—eventually be reported to CDC as an outbreak.
6
All Over
the Map
Figure 3. Avenues for Reporting
Foodborne Illnesses
CDC compiles outbreaks
Outbreak reported to CDC
Epidemiologic investigation
Consumer files complaint
with local or state health
department
Laboratory analysis
Samples are obtained
Consumer seeks medical care
Consumer becomes ill
Result returned to
health care provider;
not reported further
All Over
the Map
7
Public Health Funding Crisis May Explain Absence of
Outbreaks
At least two major studies have recently examined the ongoing budget crisis affecting
state and local health departments. While neither study provides a definitive link
between the variations in reporting practices and budget changes/constraints, both
provide compelling evidence that health department budgets are in crisis.
A 2010 report from the National Association of County & City Health Officials
(NACCHO) found that budget cuts to local health departments resulted in deep job
losses and the reduction or elimination of essential public health services. The survey,
designed to measure the impact of the current economic recession on local health
departments, found that 63 percent of Americans live in counties with local health
departments that “cut” or “significantly cut” services in 2009 (Blum et al., 2010).
These budget cuts can cripple preventive health programs and force health departments
into a weakened, reactive stance. “Some cuts weaken essential programs that
shield entire communities from disease. For example, nine percent of [local health
departments] have cut food safety programs. One official states, ‘Everyone who dines
in a restaurant within our district could be potentially impacted if the restaurant
inspections and complaints are not followed up in a timely manner. This could lead to
[an increase] in foodborne outbreaks’” (Blum et al., 2010).
A March 2010 report from the Trust for America’s Health (TFAH) and the Robert
Wood Johnson Foundation found that states around the country have cut $392
million for public health programs in the past year. States are expected to cut budgets
even more in the coming year, which will leave communities struggling to deliver basic
public health services for chronic and infectious disease prevention, food and water
safety, emergency preparedness and environmental health improvements (TFAH,
2010). Notably, the majority of funding for public health comes from state and local
levels rather than federal spending.
However, CSPI was unable to identify any information on how much each state
spends on food safety.
Overall Findings from 10 Years of Outbreaks
An analysis of outbreaks over a 10-year period shows several important trends among
the states, and can provide a useful picture of foodborne illness outbreak reporting
nationwide. The individual state profiles that follow provide a more comprehensive
portrait of an individual state in
the decade analyzed.
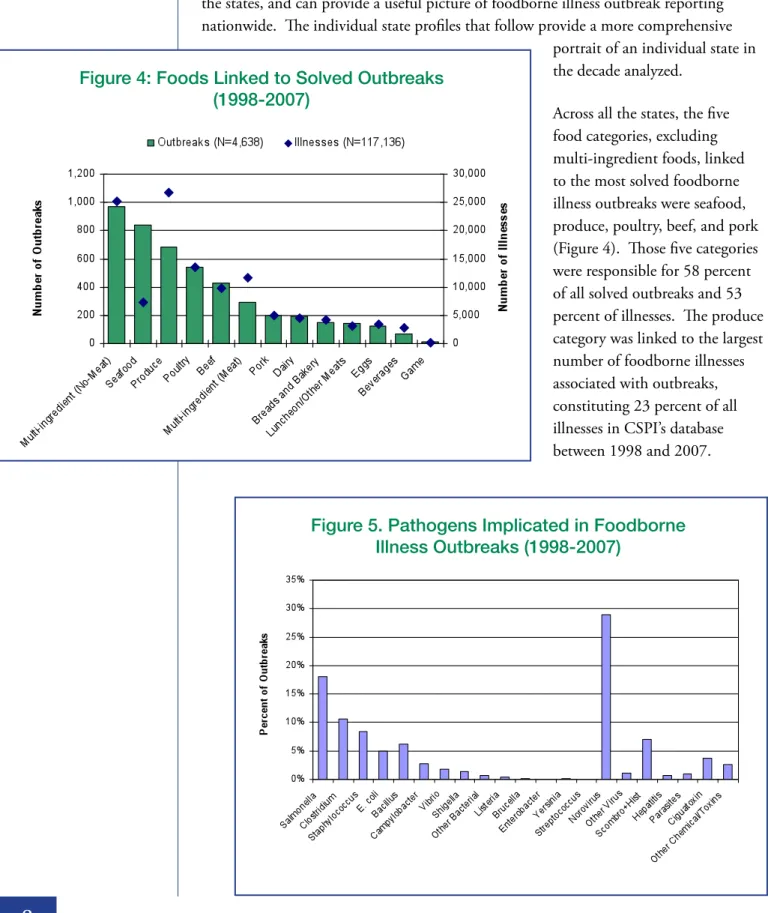
Across all the states, the five
food categories, excluding
multi-ingredient foods, linked
to the most solved foodborne
illness outbreaks were seafood,
produce, poultry, beef, and pork
(Figure 4). Those five categories
were responsible for 58 percent
of all solved outbreaks and 53
percent of illnesses. The produce
category was linked to the largest
number of foodborne illnesses
associated with outbreaks,
constituting 23 percent of all
illnesses in CSPI’s database
between 1998 and 2007.
8
All Over
the Map
Figure 4: Foods Linked to Solved Outbreaks
(1998-2007)
Figure 5. Pathogens Implicated in Foodborne
Illness Outbreaks (1998-2007)
Bacterial pathogens were responsible for 56 percent of all solved outbreaks, while viruses
caused 30 percent, chemicals/toxins caused 13 percent, and parasites caused one percent
(Figure 5).
The most frequently identified and reported bacterial pathogens were Salmonella spp.,
which accounted for 18 percent of all outbreaks, Clostridium spp. (11 percent), and
Staphylococcus spp. (eight percent). Bacillus spp. caused six percent, E. coli spp. caused
five percent, and Campylobacter spp. caused three percent of all outbreaks, respectively.
Norovirus, which is rarely fatal, caused 94 percent of all viral outbreaks, accounting for
29 percent of all outbreaks.
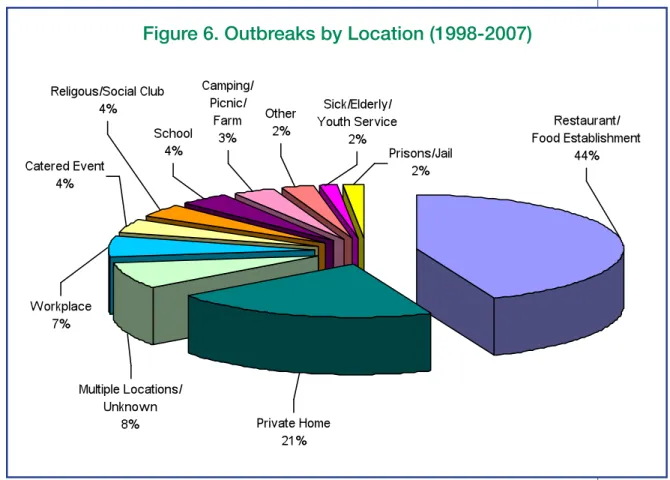
Restaurants and other food establishments were the most common location for solved
outbreaks to occur (44 percent of outbreaks), followed by private homes (21 percent),
multiple locations/unknown (eight percent) and workplaces (seven percent) (Figure 6).
Restaurants have been identified as a major cause of outbreaks for a number of reasons;
the quantity of food served and the variety of preparation methods—as well as the
number of people involved in that preparation—provides ample opportunity for
contamination.
All Over
the Map
9
Methodology
Outbreak data were collected from CDC’s searchable Foodborne Outbreak Online
Database that became available online in September 2009 and is designed to give the
public direct access to information on foodborne illness outbreaks reported to CDC
from 1998 to 2007. Most outbreaks are reported to the National Outbreak Reporting
System (NORS) by the state, local, territorial, or tribal health department that
conducted the outbreak investigation. Multi-state outbreaks are generally reported to
NORS by CDC. Outbreak reporting to CDC is voluntary.
The Foodborne Outbreak Online Database includes both single-state and multi-state
outbreaks. It is important to note that an outbreak affecting residents of more than
one state due to exposures in a single state is considered to be a single-state outbreak.
A search for outbreaks for a specific state in CDC’s database will return all single-state
outbreaks reported by that state and all multi-state outbreaks involving that state.
NORS staff are currently validating and correcting past multi-state outbreak reports.
Therefore, the state assignment of outbreaks is subject to change.
The CDC database was searched by state name (all 50 states and the District of
Columbia). The data files were imported to Microsoft Office Excel for analysis.
The reported number of outbreaks per million population for each state was calculated
by dividing the median of the number of total outbreaks reported to CDC, both solved
and unsolved, over the ten-year period by the average population in millions from
2000-2007 (data for 1998 and 1999 were not available electronically), as determined by the
U.S. Census Annual Population Estimates. The median, rather than mean, was used to
calculate reported outbreaks over the ten-year period because the median is less affected
by outliers and is a better measure of central tendency for small sample sizes.
Solved outbreaks include only outbreaks for which both the food vehicle and pathogen
were identified. Outbreaks with a vehicle listed as “multiple food,” “other food,” or
“unknown food,” or for which no pathogen was reported, were excluded from the total
number of solved outbreaks. The total number of reported outbreaks includes both
solved and unsolved outbreaks. Outbreaks with a vehicle listed as “water,” “tap water,”
or “ice” were excluded from analysis.
Uses and Limitations of the Study
This study is intended to provide each state and the District of Columbia with an
individual portrait of its own reporting history to be used as a baseline for future
improvement. CSPI encourages states to study their own data, and, where possible,
to improve reporting, investigations, and policies. It is our hope that these data will
serve as a historical benchmark of the previous decade in reporting and would be used
10
All Over
the Map
to encourage state policymakers to properly fund these critical public health services.
CSPI recognizes the dedication and service provided by the public health agencies, and
considers the lack of funding for health department programs and staffing to be a serious
problem—one that is likely to have significant and lasting public health consequences.
State profiles should not be used to directly compare the 10-year reporting performances
between individual states. However, national trends and some state observations are
possible, as discussed in the State Outbreak Reporting section of this report. States
should use their own encapsulated data set to evaluate management strategies that could
affect outbreak reporting, both positively and negatively. Only individual state public
health departments will know, for example, whether years with a higher percentage of
solved outbreaks were the result of improved outbreak investigations or the consequence
of fewer outbreak reports. Similarly, a dearth of reported outbreaks may indicate a
particularly good year for food safety in the state—or a severely hampered or inept
reporting system.
Conclusion and Recommendations
At its core, the current system of outbreak identification and reporting in the United
States is a house of cards. At each step in this inherently passive process, a single
moment of inaction—a single missed opportunity to follow up—can result in an
aborted investigation and another outbreak uncounted. A consumer’s initial failure
to file a complaint with the public health department or to seek medical attention
might mean that an outbreak is never identified. A physician’s decision not to obtain a
laboratory analysis might mean that a pathogen is not confirmed and no action is taken
to protect the public from a larger outbreak. A budgetary cutback in the state capitol
eliminating an investigator’s job in a county health department might mean that there
is no follow-up investigation. It is likely that in most states, outbreak reporting greatly
underestimates the problem of foodborne illness. Minimizing the public health impact
of outbreaks requires action by many players, from consumers to state appropriators;
each step in the process is an important opportunity to protect the public health.
States investigating and reporting higher incidents of foodborne illness may be those
with robust epidemiological structures, political support for prioritizing food safety,
and more generous budget allowances, while other states may be financially strapped,
politically pressured not to report and investigate outbreaks, and structurally unable
to carry out their public health mandate. Such differences among the states result in a
varied and incomplete picture of food safety across the country.
This report’s 10-year perspective illustrates the extreme state-to-state variability that
results from a passive system of outbreak reporting. That passivity is inherently linked
to the stressors placed on some state health departments by inadequate resources.
Without the staffing and lab capabilities, the percentage of solved outbreaks remains low,
All Over
the Map
and the cycle of unknowns—the full extent of illnesses, the pathogens, the foods—is
perpetuated.
Greater program evaluation is needed to determine what systems are effective, and where
departments can improve. Opportunities for strengthening state systems exist, and
should be considered, in order to improve public health.
For Congress and the States
Improving outbreak investigation is one key to reducing the burden of foodborne
illnesses. With robust investigation and reporting systems, public health officials are
better able to identify contaminated foods before the outbreaks grow, and policymakers
are better able to develop regulations to minimize product contamination problems in
the first place.
Congress and individual state legislatures must commit to improving public health
budgetarily, as well as theoretically. Cutting budgets at health departments has
long-lasting repercussions on food safety and consumer health; these essential services must be
given top priority and fully funded.
In addition, federal and state governments should proceed cautiously with proposals to
shift additional responsibility for inspecting FDA-regulated facilities from the federal
agency to the states. Putting a greater burden on states to perform these
federally-mandated inspections might make it even more challenging for states to perform their
traditional and essential public health functions, such as outbreak investigations and
food safety inspections of restaurants, retailers, nursing homes, hospitals, and day care
centers. These programs should not be sacrificed to increase the states’ role in federal
inspections.
For Centers for Disease Control and Prevention
CDC should consider working with the states to develop a curriculum for model
investigation and epidemiologic practices to streamline the collection of data through
local and state health departments. The collection of compatible data using a consistent
methodology across the country could facilitate data analysis and aid in assessing risks
from new and emerging pathogens and food sources.
CDC should consider, where practicable, funding state epidemiological training
programs to maintain high levels of proficiency among epidemiologists. This training
should encourage state epidemiology programs to test for new and emerging pathogens,
such as non-O157 Shiga toxin producing E. coli and antibiotic-resistant strains of
Salmonella. CDC should also consider awarding capacity-building grants to those states
most in need of improved laboratory infrastructure.
12
All Over
the Map
Finally, CDC should consider taking steps to make outbreak reporting to the National
Notifiable Diseases Surveillance System mandatory. States are not currently required to
report to CDC any of the foodborne illnesses listed therein.
For Local and State Health Departments
Despite their very real limitations related to budget and staffing, most health
departments could improve their systems. Each state should review the data presented
here and use it to assess
its own unique situation.
Understanding the causes
of low reporting could assist
states in developing plans to
improve reporting systems in
the future.
In collaboration with CDC,
health departments should
also seriously consider
utilizing a streamlined
investigatory protocol.
While local departments
may be reticent to give up
their independence (and
recent outbreaks like peanut
butter highlight the need for
creativity), being part of a
system for collecting similar data across jurisdictions could help identify more outbreaks
and may help prevent additional illnesses.
In addition, health departments should consider hiring or offering academic-credit
internships to public health students to provide more “boots on the ground” aid to
epidemiologists in collecting exposure information from victims. Such interviews and
investigations provide critical clues to solving outbreaks and identifying the food source,
which could result in smaller outbreaks.
Health departments should ensure that they are using currently available outbreak
detection technology, such as PulseNet, to the greatest extent practicable. This type of
technology can be useful in connecting-the-dots of multi-state outbreaks, and can assist
with clarifying the impact of disease across state lines.
Health departments should take a critical look at reporting policies throughout their
jurisdictions: from physicians and labs to the local level; from local departments to the
state; and from the state to CDC. The failure to report unsolved outbreaks, for example,
All Over
the Map
13
Collaboration between CDC and the States
Positive models exist for collaboration among those responsible for tracking
foodborne illness. For example, the Council to Improve Foodborne Outbreak
Response (CIFOR), a multidisciplinary working group of local, state and
federal partners, was convened to improve methods of foodborne outbreak
detection and response. To this end, CIFOR has developed its Guidelines for
Foodborne Disease Outbreak Response, a consensus document that describes
the detection, investigation, control, and follow-up of outbreaks. Taking into
account the varying circumstances related to outbreaks and to agencies involved
and available resources, CIFOR developed the Guidelines to be used as a
reference document for comparison with existing procedures, filling in gaps and
updating agency-specific procedures, creating new procedures where they do not
exist, and training program staff. Additional opportunities for collaboration
and information-sharing should be considered where possible.
results in a severe lack of state data and may hamper further analysis of the status of
foodborne illness across the country.
For Physicians and Medical Associations
Physician membership organizations should increase education and training for
foodborne illness detection and treatment. Medical school curriculums do not always
reflect the critical public health issues related to foodborne illnesses, and physicians may
not be properly trained to identify them.
Physicians and their membership organizations should commit to increased
responsiveness to patients’ complaints of possible foodborne illnesses. When practicable,
physicians should order appropriate laboratory analyses to confirm foodborne illnesses,
and should ensure proper and prompt reporting of both consumer complaints and
laboratory results linked to such illnesses to the relevant public health authority.
For Consumers
As the first step on the ladder to identifying and arresting foodborne illness outbreaks,
consumers can help ensure that their illnesses are counted. Consumers should report
suspected foodborne illnesses to local public health authorities. When they seek
medical care for gastrointestinal illnesses, consumers can proactively request laboratory
tests to clarify the cause. In addition, consumers should notify local and state health
departments directly.
Ultimately, making serious strides in preventing foodborne illness requires the
commitment of all the relevant players: consumers, physicians, state and local health
departments, federal food safety agencies and Congress and state legislatures. The public
health cost of continuing as we are, with state reporting literally all over the map, is
simply too high.
14
All Over
the Map
15
Overall Reporting Trends
Trends in Reported & Solved Outbreaks
~The following analyses use only the 9 outbreaks affecting the residents of Alabama. These outbreaks best reflect the capacity and
effectiveness of the state in investigating outbreaks.~
Outbreak Size Over a ten-year period, Alabama’s state and local health
departments reported 221 outbreaks to the Centers for Disease Control and Prevention (CDC). Of the reported outbreaks, 14 were solved, including 9 outbreaks affecting only Alabama residents. “Solved” outbreaks - those where both a pathogen and a food source are identified - represent a minority of most states’ reported outbreaks. Solved outbreaks are the most valuable in terms of providing information to help prevent future illnesses. Rapid identification of the contaminated food source can enable states to quickly alert consumers and implement a food recall, thereby decreasing the public health impact.
Pathogen Number of Outbreaks
Salmonella 3
Norovirus 1
Clostridium 1
Bacillus 1
Other Chemicals/Toxins 1
Staphylococcus 1
E. coli 1
The most common pathogen implicated for food-related outbreaks in Alabama was Salmonella, 3 outbreaks (33%).
In 2007, Alabama reported 8 outbreaks to the CDC, or only 2 reported outbreaks per 1 million population. That year represents a low reporting year. During the peak reporting years of 1999 (53), 2000 (43) and 2002 (48), Alabama reported more than five times that number of outbreaks. The median number of reported outbreaks was 4 per 1 million population over the ten-year period.§
§
See the US map in Figure 2
Fifty-six percent of Alabama’s outbreaks affected between 26 and 50 people. Outbreak size might indicate the emphasis a state places on investigating smaller outbreaks, which can affect the speed with which a state identifies contaminated food and removes it from commerce, or it might indicate a more limited food source.
Outbreak Reporting from the States:
Foodborne-Illness Outbreaks from 1998 to 2007
Alabama (AL)
221
Reported Outbreaks to CDC
14
Solved Outbreaks
9
Solved Outbreaks Affecting Only AL*
* Excludes multi-state outbreaks
Pathogens Implicated in Outbreaks
16
Overall Reporting Trends
Trends in Reported & Solved Outbreaks
~The following analyses use only the 28 outbreaks affecting the residents of Alaska. These outbreaks best reflect the capacity and
effectiveness of the state in investigating outbreaks.~
Outbreak Size Over a ten-year period, Alaska’s state and local health
departments reported 48 outbreaks to the Centers for Disease Control and Prevention (CDC). Of the reported outbreaks, 33 were solved, including 28 outbreaks affecting only Alaska residents. “Solved” outbreaks - those where both a pathogen and a food source are identified - represent a minority of most states’ reported outbreaks. Solved outbreaks are the most valuable in terms of providing information to help prevent future illnesses. Rapid identification of the contaminated food source can enable states to quickly alert consumers and implement a food recall, thereby decreasing the public health impact.
The most common pathogen implicated for food-related outbreaks in Alaska was Clostridium, 13 outbreaks (46%), followed by Norovirus, 4 outbreaks (14%).
In 2007, Alaska reported 8 outbreaks to the CDC, or 12 reported outbreaks per 1 million population. That year represents a peak reporting year, as does 2002 (13). The median number of reported outbreaks was 5 per 1 million population over the ten-year period. §
§See the US map in Figure 2
Sixty-four percent of Alaska’s outbreaks affected between 2 and 10 people. Outbreak size might indicate the emphasis a state places on investigating smaller outbreaks, which can affect the speed with which a state identifies contaminated food and removes it from commerce, or it might indicate a more limited food source.
Outbreak Reporting from the States:
Foodborne-Illness Outbreaks from 1998 to 2007
Alaska (AK)
48
Reported Outbreaks to CDC
33
Solved Outbreaks
28
Solved Outbreaks Affecting Only AK*
* Excludes multi-state outbreaks
Pathogens Implicated in Outbreaks
17
Overall Reporting Trends
Trends in Reported & Solved Outbreaks
~The following analyses use only the 22 outbreaks affecting the residents of Arizona. These outbreaks best reflect the capacity and
effectiveness of the state in investigating outbreaks.~
Outbreak Size Over a ten-year period, Arizona’s state and local health
departments reported 106 outbreaks to the Centers for Disease Control and Prevention (CDC). Of the reported outbreaks, 40 were solved, including 22 outbreaks affecting only Arizona residents. “Solved” outbreaks - those where both a pathogen and a food source are identified - represent a minority of most states’ reported outbreaks. Solved outbreaks are the most valuable in terms of providing information to help prevent future illnesses. Rapid identification of the contaminated food source can enable states to quickly alert consumers and implement a food recall, thereby decreasing the public health impact.
The most common pathogen implicated for food-related outbreaks in Arizona was Norovirus, 6 outbreaks (27%), followed by Salmonella, 5 outbreaks (23%), and Clostridium, 4 outbreaks (18%).
In 2007, Arizona reported 31 outbreaks to the CDC, or 5 reported outbreaks per 1 million population. That year represents a peak reporting year, as does 2004 (20). The median number of reported outbreaks was 1 per 1 million population over the ten-year period.§
§See the US map in Figure 2
Eighty-one percent of Arizona’s outbreaks affected between 11 and 100 people. Outbreak size might indicate the emphasis a state places on investigating smaller outbreaks, which can affect the speed with which a state identifies contaminated food and removes it from commerce, or it might indicate a more limited food source.
Outbreak Reporting from the States:
Foodborne-Illness Outbreaks from 1998 to 2007
Arizona (AZ)
106
Reported Outbreaks to CDC
40
Solved Outbreaks
22
Solved Outbreaks Affecting Only AZ*
* Excludes multi-state outbreaks
Pathogens Implicated in Outbreaks
18
Overall Reporting Trends
Trends in Reported & Solved Outbreaks
~The following analyses use only the 18 outbreaks affecting the residents of Arkansas. These outbreaks best reflect the capacity and
effectiveness of the state in investigating outbreaks.~
Outbreak Size Over a ten-year period, Arkansas’s state and local health
departments reported 32 outbreaks to the Centers for Disease Control and Prevention (CDC). Of the reported outbreaks, 23 were solved, including 18 outbreaks affecting only Arkansas residents. “Solved” outbreaks - those where both a pathogen and a food source are identified - represent a minority of most states’ reported outbreaks. Solved outbreaks are the most valuable in terms of providing information to help prevent future illnesses. Rapid identification of the contaminated food source can enable states to quickly alert consumers and implement a food recall, thereby decreasing the public health impact.
The most common pathogen implicated for food-related outbreaks in Arkansas was Salmonella, 7 outbreaks (39%), followed by Staphylococcus, 4 outbreaks (22%).
In 2007, Arkansas reported 3 outbreaks to the CDC, or only 1 reported outbreak per 1 million population. That year represents an average reporting year. During the peak reporting year of 2002 (8), Arkansas reported almost three times that number of outbreaks. The median number of reported outbreaks was 1 per 1 million population over the ten-year period.§
§See the US map in Figure 2
Forty-four percent of Arkansas’s outbreaks affected between 2 and 10 people. Outbreak size might indicate the emphasis a state places on investigating smaller outbreaks, which can affect the speed with which a state identifies contaminated food and removes it from commerce, or it might indicate a more limited food source.
Outbreak Reporting from the States:
Foodborne-Illness Outbreaks from 1998 to 2007
Arkansas (AR)
32
Reported Outbreaks to CDC
23
Solved Outbreaks
18
Solved Outbreaks Affecting Only AR*
* Excludes multi-state outbreaks
Pathogens Implicated in Outbreaks
19
Overall Reporting Trends
Trends in Reported & Solved Outbreaks
~The following analyses use only the 719 outbreaks affecting the residents of California. These outbreaks best reflect the capacity and
effectiveness of the state in investigating outbreaks.~
Outbreak Size Over a ten-year period, California’s state and local health
departments reported 1,628 outbreaks to the Centers for Disease Control and Prevention (CDC). Of the reported outbreaks, 755 were solved, including 719 outbreaks affecting only California residents. “Solved” outbreaks - those where both a pathogen and a food source are identified - represent a minority of most states’ reported outbreaks. Solved outbreaks are the most valuable in terms of providing information to help prevent future illnesses. Rapid identification of the contaminated food source can enable states to quickly alert consumers and implement a food recall, thereby decreasing the public health impact.
The most common pathogen implicated for food-related outbreaks in California was Norovirus, 226 outbreaks (31%), followed by Salmonella and Bacillus, with 122 and 120 outbreaks (17% each).
In 2007, California reported 158 outbreaks to the CDC, or 4 reported outbreaks per 1 million population. That year represents an average reporting year. During the peak reporting years of 2002 (208) and 2006 (200), California reported 30% more outbreaks. The median number of reported outbreaks was 5 per 1 million population over the ten-year period.§
§See the US map in Figure 2
Fifty-three percent of California’s outbreaks affected between 2 and 10 people. Outbreak size might indicate the emphasis a state places on investigating smaller outbreaks, which can affect the speed with which a state identifies contaminated food and removes it from commerce, or it might indicate a more limited food source.
Outbreak Reporting from the States:
Foodborne-Illness Outbreaks from 1998 to 2007
California (CA)
1,628
Reported Outbreaks to CDC
755
Solved Outbreaks
719
Solved Outbreaks Affecting Only CA*
* Excludes multi-state outbreaks
Pathogens Implicated in Outbreaks
20
Overall Reporting Trends
Trends in Reported & Solved Outbreaks
~The following analyses use only the 150 outbreaks affecting the residents of Colorado. These outbreaks best reflect the capacity and
effectiveness of the state in investigating outbreaks.~
Outbreak Size Over a ten-year period, Colorado’s state and local health
departments reported 273 outbreaks to the Centers for Disease Control and Prevention (CDC). Of the reported outbreaks, 170 were solved, including 150 outbreaks affecting only Colorado residents. “Solved” outbreaks - those where both a pathogen and a food source are identified - represent a minority of most states’ reported outbreaks. Solved outbreaks are the most valuable in terms of providing information to help prevent future illnesses. Rapid identification of the contaminated food source can enable states to quickly alert consumers and implement a food recall, thereby decreasing the public health impact.
The most common pathogen implicated for food-related outbreaks in Colorado was Norovirus, 40 outbreaks (27%), followed by Clostridium, 34 outbreaks (23%).
In 2007, Colorado reported 37 outbreaks to the CDC, or 8 reported outbreaks per 1 million population. That year represents a peak reporting year, as does 2006 (47). The median number of reported outbreaks was 6 per 1 million population over the ten-year period.§
§See the US map in Figure 2
Fifty-three percent of Colorado’s outbreaks affected between 2 and 10 people. Outbreak size might indicate the emphasis a state places on investigating smaller outbreaks, which can affect the speed with which a state identifies contaminated food and removes it from commerce, or it might indicate a more limited food source.
Outbreak Reporting from the States:
Foodborne-Illness Outbreaks from 1998 to 2007
Colorado (CO)
273
Reported Outbreaks to CDC
170
Solved Outbreaks
150
Solved Outbreaks Affecting Only CO*
* Excludes multi-state outbreaks
Pathogens Implicated in Outbreaks
21
Overall Reporting Trends
Trends in Reported & Solved Outbreaks
~The following analyses use only the 47 outbreaks affecting the residents of Connecticut. These outbreaks best reflect the capacity and
effectiveness of the state in investigating outbreaks.~
Outbreak Size Over a ten-year period, Connecticut’s state and local health
departments reported 136 outbreaks to the Centers for Disease Control and Prevention (CDC). Of the reported outbreaks, 80 were solved, including 47 outbreaks affecting only Connecticut residents. “Solved” outbreaks - those where both a pathogen and a food source are identified - represent a minority of most states’ reported outbreaks. Solved outbreaks are the most valuable in terms of providing information to help prevent future illnesses. Rapid identification of the contaminated food source can enable states to quickly alert consumers and implement a food recall, thereby decreasing the public health impact.
The most common pathogen implicated for food-related outbreaks in Connecticut was Norovirus, 27 outbreaks (57%), followed by Salmonella, 9 outbreaks (19%).
In 2007, Connecticut reported 18 outbreaks to the CDC, or 7 reported outbreaks per 1 million population.* That year represents a peak reporting year, as does 2001 (19), 2005 (18) and 2006 (18). The median number of reported outbreaks was 4 per 1 million population over the ten-year period.§
§See the US map in Figure 2
Forty percent of Connecticut’s outbreaks affected between 2 and 10 people. Outbreak size might indicate the emphasis a state places on investigating smaller outbreaks, which can affect the speed with which a state identifies contaminated food and removes it from commerce, or it might indicate a more limited food source.
Outbreak Reporting from the States:
Foodborne-Illness Outbreaks from 1998 to 2007
Connecticut (CT)
136
Reported Outbreaks to CDC
80
Solved Outbreaks
47
Solved Outbreaks Affecting Only CT*
* Excludes multi-state outbreaks
Pathogens Implicated in Outbreaks
22
Overall Reporting Trends
Trends in Reported & Solved Outbreaks
~Analyses of the 2 outbreaks affecting only the residents of Delaware were not completed due to the small number. These
two outbreaks were linked to Salmonella and Norovirus pathogens. The outbreak sizes were 21 and 28. One outbreak occurred in a school setting and the other in a nursing home. These outbreaks best reflect the capacity and effectiveness of
the state in investigating outbreaks.~
Over a ten-year period, Delaware’s state and local health departments reported 16 outbreaks to the Centers for Disease Control and Prevention (CDC). Of the reported outbreaks, 9 were solved, including 2 outbreaks affecting only Delaware residents. “Solved” outbreaks - those where both a pathogen and a food source are identified - represent a minority of most states’ reported outbreaks. Solved outbreaks are the most valuable in terms of providing information to help prevent future illnesses. Rapid identification of the contaminated food source can enable states to quickly alert consumers and implement a food recall, thereby decreasing the public health impact.
In 2007, Delaware reported 3 outbreaks to the CDC, or 3 reported outbreaks per 1 million population. That year represents a high reporting year along with 2003 (4), 2004 (3) and 2006 (3). The median number of reported outbreaks was 2 per 1 million population over the ten-year period.§
§See the US map in Figure 2
Outbreak Reporting from the States:
Foodborne-Illness Outbreaks from 1998 to 2007
Delaware (DE)
16
Reported Outbreaks to CDC
9
Solved Outbreaks
2
Solved Outbreaks Affecting Only DE*
* Excludes multi-state outbreaks
23
Overall Reporting Trends
Trends in Reported & Solved Outbreaks
~The following analyses use only the 11 outbreaks affecting the residents of the District of Columbia. These outbreaks best reflect the
capacity and effectiveness of the state in investigating outbreaks.~
Outbreak Size Over a ten-year period, the District of Columbia’s state and
local health departments reported 30 outbreaks to the Centers for Disease Control and Prevention (CDC). Of the reported outbreaks, 12 were solved, including 11 outbreaks affecting only the District of Columbia residents. “Solved” outbreaks - those where both a pathogen and a food source are identified - represent a minority of most states’ reported outbreaks. Solved outbreaks are the most valuable in terms of providing information to help prevent future illnesses. Rapid identification of the contaminated food source can enable states to quickly alert consumers and implement a food recall, thereby decreasing the public health impact.
The most common pathogen implicated for food-related outbreaks in the District of Columbia was Norovirus, 4 outbreaks (36%), followed by Salmonella, 3 outbreaks (27%).
In 2007, the District of Columbia reported 3 outbreaks to the CDC, or 5 reported outbreaks per 1 million population. That year represents an average reporting year. During the peak reporting years of 2002 (10) and 2004 (10), the District of Columbia reported three times that number of outbreaks. The median number of reported outbreaks was 3 per 1 million population over the ten-year period.§
§See the US map in Figure 2
Thirty-six percent of the District of Columbia’s outbreaks affected between 2 and 10 people. Outbreak size might indicate the emphasis a state places on investigating smaller outbreaks, which can affect the speed with which a state identifies contaminated food and removes it from commerce, or it might indicate a more limited food source.
Outbreak Reporting from the States:
Foodborne-Illness Outbreaks from 1998 to 2007
District of Columbia (DC)
30
Reported Outbreaks to CDC
12
Solved Outbreaks
11
Solved Outbreaks Affecting Only DC*
* Excludes multi-state outbreaks
Pathogens Implicated in Outbreaks
24
Overall Reporting Trends
Trends in Reported & Solved Outbreaks
~The following analyses use only the 740 outbreaks affecting the residents of Florida. These outbreaks best reflect the capacity and
effectiveness of the state in investigating outbreaks.~
Outbreak Size Over a ten-year period, Florida’s state and local health
departments reported 1,954 outbreaks to the Centers for Disease Control and Prevention (CDC). Of the reported outbreaks, 752 were solved, including 740 outbreaks affecting only Florida residents. “Solved” outbreaks - those where both a pathogen and a food source are identified - represent a minority of most states’ reported outbreaks. Solved outbreaks are the most valuable in terms of providing information to help prevent future illnesses. Rapid identification of the contaminated food source can enable states to quickly alert consumers and implement a food recall, thereby decreasing the public health impact.
The most common pathogen implicated for food-related outbreaks in Florida was Staphylococcus, 173 outbreaks (23%), followed by Norovirus, 161 outbreaks (22%).
In 2007, Florida reported 104 outbreaks to the CDC, or 5 reported outbreaks per 1 million population. That year represents a low reporting year. During the peak reporting years of 1998 (278) and 2001 (269), Florida reported more than twice that number of outbreaks. The median number of reported outbreaks was 11 per 1 million population over the ten-year period.§
§
See the US map in Figure 2
Eighty-one percent of Florida’s outbreaks affected between 2 and 10 people. Outbreak size might indicate the emphasis a state places on investigating smaller outbreaks, which can affect the speed with which a state identifies contaminated food and removes it from commerce, or it might indicate a more limited food source.
Outbreak Reporting from the States:
Foodborne-Illness Outbreaks from 1998 to 2007
Florida (FL)
1,954
Reported Outbreaks to CDC
752
Solved Outbreaks
740
Solved Outbreaks Affecting Only FL*
* Excludes multi-state outbreaks
Pathogens Implicated in Outbreaks
25
Overall Reporting Trends
Trends in Reported & Solved Outbreaks
~The following analyses use only the 99 outbreaks affecting the residents of Georgia. These outbreaks best reflect the capacity and
effectiveness of the state in investigating outbreaks.~
Outbreak Size Over a ten-year period, Georgia’s state and local health
departments reported 283 outbreaks to the Centers for Disease Control and Prevention (CDC). Of the reported outbreaks, 116 were solved, including 99 outbreaks affecting only Georgia residents. “Solved” outbreaks - those where both a pathogen and a food source are identified - represent a minority of most states’ reported outbreaks. Solved outbreaks are the most valuable in terms of providing information to help prevent future illnesses. Rapid identification of the contaminated food source can enable states to quickly alert consumers and implement a food recall, thereby decreasing the public health impact.
The most common pathogen implicated for food-related outbreaks in Georgia was Norovirus, 26 outbreaks (26%), followed by Staphylococcus and Salmonella, both with 20 outbreaks (20% each).
In 2007, Georgia reported 29 outbreaks to the CDC, or 3 reported outbreaks per 1 million population. That year represents an average reporting year. During the peak reporting year of 2000 (42), Georgia reported 50% more outbreaks. The median number of reported outbreaks was 3 per 1 million population over the ten-year period.§
§See the US map in Figure 2
Thirty-four percent of Georgia’s outbreaks affected between 2 and 11 people. Outbreak size might indicate the emphasis a state places on investigating smaller outbreaks, which can affect the speed with which a state identifies contaminated food and removes it from commerce, or it might indicate a more limited food source.
Outbreak Reporting from the States:
Foodborne-Illness Outbreaks from 1998 to 2007
Georgia (GA)
283
Reported Outbreaks to CDC
116
Solved Outbreaks
99
Solved Outbreaks Affecting Only GA*
* Excludes multi-state outbreaks
Pathogens Implicated in Outbreaks