W
orking papers
W
orking papers
e
serie
c
Natalia Melgar, Juliette Milgram-Baleix and Máximo Rossi
WP-EC 2009-06Explaining protectionism support:
Los documentos de trabajo del Ivie ofrecen un avance de los resultados de las investigaciones económicas en curso, con objeto de generar un proceso de discusión previo a su remisión a las revistas científicas. Al publicar este documento de trabajo, el Ivie no asume responsabilidad sobre su contenido.
Ivie working papers offer in advance the results of economic research under way in order to encourage a discussion process before sending them to scientific journals for their final publication. Ivie’s decision to publish this working paper does not imply any responsibility for its content.
La Serie EC, coordinada por Matilde Mas, está orientada a la aplicación de distintos instrumentos de análisis al estudio de problemas económicos concretos.
Coordinated by Matilde Mas, the EC Series mainly includes applications of different analytical tools to the study of specific economic problems.
Todos los documentos de trabajo están disponibles de forma gratuita en la web del Ivie http://www.ivie.es, así como las instrucciones para los autores que desean publicar en nuestras series.
Working papers can be downloaded free of charge from the Ivie website http://www.ivie.es, as well as the instructions for authors who are interested in publishing in our series.
Edita / Published by: Instituto Valenciano de Investigaciones Económicas, S.A.
Depósito Legal / Legal Deposit no.: V-1687-2009
WP-EC 2009-06
Explaining protectionism support:
the role of economic factors
*Natalia Melgar, Juliette Milgram-Baleix and Máximo Rossi**
Abstract
In this paper, we investigate some factors shaping individual support for protectionism that have not been studied previously. We examine a heterogeneous sample of thirty countries which includes both small and large and developed and developing countries using data from the 2003 International Social Survey Program (ISSP).
We confirm the influence of social status, relative income, values and attachments on preferences for trade policies and the fact that skilled people are also more likely to be pro-trade. We also verify previous findings concerning the fact that individual’s opinions match with how their revenue could be affected in the medium or long term by trade liberalization. We highlight other important factors influencing public opinion towards protectionism: individual support for protectionism is also affected by the macroeconomic context and size of their country of residence.
JEL classification: D01, F13
Keywords: Preferences, protectionism support, free trade, trade policies, mercantilist, nationalism.
Resumen
Este trabajo analiza cuales son los factores que explican el apoyo de los individuos a políticas proteccionistas incluyendo características tanto del individuo como de su país de residencia, que no han sido incluidos en trabajos previos. Para ello, se utiliza una muestra heterogénea de treinta países que incluye economías de distinto tamaño, países desarrollados y en vías de desarrollo. La base de datos corresponde a la encuesta realizada en el año 2003 por la red International Social Survey Program (ISSP). Se confirma que el status social, el ingreso relativo, los valores y los apegos juegan un rol significativo en la determinación de las preferencias por el libre comercio. En segundo lugar, se constata que los individuos con mayores niveles de educación tienden a preferir el libre comercio. Además, se verifica que las opiniones de los individuos son determinadas por la percepción de cómo afecta la liberalización comercial a su ingreso en el medio y largo plazo. Por ultimo, se destacan factores adicionales relevantes en la determinación de las actitudes individuales frente al proteccionismo: el contexto macroeconómico y el tamaño relativo del país de residencia.
Palabras claves: preferencias, apoyo al proteccionismo, libre comercio, políticas comerciales, mercantilismo, nacionalismo.
*
Juliette Milgram gratefully acknowledges financial support from the CICYT Projects SEJ2005-001163 and ECO2008-04059 (Spanish Ministry of Education and FEDER) and Projects SEJ 340 and SEJ03261 of the Junta de Andalucía.
**
0. Introduction
Trade restriction levels are strongly correlated with average support for protectionism among residents. Protectionism support mainly depends on non-economic factors such as religion, political preferences and nationalism, as well as demographic characteristics. Concerning economic determinants of protectionism, individuals’ preferences may depend on how their income will be affected by trade liberalization. In this paper, we investigate some yet-to-be-studied factors that may influence opinions towards trade policies. We argue that individual support for protectionism is not only affected by the above mentioned factors but also affected by the macroeconomic context of their country of residence.
The International Social Survey Program (ISSP) 2003 survey, which is available for more than thirty countries, offers a good opportunity for studying reasons for protectionism support. As previous studies have already demonstrated, the ISSP allows the influence of social status, relative income, values and attachments on preference formation to be checked. Additionally, one can test if individuals react according to how specialization affects their personal revenue. But it also offers a less investigated possibility, that is, to verify to what extent the observed heterogeneity across individuals in their support for protectionism may be explained by some economic characteristics of their place of residence. To investigate this issue, we explain protectionism support using an ordered probit model that includes individual characteristics and country characteristics such as Gross National Income (GNI) per capita, average growth, inflation rate, import penetration rate, export ratio, an indicator of trade restrictions on imports and an indicator of market access. We also check if our results are sensitive to country type by distinguishing between large, small, European Union (EU) countries, non-EU countries, high income countries and low income countries.
We confirm the previous findings of Mayda and Rodrik (2005) concerning the fact that individual’s opinions match with how their revenue could be affected in the medium or long term by trade liberalization. We also add new findings. First, we find that inflation increases protectionism support despite the fact that trade liberalisation could lead to a price reduction. Second, it seems that EU residents and those who live in large countries are aware of the possibilities they have to increase their terms of trade via protectionist measures. Finally, we find that more imports increase support for protectionism, while more exports decrease this support. In the same way, protectionist measures imposed by the respondent’s country make individuals more pro-protectionism after controlling for endogenous bias. But more important is the fact that
individuals take into account the access granted to their exports when considering the possibility of imposing restrictive measures on imports.
In the first section of this paper we review the theory and evidence on this issue. In section two, we describe the empirical strategy used in this paper. In section three, we present and discuss the results, while we draw conclusions in section four.
1.
Hypotheses and evidence concerning protectionism support
1.1 The comparative advantage explanation
Comparative advantage models explain how international trade affects personal income through changes in relative prices. Since the Hecksher-Ohlin model (H-O) assumes complete costless factor mobility across sectors, it is often presented as a long-run view. In contrast, the Ricardo-Viner model (R-V) assumes the existence of sector-specific factors and for this reason is often presented as a medium-term model. Based on the H-O model, unskilled workers in unskilled abundant countries are expected to support free trade, while skilled workers would be expected to oppose it. The opposite would occur in skill abundant countries. On the other hand, the R-V model predicts that specific factors of the importing sector will lose out from trade liberalization, but factors specific to the export sector will gain from it. Given that labour is not very mobile across sectors in the short term, individual trade policy preferences will depend on whether the person is employed in an import-substituting or exporting industry (Gawande and Krishna, 2003).
Although empirical studies confirm that trade policy preferences depend on an individual’s skills, the results of these studies are not fully in line with the H-O model. O’Rourke and Sinnott (2006), Baker (2005), Mayda and Rodrik (2005) and Beaulieu et al. (2004a) found that skilled workers are more prone to accept free trade, regardless of their country’s endowments. Furthermore, these studies showed that the differential in support for free trade between skilled and unskilled workers is higher in countries that are relatively abundant in skilled labour. Sanz and Martínez i Coma (2008) find more convincing results in favour of the H-O model. They study the opinion of European citizens towards globalization. In their sample, skills favour pro-trade attitudes in countries which are more skill abundant than the sample average, while the opposite occurs in the rest of the countries. Mayda and Rodrik (2005) perform a comparative analysis of twenty-three countries using the ISSP and VVF databases. They find that
people with higher human capital endowments oppose trade restrictions only in countries such as Germany and USA that are abundant in human capital, while the opposite happens in the Philippines (the poorest country in their sample). The remaining countries in the sample are half-way between these two extremes. Beaulieu et al. (2005) consider that the sample of countries in the ISSP database does not include a sufficient number of low-skilled countries to verify the H-O hypothesis. In their study on Latin American countries, they find that skilled workers are less likely to oppose free trade in all countries. An explication for this can be found in Rodrik (1997), who suggested that globalization tends to favour production factors that are internationally mobile. To the extent that skilled labour is more mobile than unskilled labor, skilled workers will be more optimistic about trade liberalization, regardless of the relative abundance of skills in their country (O’Rourke and Sinnott, 2006).
1.2 Other economic factors influencing protectionism support
Support for protectionism may therefore be explained by the impact of trade on individual income. But comparative advantage does not fully explain the differential wages within and across countries. Wood (1998) reports that imports of manufactured goods from developing countries account for a small fraction of OECD GDP (about 3 percent). They point out that these volumes of trade are too small to have an important effect on wage inequality. A great part of world trade and more than half of the total volume of trade in high-income countries can be considered intra-industry trade.
According to Helpman and Krugman (1996), the income redistribution effects of intra-industry trade differ substantially from those of inter-industry trade. Two-way trade affects differentiated products and implies a reallocation of resources among firms, but within the same industry. Trade of similar products is explained by the similarity of tastes and production structures, thus explaining why two-way trade usually takes place between countries with similar levels of development and factor endowments. Furthermore, differentiated products are more capital intensive, thus explaining the fact that developed countries present higher levels of this type of trade. Accordingly, support for free trade should be higher in countries that are more involved in intra-industry trade. Indeed, Beaulieu et al. (2004a) find that support for trade by skilled workers is systematically higher in countries with a higher level of intra-industry trade.
The H-O model implies that trade liberalization would affect skilled and unskilled workers in a different manner. However, there are other explanations for the increasing skill premium within countries. Although it is beyond the scope of this paper to study this phenomenon in depth, it is useful to mention the main explanations. Feenstra and Hanson (1997) argue that the increase in direct foreign investment in developing countries increases the skill intensity of production. Robbins (1996) suggests that trade may also be ‘skill-enhancing’ since it accelerates the transfer of technology (incorporated in imports) which is complementary to skills (for further details see Beaulieu et al., 2001, 2004b and 2004c; Dinopoulos and Segerstrom, 1999; Feenstra and Hanson, 1997 and Sener, 2001).
Epifani and Gancia (2008) demonstrate that stronger returns to scale in skill-intensive sectors and monopolistic competition imply that any increase in the volume of trade, even between identical countries, tends to be skill-biased. De Santis (2003) and Feenstra and Hanson (1997) argue that sector-biased technical change could be considered the main cause of the increasing demand for skilled workers (the worldwide diffusion of technology leads to the development of high-skilled services).
To the extent that the greater part of technology is imported (via imports of inputs or foreign direct investment, FDI), globalization also partly explains the increase of the skill premium since it contributes to this technology diffusion process. Hence, the link between trade liberalization and wages becomes more ambiguous (O’Rourke and Sinnott, 2006) and so do the conclusions regarding trade policy preferences. Additionally, people with higher educational levels anywhere in the world may be more flexible and more able to deal with the rigors of the market and therefore more likely to support trade liberalization (Gabel, 1998). This is an additional reason to explain why skilled workers are generally expected to be more willing to support free trade.
Using a consumer survey, Denslow and Fullerton (1996) ask 913 respondents in Florida about their support for the North America Free Trade Agreement (NAFTA) in 1993. They find that education and confidence about future national performance variables are the most important determinants of consumer attitudes towards trade policy. Their results point to the influence of risk aversion on people’s attitudes.
In the same line, Beaulieu et al. (2005) find that countries with higher support for trade tended to be countries that grew faster in the last decade. Concerning risk aversion, Scheve and Slaughter (2004) show that FDI has increased worker insecurity in the UK since international firms face greater elasticity in terms of labour demand, thereby increasing the volatility of wages and employment. This phenomenon could
explain the greater support for trade and migration restrictive policies in the UK. In line with this previous result, Mah (2002) shows that globalization strengthens income inequalities in Korea. The author proves that the Gini index tends to increase with FDI inflows and trade liberalization.
Another key factor for explaining trade is the geographical proximity due to transportation costs (freight, communication, information costs) and affinity between countries since cultural, historical or political ties may influence consumer preferences and transaction costs.1 Disdier and Mayer (2007) study the relationship between opinions in favour of the Eastern enlargement of the EU expressed by citizens of the EU and trade flows. They conclude that bilateral affinity has a large impact on trade even when proximity is controlled for. Thus, they find weak evidence for the reverse relationship, that is, the fact that trade and other country-specific factors significantly affect bilateral opinions about enlargement.
Doyle and Fidrmuc (2006) analyze support for EU membership in the new member and candidate countries of the EU in 2002 (Bulgaria, Cyprus, Czech Republic, Estonia, Hungry, Latvia, Lithuania, Malta, Poland, Romania, Slovak Republic, Slovenia and Turkey). The authors show that support for EU membership was not universally shared among the nationals of new member countries. Becoming a member affects the various socio-economic groups in two ways: 1) efficiency gains and 2) new economic opportunities (access to the European Single Market, inclusion in the redistribution system and the Common Agricultural Policy). Their results suggest that individuals with relatively flexible human capital (those with high education, white-collar occupations, high income, etc.) tend to support EU membership. In contrast, those who may benefit from redistribution in the EU (the elderly, less educated, unemployed, etc.) tend to oppose accession. According to the authors, this result implies that ‘the nationals of the new member states tend to put a greater weight on the gains from improved efficiency and new opportunities, while they discount the potential benefits from receiving subsidies from the richer EU member states’.
Moreover, Caplanova et al. (2004) analyze attitudes to EU membership among countries in Central and Eastern Europe. They find that good economic performance increases the probability of supporting membership as do education and personal income. Taking into account EU countries and this group of candidates, the authors find that, in all cases, education has a positive effect. However, this result does not verify the H-O model because human capital is relatively scarce in Central and Eastern Europe.
As regards opinion polls, trade restriction levels are found to be strongly correlated with average support for protectionism among residents. But the sense of the causal relationship between preferences for protectionism and trade policies is not clear. Policy makers may design policies bearing in mind public opinion, that is, according to the ‘demand’ side. But in turn, trade policies may cause biased attitudes towards trade policies. As suggested by Mayda and Rodrik (2005), the ‘supply’ side may also be important. These authors test the hypothesis that trade policies may influence individuals’ attitudes in a non-uniform manner within a country, but do not find significant evidence to support this hypothesis.
1.3 Non-economic factors
The above papers agree that trade policy preferences largely depend on non-economic factors such as religion, political preferences and nationalism, as well as demographic characteristics. Regarding individuals’ ideology, one would expect that those who define themselves as belonging to the left would be more likely to support protectionist policies than those who identify with the right (Daniels and von der Ruhr, 2005). Concerning the influence of religious beliefs, Guiso et al. (2003) argue that attitudes towards trade with ‘others’ and accepting ‘others’ differ between religious denominations. In their study for the United States, they find that Catholics, Baptists and Methodists are more likely to support trade restrictions than those with no religious affiliation.
Undoubtedly, attachment to country and national pride matter in any debate concerning external policies issues. O'Rourke and Sinnott (2006) state that these values play an important role in trade-policy preferences due to the fact that such elements could translate into feelings of national superiority and the rejection of foreign products. In this respect, there are different degrees of attachment to one's country which shape the differences between patriotism, nationalism and chauvinism. Patriotism is the genuine feeling of attachment to one's country, while nationalism implies a greater devotion to one's country placing it above others and chauvinism is an extreme form of nationalism characterized by a feeling of superiority in regard to other nations (Mayda and Rodrik, 2005).
While all three concepts are linked to national pride, they are clearly different from one another. National pride and patriotism coexist, while nationalism goes far beyond national pride. Indeed, the latter is a prerequisite to the former. Thus, there is no
contradiction between feelings such as national pride and cosmopolitanism, whereas nationalism and cosmopolitanism are in essence contradictory (Smith and Kin, 2006). In consequence, patriotism is not contradictory to supporting free trade, while in the case of nationalism the relationship is ambiguous. The attitude taken will depend on the person’s intake on the consequences of free trade. If the person sees free trade as a positive-sum game, and therefore accepts that trade implies benefits for the country as a whole, one would expect ‘patriots’ (those who are concerned for their country as a whole and do not consider distributive effects) to favour free trade. However, if the person perceives trade as a zero-sum game in which some nations win and others lose or if they consider that the social consequences could be adverse, they would be likely to support trade restrictions. Finally, those who consider that their country is better than others are more likely to prefer their country’s isolation and would therefore support import-restrictive policies (Mayda and Rodrik, 2005).
As concerns political systems, O’Rourke and Taylor (2006) argue that a democratic system is not enough to guarantee free trade and show that relative factor endowments play a more relevant role. Restrictions to trade will be lower if workers benefit from them (this is true when human capital is relatively abundant) and vice versa.
Finally, there are many demographic variables that are relevant to explaining trade policy preferences. For example, in regard to age and gender, previous empirical studies have shown that the elderly are more likely to support import-restrictive policies than younger people. The same can be said for women in comparison to men. Additionally, some empirical studies (Mayda and Rodrik, 2005 or O´Rourke and Sinnott, 2006) find that married people are also more likely to support trade restrictions.
2. Empirical
strategy
We study how the different characteristics of both individuals and countries affect support for protectionism. To this end, we estimate ordered probit models. The degree of support for protectionism is related to a set of independent variables observed at either the individual level or the country level.
2.1 Characterizing respondents
In this paper we use data from the National Identity module of the 2003 International Social Survey Program (ISSP). The ISSP is an ongoing effort devoted to cross-national research on social attitudes. The survey asks respondents about their opinions on a great variety of issues, including trade preferences, immigration, patriotism and politics, as well as demographic and socio-economic information such as age, gender, education, religiosity, political party affiliation and others. The individuals are from 33 countries across all five continents.2
The question used in the survey to identify respondents’ trade preferences is: “How much do you agree or disagree with the following statement: ‘Respondent’s country’ should limit the import of foreign products in order to protect its national economy”.3 It could be argued that the last part of the question (‘in order to protect its national economy’) leads to a biased response in favour of protectionism as it implies that limiting imports is a way of protecting the economy and is therefore something positive. However, there are two arguments that partially detract from this criticism. Firstly, this is the usual manner of speech employed to defend protectionist policies and thus the normal terms used to discuss the matter. Hence, this question would not necessarily induce the respondent to answer in a particular way. And secondly, because the goal of this paper is to analyze the relationship between this variable and others and not to estimate the absolute level of support for protectionism, our analysis is less vulnerable to this type of bias (O'Rourke and Sinnott, 2006).
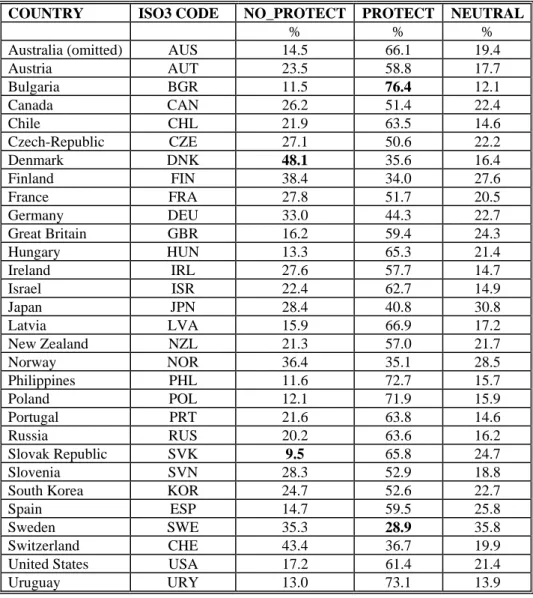
On average, about 1,000 people have answered the survey in each country, obtaining a total of 42,154 observations. Table 1 shows the distribution of answers for each country. The share of people supporting protectionism ranges from 28.9 percent (in Sweden) to 76.4 percent (in Bulgaria). The share of people who clearly disagree or strongly disagree with protectionism measures rarely exceeds 30 percent except for Switzerland (43 percent), Sweden (35 percent), Norway (36 percent) and Denmark (48 percent). It is striking that these last three countries are neighbours and have similar political systems with a high level of state intervention.
The ISSP dataset provides a unique opportunity to verify all the hypotheses emerging from the previous review of the literature. For the purpose of the model, national characteristics and the responses by individuals have been recoded into dummy variables. We take into account years of education (EDUYRS). Personal skills are the key-variable to verify whether an individual reacts according to the Stolper-Samuelson theorem. In our data, we have high, middle and lower-middle income countries
(according to the World Bank classification, Atlas Method). Our sample is less biased towards rich countries than the 1995 ISSP used in Mayda and Rodrik (2005), though we cannot consider that we have a representative sample of poor countries. The ISSP also provides information about earnings, which we include in logarithms (LRINC) and a subjective evaluation by the individual regarding his or her social status (UPPER_CLASS). We expect that the probability of supporting protectionism decreases as years of education and/or income increase.
TABLE1:DESCRIPTIVE STATISTICS
COUNTRY ISO3 CODE NO_PROTECT PROTECT NEUTRAL
% % %
Australia (omitted) AUS 14.5 66.1 19.4
Austria AUT 23.5 58.8 17.7
Bulgaria BGR 11.5 76.4 12.1
Canada CAN 26.2 51.4 22.4
Chile CHL 21.9 63.5 14.6
Czech-Republic CZE 27.1 50.6 22.2
Denmark DNK 48.1 35.6 16.4
Finland FIN 38.4 34.0 27.6
France FRA 27.8 51.7 20.5
Germany DEU 33.0 44.3 22.7
Great Britain GBR 16.2 59.4 24.3
Hungary HUN 13.3 65.3 21.4
Ireland IRL 27.6 57.7 14.7
Israel ISR 22.4 62.7 14.9
Japan JPN 28.4 40.8 30.8
Latvia LVA 15.9 66.9 17.2
New Zealand NZL 21.3 57.0 21.7
Norway NOR 36.4 35.1 28.5
Philippines PHL 11.6 72.7 15.7
Poland POL 12.1 71.9 15.9
Portugal PRT 21.6 63.8 14.6
Russia RUS 20.2 63.6 16.2
Slovak Republic SVK 9.5 65.8 24.7
Slovenia SVN 28.3 52.9 18.8
South Korea KOR 24.7 52.6 22.7
Spain ESP 14.7 59.5 25.8
Sweden SWE 35.3 28.9 35.8
Switzerland CHE 43.4 36.7 19.9
United States USA 17.2 61.4 21.4
Uruguay URY 13.0 73.1 13.9
NOTE: Source: ISSP
We also consider the individual’s political affiliation (RIGHT), religious attendance (ATTEND), union affiliation (UNION), variables related to attachments (ATTACH), patriotism (PRIDE1 and PRIDE2), nationalism (NATSUP), pride for
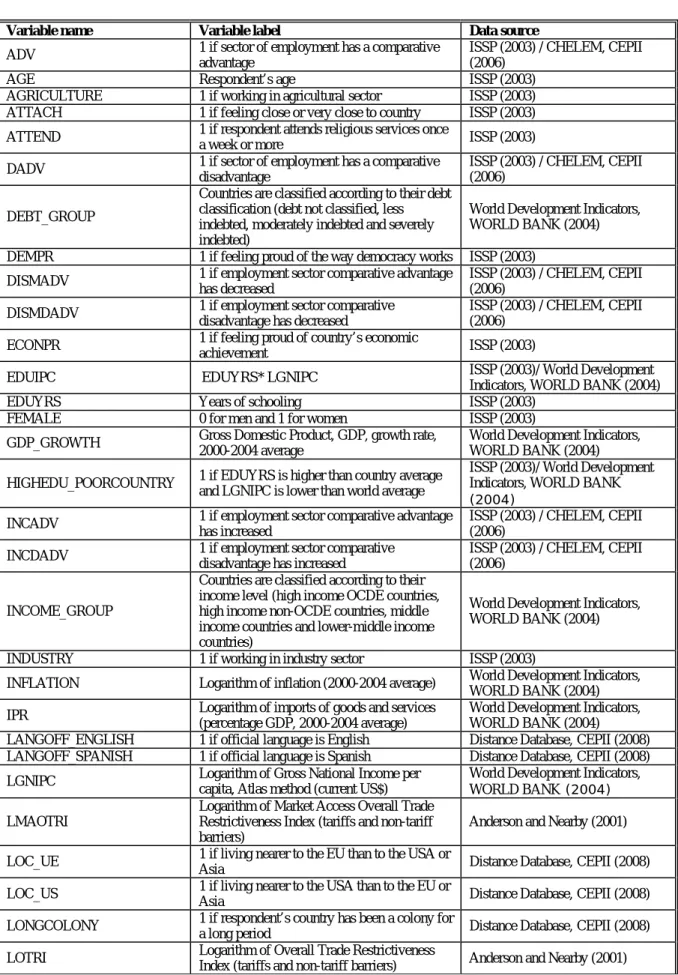
democracy (DEMPR) and pride in the economic achievements (ECONPR) of the country. As concerns demographic variables, we consider age (AGE), marital status (NOT_MARRIED) and gender (FEMALE), which usually strengthen the protectionist view. For the reasons explained in the previous section, we expect all of these variables to have a positive impact on individuals’ support for protectionism, except for RIGHT and NOT_MARRIED, for which a negative impact is expected. A description of the independent variables can be found in Table 2.
Finally, we generate a variable concerning the respondent’s specific occupation in order to test the predictions of the H-O and R-V models. In the ISSP survey, this information is coded according to the International Statistical Comparisons of Occupational and Social Structures, ISCO-88, providing information about the occupation but not directly about the industry. We reclassify the occupation variables from the ISSP data set in order to match them with the CHELEM database. In most cases, the classification indicates the industry like “glass, ceramics and related plant operators” but for some occupations we only know if they work in agriculture, manufacturing or services like “managers of small enterprises in manufacturing” and were not able to assign them to a more detailed manufacturing industry.
On the one hand, we reclassified this information into three productive sectors: agriculture, industry and services. Since industrial and agricultural products are more easily traded than services, we expect people working in non-trading sectors to be more likely to favour free trade than other people. Since workers in the agricultural sector are assumed to be less mobile than those working in the industrial sector and because of the higher level of protection in this sector, we guess that people working in agriculture would be more protectionist than those working in industry. On the other hand, we also classify agricultural and industrial activities into activities with comparative advantages and disadvantages as indicated by the CHELEM, CEPII database for the year 2003. According to the R-V model, we expect that people working in sectors with comparative disadvantages support protectionism, whereas the opposite should occur for people working in sectors with comparative advantages.
TABLE2:DESCRIPTION OF VARIABLES
Variable name Variable label Data source ADV 1 if sector of employment has a comparative
advantage
ISSP (2003) / CHELEM, CEPII (2006)
AGE Respondent’s age ISSP (2003)
AGRICULTURE 1 if working in agricultural sector ISSP (2003) ATTACH 1 if feeling close or very close to country ISSP (2003) ATTEND 1 if respondent attends religious services once
a week or more ISSP (2003) DADV 1 if sector of employment has a comparative
disadvantage
ISSP (2003) / CHELEM, CEPII (2006)
DEBT_GROUP
Countries are classified according to their debt classification (debt not classified, less indebted, moderately indebted and severely indebted)
World Development Indicators, WORLD BANK (2004) DEMPR 1 if feeling proud of the way democracy works ISSP (2003)
DISMADV 1 if employment sector comparative advantage has decreased
ISSP (2003) / CHELEM, CEPII (2006)
DISMDADV 1 if employment sector comparative disadvantage has decreased
ISSP (2003) / CHELEM, CEPII (2006)
ECONPR 1 if feeling proud of country’s economic
achievement ISSP (2003)
EDUIPC EDUYRS*LGNIPC ISSP (2003)/ World Development Indicators, WORLD BANK (2004) EDUYRS Years of schooling ISSP (2003)
FEMALE 0 for men and 1 for women ISSP (2003) GDP_GROWTH Gross Domestic Product, GDP, growth rate,
2000-2004 average
World Development Indicators, WORLD BANK (2004) HIGHEDU_POORCOUNTRY 1 if EDUYRS is higher than country average
and LGNIPC is lower than world average
ISSP (2003)/ World Development Indicators, WORLD BANK (2004)
INCADV 1 if employment sector comparative advantage has increased
ISSP (2003) / CHELEM, CEPII (2006)
INCDADV 1 if employment sector comparative disadvantage has increased
ISSP (2003) / CHELEM, CEPII (2006)
INCOME_GROUP
Countries are classified according to their income level (high income OCDE countries, high income non-OCDE countries, middle income countries and lower-middle income countries)
World Development Indicators, WORLD BANK (2004) INDUSTRY 1 if working in industry sector ISSP (2003)
INFLATION Logarithm of inflation (2000-2004 average) World Development Indicators, WORLD BANK (2004) IPR Logarithm of imports of goods and services
(percentage GDP, 2000-2004 average)
World Development Indicators, WORLD BANK (2004)
LANGOFF_ENGLISH 1 if official language is English Distance Database, CEPII (2008) LANGOFF_SPANISH 1 if official language is Spanish Distance Database, CEPII (2008) LGNIPC Logarithm of Gross National Income per
capita, Atlas method (current US$)
World Development Indicators, WORLD BANK (2004) LMAOTRI
Logarithm of Market Access Overall Trade Restrictiveness Index (tariffs and non-tariff barriers)
Anderson and Nearby (2001) LOC_UE 1 if living nearer to the EU than to the USA or
Asia Distance Database, CEPII (2008) LOC_US 1 if living nearer to the USA than to the EU or
Asia Distance Database, CEPII (2008) LONGCOLONY 1 if respondent’s country has been a colony for
a long period Distance Database, CEPII (2008) LOTRI Logarithm of Overall Trade Restrictiveness
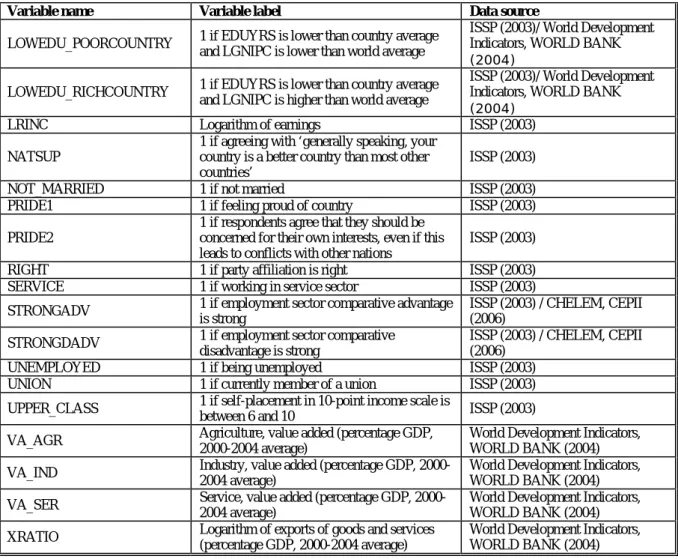
TABLE2:DESCRIPTION OF VARIABLES (CONTINUATION)
Variable name Variable label Data source LOWEDU_POORCOUNTRY 1 if EDUYRS is lower than country average
and LGNIPC is lower than world average
ISSP (2003)/ World Development Indicators, WORLD BANK (2004)
LOWEDU_RICHCOUNTRY 1 if EDUYRS is lower than country average and LGNIPC is higher than world average
ISSP (2003)/ World Development Indicators, WORLD BANK (2004)
LRINC Logarithm of earnings ISSP (2003) NATSUP
1 if agreeing with ‘generally speaking, your country is a better country than most other countries’
ISSP (2003) NOT_MARRIED 1 if not married ISSP (2003) PRIDE1 1 if feeling proud of country ISSP (2003) PRIDE2
1 if respondents agree that they should be concerned for their own interests, even if this leads to conflicts with other nations
ISSP (2003) RIGHT 1 if party affiliation is right ISSP (2003) SERVICE 1 if working in service sector ISSP (2003) STRONGADV 1 if employment sector comparative advantage
is strong
ISSP (2003) / CHELEM, CEPII (2006)
STRONGDADV 1 if employment sector comparative disadvantage is strong
ISSP (2003) / CHELEM, CEPII (2006)
UNEMPLOYED 1 if being unemployed ISSP (2003) UNION 1 if currently member of a union ISSP (2003) UPPER_CLASS 1 if self-placement in 10-point income scale is
between 6 and 10 ISSP (2003) VA_AGR Agriculture, value added (percentage GDP,
2000-2004 average)
World Development Indicators, WORLD BANK (2004) VA_IND Industry, value added (percentage GDP,
2000-2004 average)
World Development Indicators, WORLD BANK (2004) VA_SER Service, value added (percentage GDP,
2000-2004 average)
World Development Indicators, WORLD BANK (2004) XRATIO Logarithm of exports of goods and services
(percentage GDP, 2000-2004 average)
World Development Indicators, WORLD BANK (2004)
2.2 Characterizing countries
We take into account several macroeconomic indicators that may influence individual attitudes towards free trade. Specifically, we include Gross National Income (GNI) per capita, average growth, inflation, production structure, import penetration rate and export ratios, all of which were obtained from the World Bank Database. Finally, we propose a set of characteristics that reflect different barriers to trade imposed and faced by the respondent’s country.
GNI per capita is used as a proxy for capital to labour intensity: a GNI per capita that is higher than the world average reflects a high capital to labour ratio. Moreover, countries with a higher GNI per capita also have a larger share of intra-industry trade. This type of specialization (at least as far as horizontal differentiation is concerned and to a lesser extent vertical differentiation), leads to lower adjustment costs and less
resistance to trade liberalization. In order to check the Stolper-Samuelson theorem hypothesis, we also interact this variable with the individual skill level.
Business cycles may influence respondents’ sensitivity to trade policies. We take into account past average growth and expect respondents to decrease their support for protectionism during phases of expansion. The rate of inflation is also included. This variable can influence individuals in several manners. On the one hand, insofar as a growing inflation rate reflects an uncertain macroeconomic context, the risk aversion of residents may grow and negatively affect their willingness to accept new adjustments caused by the dismantling of trade restrictions. On the other hand, the removal of trade restrictiveness decreases the price of imported products and the general level of prices in the economy, so people may wish to remove protectionist measures in this context. Though, the way inflation rate impacts individual trade policy preferences is not clear.
We also take into account the import penetration rate (IPR). A high penetration rate could reflect a large level of dependency on foreign products and should be associated with a strong support for trade liberalization. However, the relationship between imports and pro-protectionism may be more complex. Penetration rate also depends on trade policies. That is, a low penetration rate can reflect a very strong protectionist policy. In this case, a lower IPR may increase support for protectionism. In both of the previous cases, the relationship between IPR and PROTEC should be negative. In turn, if the presence of foreign products in the domestic market is perceived as an invasion of the domestic market and increase the demand for a protectionist policy, the relationship between IPR and PROTEC would be positive.
We also take into account the ratio of exports to GDP (XRATIO) that has not been accounted for previously in the related literature. As far as national protectionist measures can be seen as a counterpart to the difficulties of exporting, a higher export to GDP ratio should lower support for protectionism.
As a natural complement of IPR and XRATIO, we include indicators reflecting the restrictiveness of the trade policy in the respondent’s country as well as the barriers placed on goods from the respondent’s country in the foreign market. We use the Overall Trade Restrictiveness Index (OTRI) and Market Access Index (MAOTRI) calculated by Anderson and Neary (2001). These indices take into account tariffs and non-tariff barriers imposed by a country in a multilateral context and how these barriers affect country’s imports and exports. A high OTRI for country X denotes that country X highly restricts the imports of foreign products. A high MAOTRI for country X reflects that country X’s exports face high barriers in foreign markets.
As mentioned above, Mayda and Rodrik (2005) test whether trade policies have a non-uniform influence on individuals’ attitudes within a country, but do not find significant evidence to back their hypothesis. Here we test if these measures affect individual attitudes in general. The way restrictive trade policies influence people’s opinions depends on the way they consider these policies to affect them and to what degree they are aware of these measures. In highly protected economies, individuals may value the inconveniences of such a policy more highly or, in contrast, they may fear the costs of removing protection. The expected sign for this coefficient is thus undetermined. Additionally, restrictive policies are, to a larger extent, explained by high support for protectionism so this index may suffer an endogenous bias. We also control for this possible bias using instrumental variables for OTRI.
It is likely that residents in the exporting country will unanimously consider the effect of better access to international markets as being positive. Yet their level of awareness about these measures and how far this sentiment is connected to their support for national protectionism is less clear. If support for protectionism increases (significant positive sign) when there are difficulties for exporting; it will demonstrate that exports are viewed as a counterweight to the removal of national restrictions.
We also take into account the region in which the country is located and if it had colonial ties with another country. The variables have been designed using information from the CEPII database. As mentioned earlier, geographic and historical proximity generally enhance bilateral trade and could positively affect opinions on bilateral trade policy and hence the level of duties among country-pairs. Thus, bilateral opinions are not available in the ISSP dataset. Since the use of a common language is supposed to reduce information costs and facilitate networks, we check if speaking one of the most widely spoken languages in the world pushes down protectionist pressures. We also check to what extent the fact that the respondent’s country has been involved in a colonizing relationship leads to protectionism support.
The graphs below offer a first overview of the relationship between some of these indicators and the amount of people supporting protectionist policies. The average support for protectionism clearly decreases as GNI per capita increases. We detect some outliers like the USA, which reveals stronger support for protectionism than predicted by the country’s GNI per capita, while the opposite occurs for Sweden. The relationship between trade policy instruments and protectionism support is not homogeneous. While countries that apply higher barriers to trade also show a strong support for protectionism, we observe important differences in support for protectionism among EU
PHL URY LVA POL CHL PRT RUS DEU CHE JPN FRA CAN DNK FIN NOR GBR ESP AUS CZE SVN NZL USA HUN AUT 0 5 10 15 20 25
30 35 40 45 50 55 60 65 70 75 80
Share of pers ons s upporting protectionis m
O v era ll T rade R e s tr ic ti v en es s I ndex
members, though the overall restrictiveness index for the EU seems to be correlated with the average support for protectionism shown by its members. Heterogeneity is also striking among countries with lower barriers. The relationship between importing goods and services and the share of protectionist individuals is not as clear as for the GNI per capita. Strong heterogeneity is found among countries with a penetration rate of around 40 percent.
FIGURE 1: SHARE OF PERSONS SUPPORTING PROTECTIONISM AND GNI PER CAPITA
Note: ISO3 countries abbreviations are reported in table 1
FIGURE 2: SHARE OF PERSONS SUPPORTING PROTECTIONISM AND TRADE POLICY
Note: ISO3 countries abbreviations are reported in table 1
BGR URY POL PHL AUS HUN SVK KOR CAN FRA IRL NZL CZE JPN DEU CHL USA PRT SVN SWE ISR CHE NOR AUTGBR RUS LVA ESP DNK FIN 0 5000 10000 15000 20000 25000 30000 35000 40000 45000
25 30 35 40 45 50 55 60 65 70 75 80
Share of persons supporting protectionism
G N I per c a pi ta , 2003 ( c u rr e n t US $)
FIGURE 3: SHARE OF PERSONS SUPPORTING PROTECTIONISM AND IMPORT PENETRATION
Note: ISO3 countries abbreviations are reported in table 1
3.
Results
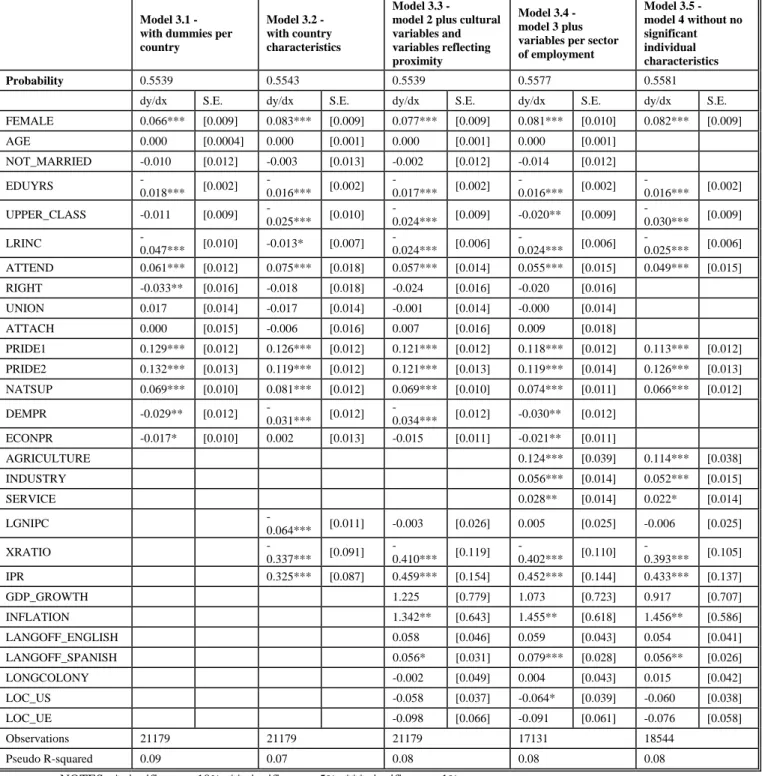
Table 3 presents the results of a series of regressions that explain support for protectionism. It is commonly accepted that country-specific factors influence individuals’ attitudes towards trade policies. For this reason, we first present a model that includes country dummies (model 3.1). Since we want to investigate in an in-depth manner the impact of country characteristics on individual attitudes and provide proof that they play a relevant role, we replace the country dummies for a set of selected country characteristics (models 3.2 - 3.5). Since the results for individual characteristics and the survey are affected very little by the specification used and the sample, we first discuss the individual characteristics that influence protectionist attitudes in subsection 1. The influence of macroeconomic variables is discussed in subsection 2. We provide an empirical verification for the predictions of the H-O and the R-V models in section .3. Section 4 analyses the impact of trade policy indicators. Finally, subsection 5 provides a sensitivity analysis of our main results for different groups of countries.
BGR URY POL PHL AUS HUN SVK KOR CAN FRA IRL NZL CZE JPN DEU CHL USA PRT SVN SWE ISR CHE NOR AUT GBR RUS LVA ESP DNK FIN 0 10 20 30 40 50 60 70 80 90
25 30 35 40 45 50 55 60 65 70 75 80
Share of persons supporting protectionism
Im por ts o f goods and s e rv ic es ( % of G D P ), m e a n 2000-2004
TABLE3:PROTECTIONISM OPINION, OPROBIT MODELS WITH AND WITHOUT COUNTRY DUMMIES
Model 3.1 - with dummies per country
Model 3.2 - with country characteristics
Model 3.3 - model 2 plus cultural variables and variables reflecting proximity
Model 3.4 - model 3 plus variables per sector of employment
Model 3.5 - model 4 without no significant individual characteristics
Probability 0.5539 0.5543 0.5539 0.5577 0.5581
dy/dx S.E. dy/dx S.E. dy/dx S.E. dy/dx S.E. dy/dx S.E. FEMALE 0.066*** [0.009] 0.083*** [0.009] 0.077*** [0.009] 0.081*** [0.010] 0.082*** [0.009] AGE 0.000 [0.0004] 0.000 [0.001] 0.000 [0.001] 0.000 [0.001]
NOT_MARRIED -0.010 [0.012] -0.003 [0.013] -0.002 [0.012] -0.014 [0.012] EDUYRS
-0.018*** [0.002]
-0.016*** [0.002]
-0.017*** [0.002]
-0.016*** [0.002]
-0.016*** [0.002] UPPER_CLASS -0.011 [0.009]
-0.025*** [0.010]
-0.024*** [0.009] -0.020** [0.009]
-0.030*** [0.009] LRINC -0.047*** [0.010] -0.013* [0.007] -0.024*** [0.006] -0.024*** [0.006] -0.025*** [0.006] ATTEND 0.061*** [0.012] 0.075*** [0.018] 0.057*** [0.014] 0.055*** [0.015] 0.049*** [0.015] RIGHT -0.033** [0.016] -0.018 [0.018] -0.024 [0.016] -0.020 [0.016]
UNION 0.017 [0.014] -0.017 [0.014] -0.001 [0.014] -0.000 [0.014] ATTACH 0.000 [0.015] -0.006 [0.016] 0.007 [0.016] 0.009 [0.018]
PRIDE1 0.129*** [0.012] 0.126*** [0.012] 0.121*** [0.012] 0.118*** [0.012] 0.113*** [0.012] PRIDE2 0.132*** [0.013] 0.119*** [0.012] 0.121*** [0.013] 0.119*** [0.014] 0.126*** [0.013] NATSUP 0.069*** [0.010] 0.081*** [0.012] 0.069*** [0.010] 0.074*** [0.011] 0.066*** [0.012] DEMPR -0.029** [0.012]
-0.031*** [0.012]
-0.034*** [0.012] -0.030** [0.012] ECONPR -0.017* [0.010] 0.002 [0.013] -0.015 [0.011] -0.021** [0.011]
AGRICULTURE 0.124*** [0.039] 0.114*** [0.038] INDUSTRY 0.056*** [0.014] 0.052*** [0.015] SERVICE 0.028** [0.014] 0.022* [0.014] LGNIPC
-0.064*** [0.011] -0.003 [0.026] 0.005 [0.025] -0.006 [0.025] XRATIO
-0.337*** [0.091]
-0.410*** [0.119]
-0.402*** [0.110]
-0.393*** [0.105] IPR 0.325*** [0.087] 0.459*** [0.154] 0.452*** [0.144] 0.433*** [0.137] GDP_GROWTH 1.225 [0.779] 1.073 [0.723] 0.917 [0.707] INFLATION 1.342** [0.643] 1.455** [0.618] 1.456** [0.586] LANGOFF_ENGLISH 0.058 [0.046] 0.059 [0.043] 0.054 [0.041] LANGOFF_SPANISH 0.056* [0.031] 0.079*** [0.028] 0.056** [0.026] LONGCOLONY -0.002 [0.049] 0.004 [0.043] 0.015 [0.042] LOC_US -0.058 [0.037] -0.064* [0.039] -0.060 [0.038] LOC_UE -0.098 [0.066] -0.091 [0.061] -0.076 [0.058] Observations 21179 21179 21179 17131 18544 Pseudo R-squared 0.09 0.07 0.08 0.08 0.08
NOTES: * significant at 10%; ** significant at 5%; *** significant at 1% Source: see Table 2
3.1 Who supports protectionist measures?
In analyzing the determinants of trade policy preferences, there are a number of non-economic elements that need to be taken into account, namely political ideology, religious beliefs, pride and nationalism as well as demographic characteristics. In general, our empirical findings validate the theoretical framework.
Firstly, the degree of religiosity (measured by weekly attendance to religious services) has a significant and positive coefficient, thus implying that people who attend religious services are more likely to support import-restrictive policies than the rest. Additionally, political options are determinants of trade preferences. Those who identify themselves with the right are less likely to support protectionism. However, trade union membership does not seem to affect preferences, although previous studies have found that this variable influences protectionist attitudes.
As regards socio-demographic variables, the results show that gender is significant in forming preferences, indicating that women tend to be more protectionist than men. Age, however, is not significant. Regarding marital status, none of the variables studied revealed significant coefficients. Being single is the exception as it appears to be linked with protectionism in some specifications.
As expected, feelings related to patriotism and nationalism affect preferences. However, feelings of attachment to one’s country are not significant, thus indicating that patriotism is not contradictory to non-protectionist preferences. On the other hand, strong feelings of national pride and national superiority are correlated with protectionist preferences, although pride for the democratic system of one’s country does not have a significant impact.
Turning to occupational activities, we found that being unemployed does not have a significant impact in the formation of these opinions. This is an unexpected result that may be explained by the fact that unemployed persons do not feel they are affected by the situation of a particular sector. In turn, people in unstable working conditions (part-time employees) are more supportive of protectionist measures. People employed full time are more willing to be pro-trade. Working for the government increases the probability of being pro-protectionist, whereas working for private or public firms is not significant.
Relative economic status and skills also affect trade preferences in a significant manner. Individuals who place themselves higher on the income scale tend to be fewer
protectionists than those who place themselves in a lower position on the scale. On the other hand, higher levels of education have a negative coefficient in the estimated model, meaning that those with a higher education are less likely to support protectionist policies.
Our conclusions are similar to those of Daniels and von der Rhur (2005) and Mayda and Rodrik (2005) among others, who concluded that social status, relative income, values and attachments are the variables that most influence the formation of preferences. As far as attachments are concerned, our study also confirms that those who feel closer to their neighbourhood, community, country or who define themselves as nationalists tend to be more protectionists. We also agree that pro-trade preferences are positively and robustly correlated with individuals’ level of human capital.
3.2 Macroeconomic context and individual attitudes
Here we test if macroeconomic indicators have the expected impact on individual support for protectionism. When significant, the stock of capital per worker (GNI per capita) negatively affects support for protectionist measures as expected. The evidence concerning other new trade theories is also weak. English as an official language has no significant impact, while living in a Spanish-speaking country increases the probability of being protectionist. People living in countries closer to the USA or the EU are fewer protectionists than others. Living in countries that had a colonial relationship does not have a significant effect. The variables emphasized in new trade theories are determinants of bilateral trade more than multilateral trade. This may explain why they fail to explain protectionism measures regarding trading partners in general.
More interesting conclusions are found regarding other macroeconomic indicators. The growth rate has no significant impact, whereas the inflation rate has a positive sign. While trade liberalization would rationally push prices down, support for protectionism increases when inflation pressures become high. Since high inflation is also synonymous of an unstable macroeconomic context, it also translates into a risky environment. Hence, it looks like individuals consider that the losses suffered from trade liberalization would outweighted the gains, in particular the potential benefit to be obtained from price reductions. Finally, we find that a greater import penetration rate (IPR) positively affects protectionism support, while a greater export ratio (XRATIO) relaxes protectionist pressures.
3.3 H-O and R-V predictions
In models 3.4 and 3.5 (Table 3), we include dummies for the respondent’s sector of activity, distinguishing between agriculture, industry and services. Surprisingly, we find that all three sectors have a significant positive impact, suggesting that workers are, on average, more supportive of protectionist measures. Specifically, we expected people working in services not to be protectionist. Nonetheless, the marginal effects of these variables are more in line with our predictions since the highest impact is found in the case of agriculture (generally more protected) followed by industry and services.
Additional results are found by testing the direct predictions of the H-O and R-V models. In order to test H-O predictions, we interact the variable EDUCYRS with the logarithm of per-capita GDP as in Mayda and Rodrik (2005) and introduce it in model 3.4. Since our sample could suffer from a selection bias towards high and middle income countries, we build alternative measures that take into account the relative endowment level of the countries. Namely, we build three dummies corresponding to: 1) being low-skilled in a high income country; 2) being high-skilled in a high income country and 3) being high-skilled in a poor income country (due to colinearity we omit the last possibility, being low-skilled in a low income country). The results are presented in table 4.
Coefficients for the interacted variable (EDUIPC) should be interpreted jointly with the coefficient of GNIPC and EDUCYRS. EDUCYRS presents a positive sign while EDUIPC presents a negative sign. This means that below a given GNIPC threshold level, education increases support for protectionism, while under a given GNIPC threshold level, low-skill individuals are more reticent towards free trade. Consequently, we expect that education increases protectionist support in countries such as the Philippines (the lowest GNIPC) and at the opposite end, educated people tend to favour free trade in richer countries like Switzerland or Norway. Our results confirm that individuals take into account the redistributive effect of trade.
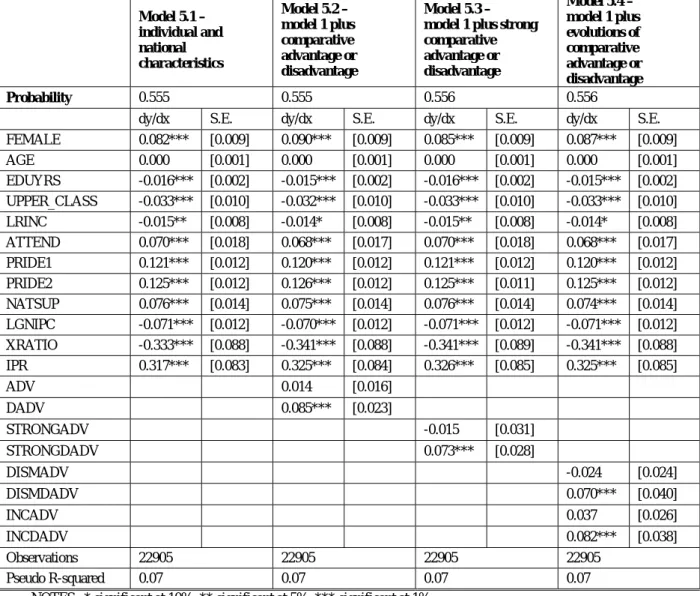
To test whether the R-V model influences individual attitudes, we include two variables in model 5.4 to account for the comparative advantage or disadvantage (calculated in reference as the world trade structure) of the sector in which the respondents are working. Alternatively, we consider increasing comparative advantage or decreasing disadvantage since respondents may be more sensitive to the changes in the specialization pattern rather than to its level. Since highly specialized countries may be more sensitive to external shocks, we also build dummies to reflect the fact that the sector has a strong comparative advantage or disadvantage. In all of the models,
working in a sector with a comparative advantage has no significant effect on the answer, while working in a disadvantaged sector has a positive and significant effect. Our results unambiguously indicate that individuals’ attitudes are biased towards losses.
TABLE4:PROTECTIONISM OPINION, VERIFICATION OF H-O MODEL
Model 4.1 –
interaction effects
Model 4.2 – relative endowment
Probability 0.5716 0.5591
dy/dx S.E. dy/dx S.E. FEMALE 0.080*** [0.010] 0.079*** [0.010]
AGE 0.000 [0.0004] 0.000 [0.001]
NOT_MARRIED -0.006 [0.013] -0.007 [0.013]
EDUYRS 0.052* [0.029]
EDUIPC -0.007** [0.016]
LOWEDU_RICHCOUNT 0.108*** [0.008]
LOWEDU_POORCOUNT 0.046 [0.050]
HIGHEDU_POORCOUNT -0.015 [0.057]
LRINC -0.018*** [0.006]
UPPER_CLASS -0.024** [0.010] -0.035*** [0.009] ATTEND 0.057*** [0.015] 0.060*** [0.014] RIGHT -0.015 [0.016] -0.015 [0.015] UNION -0.015 [0.016] -0.009 [0.014] ATTACH 0.002 [0.015] 0.008 [0.016] PRIDE1 0.107*** [0.011] 0.122*** [0.010] PRIDE2 0.127*** [0.014] 0.119*** [0.013] NATSUP 0.074*** [0.012] 0.077*** [0.010] DEMPR -0.022* [0.012] -0.035*** [0.013] ECONPR -0.024** [0.010] -0.015 [0.010] AGRICULTURE 0.114*** [0.034] 0.118*** [0.036] INDUSTRY 0.045*** [0.012] 0.057*** [0.014] SERVICE 0.026** [0.012] 0.025* [0.014] LGNIPC 0.019 [0.037] -0.080*** [0.024] XRATIO -0.222*** [0.072] -0.223*** [0.054] IPR 0.179** [0.086] 0.228*** [0.073] LANGOFF_ENGLISH 0.092*** [0.030] 0.100** [0.039] LANGOFF_SPANISH 0.049 [0.033] 0.100*** [0.031] LONGCOLONY 0.014 [0.044] 0.001 [0.050] LOC_US -0.052 [0.035] -0.039 [0.045] LOC_UE 0.016* [0.038] -0.025 [0.046]
Observations 21848 18405
Pseudo R-squared 0.07 0.07 NOTES: * significant at 10%; ** significant at 5%; *** significant at 1% Source: see Table 2
TABLE5:PROTECTIONISM OPINION, VERIFICATION OF THE R-V MODEL Model 5.1 –
individual and national characteristics
Model 5.2 – model 1 plus comparative advantage or disadvantage
Model 5.3 – model 1 plus strong comparative advantage or disadvantage
Model 5.4 – model 1 plus evolutions of comparative advantage or disadvantage
Probability 0.555 0.555 0.556 0.556
dy/dx S.E. dy/dx S.E. dy/dx S.E. dy/dx S.E. FEMALE 0.082*** [0.009] 0.090*** [0.009] 0.085*** [0.009] 0.087*** [0.009] AGE 0.000 [0.001] 0.000 [0.001] 0.000 [0.001] 0.000 [0.001] EDUYRS -0.016*** [0.002] -0.015*** [0.002] -0.016*** [0.002] -0.015*** [0.002] UPPER_CLASS -0.033*** [0.010] -0.032*** [0.010] -0.033*** [0.010] -0.033*** [0.010] LRINC -0.015** [0.008] -0.014* [0.008] -0.015** [0.008] -0.014* [0.008] ATTEND 0.070*** [0.018] 0.068*** [0.017] 0.070*** [0.018] 0.068*** [0.017] PRIDE1 0.121*** [0.012] 0.120*** [0.012] 0.121*** [0.012] 0.120*** [0.012] PRIDE2 0.125*** [0.012] 0.126*** [0.012] 0.125*** [0.011] 0.125*** [0.012] NATSUP 0.076*** [0.014] 0.075*** [0.014] 0.076*** [0.014] 0.074*** [0.014] LGNIPC -0.071*** [0.012] -0.070*** [0.012] -0.071*** [0.012] -0.071*** [0.012] XRATIO -0.333*** [0.088] -0.341*** [0.088] -0.341*** [0.089] -0.341*** [0.088] IPR 0.317*** [0.083] 0.325*** [0.084] 0.326*** [0.085] 0.325*** [0.085]
ADV 0.014 [0.016]
DADV 0.085*** [0.023]
STRONGADV -0.015 [0.031]
STRONGDADV 0.073*** [0.028]
DISMADV -0.024 [0.024]
DISMDADV 0.070*** [0.040]
INCADV 0.037 [0.026]
INCDADV 0.082*** [0.038]
Observations 22905 22905 22905 22905
Pseudo R-squared 0.07 0.07 0.07 0.07
NOTES: * significant at 10%; ** significant at 5%; *** significant at 1% Source: see Table 2
3.4 Trade policies
Taking into account model 5.2 of Table 5, we include trade policy indicators and estimate six different models presented in Table 6. Results concerning trade policies are not as robust as those obtained for IPR and XRATIO, but follow the same line. High restriction levels on imports do not affect (when the IPR is also taken into account) or positively affect support for protectionism.
TABLE 6: TRADE POLICY IMPACT ON INDIVIDUAL OPINION TOWARDS PROTECTIONISM
Model 6.1 – individual and national
characteristics plus OTRI
Model 6.2 –
model 1 plus sector of employment and MAOTRI
Model 6.3 –
model 1 plus sector of employment,
MAOTRI and OTRI instrumented
Model 6.4 – individual
characteristics, sector of employment and OTRI
Model 6.5 – model 4 plus MAOTRI
Model 6.6 – model 5 plus LOTRI instrumented
Probability 0.551 0.555 0.563 0.555 0.555 0.562
dy/dx S.E. dy/dx S.E. dy/dx S.E. dy/dx S.E. dy/dx S.E. dy/dx S.E.
FEMALE 0.089*** [0.008] 0.089*** [0.010] 0.085*** [0.009] 0.087*** [0.011] 0.084*** [0.011] 0.081*** [0.010] EDUYRS -0.018*** [0.002] -0.017*** [0.002] -0.017*** [0.002] -0.017*** [0.002] -0.017*** [0.002] -0.018*** [0.002] UPPER_CLASS -0.039*** [0.011] -0.036*** [0.011] -0.036*** [0.012] -0.062*** [0.015] -0.060*** [0.015] -0.057*** [0.016] LRINC -0.014* [0.008] -0.015* [0.008] -0.016* [0.008] -0.009 [0.013] -0.013 [0.012] -0.014 [0.011] ATTEND 0.044*** [0.015] 0.046*** [0.017] 0.039** [0.017] 0.088*** [0.026] 0.092*** [0.027] 0.076*** [0.023] PRIDE1 0.132*** [0.013] 0.129*** [0.014] 0.123*** [0.015] 0.133*** [0.015] 0.136*** [0.015] 0.125*** [0.016] PRIDE2 0.130*** [0.011] 0.126*** [0.012] 0.124*** [0.012] 0.134*** [0.014] 0.129*** [0.012] 0.125*** [0.012] NATSUP 0.068*** [0.016] 0.066*** [0.014] 0.059*** [0.015] 0.058** [0.024] 0.050*** [0.019] 0.039** [0.018] AGRICULTURE 0.094** [0.037] 0.087** [0.038] 0.097** [0.037] 0.102*** [0.035] 0.091** [0.037] INDUSTRY 0.041*** [0.016] 0.046*** [0.016] 0.030* [0.015] 0.031* [0.017] 0.040** [0.016] SERVICE 0.008 [0.013] 0.010 [0.014] 0.000 [0.015] -0.002 [0.015] -0.002 [0.015] LGNIPC -0.079*** [0.021] -0.079*** [0.021] -0.058*** [0.019]
XRATIO -0.327*** [0.092] -0.264*** [0.078] -0.277*** [0.081] IPR 0.262*** [0.099] 0.197** [0.096] 0.230** [0.095]
LOTRI -0.341 [0.454] -0.565 [0.487] 0.597** [0.304] 0.307 [0.384]
LMAOTRI 0.751** [0.380] 0.564* [0.331] 1.194** [0.520] 0.887* [0.457]
LOTRI_instrumented 0.259 [0.398] 1.096** [0.448]
Observations 18770 14920 14348 14920 14920 14348
Pseudo R-squared 0.07 0.07 0.07 0.05 0.06 0.06
NOTES: * significant at 10%; ** significant at 5%; *** significant at 1% Source: see Table 2
As explained, it could be argued that an individual’s attitude towards OTRI is an endogenous variable.4 To control for this bias, we instrument OTRI using variables that may affect the decision to restrain trade at the macroeconomic level. These instruments should not be correlated with the characteristics affecting individuals’ opinions which are not taken into account in the main equation, that is, we must select variables that are not correlated with the residuals of the ordered probit equation. The country characteristics selected may reflect the situation of the business cycle as well as some structural characteristics of the country’s production that may explain its balance of payments situation. Namely, we include inflation and growth rates; share of agriculture, services and industry in the GDP; MAOTRI and indicators of the income and debt group. The results for the first equation are highly significant. All the coefficients are significant at the 1 percent level. These coefficients are as follows:
Results show that trade restriction level does not have a significant impact on individual attitudes except in models where GNIPC, IPR and XRATIO are dropped and OTRI is instrumented. In this case, a high level of import barriers increases personal support for protectionism.
The restrictions imposed on national goods in international markets have a more significant positive impact on individual support for protectionism. This means that people value the facilities or restrictions imposed by their trading partners when making decisions concerning their own trade policy. Although we are not able to investigate this dynamic game in depth, our results suggest that country will cooperate if its partner has cooperated, and it will defect if its partner has defected. Actually, reciprocal trade agreements are usually better accepted rather than unilateral liberalisation because negotiations offer an opportunity to improve market access to counterweight dismantling restrictions in the importing sector.
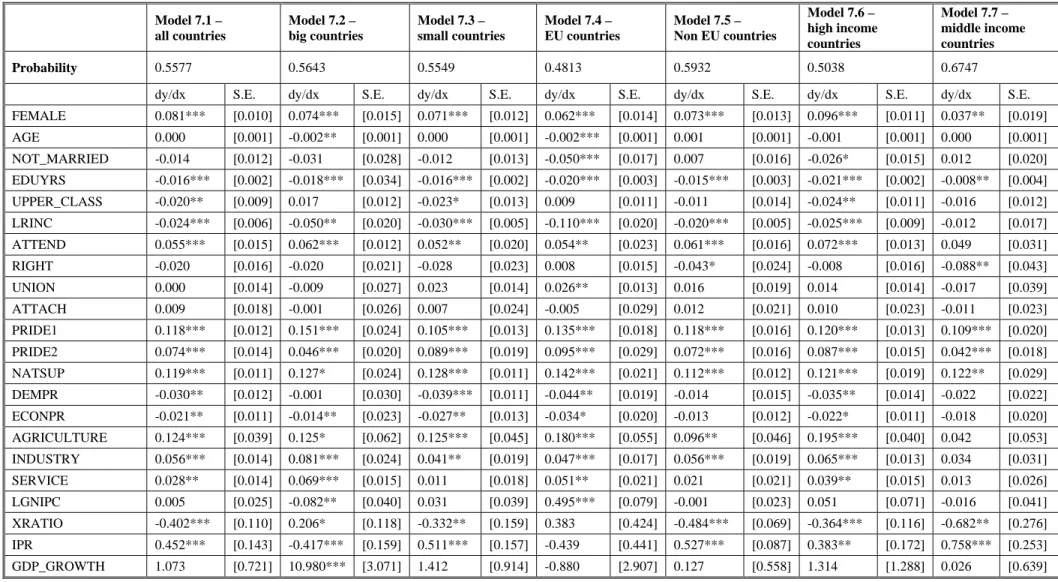
3.5 Sensitivity analysis
In Table 7, we run model 3.4 for different groups of countries (large, small, EU, non-EU, high income and low income) to check the sensitivity of our results concerning country characteristics. The variables included in the model generally have a significant impact on individual preferences, but the way they influence personal attitudes toward
841.476 -DEBT_GROUP * 0.032 UP INCOME_GRO * 0.020 -VA_SER * 8.3416 VA_IND * 8.416 VA_AGR * 8.420 LMAOTRI * 0.176 -GDP_GROWTH * 0.002 -INFLATION * 0.003 OTRi + + + + =
protectionism differs depending on the type of countries. The explanatory power of the model is, in general, larger for high income countries and small countries than for the others.
We confirm that the social scale people place themselves on has a significant effect: those who consider themselves to be ‘rich’ tend to favour free trade more than those who see themselves as being ‘poor’. Additionally, we find that this is less true in high income countries. In the same way, years of schooling play a relevant role in that this variable reduces the probability of supporting restrictions on imports and its impact is almost the same in all the sub-samples.
High GNI per capita is associated with pro-trade attitudes in large countries, but with pro-protectionism in small countries and EU countries (it is not significant in other cases). Hence, we cannot draw clear conclusions about the influence of the intensity of capital to labour. The inflation rate always increases support for protectionism except in the case of large countries.
Generally speaking, people living in countries with a higher import penetration rate are more likely to support protectionism. Actually, this is true overall for small countries and middle income countries, while the opposite occurs in large countries or EU countries. This result supports the view that the term-of-trade argument for protection has an impact on public opinion. Larger markets benefit from a power market that enables them to increase their term of trade by increasing the static gains of protection. A higher export ratio is associated with a non-protectionist attitude, with the exception of EU countries and large countries. Again, these results confirm that large countries are aware that they can take advantage of their weight in worldwide demand and supply.
TABLE 7: PROTECTIONISM OPINION - COUNTRY CHARACTERISTICS Model 7.1 –
all countries
Model 7.2 – big countries
Model 7.3 – small countries
Model 7.4 – EU countries
Model 7.5 – Non EU countries
Model 7.6 – high income countries
Model 7.7 – middle income countries
Probability 0.5577 0.5643 0.5549 0.4813 0.5932 0.5038 0.6747
dy/dx S.E. dy/dx S.E. dy/dx S.E. dy/dx S.E. dy/dx S.E. dy/dx S.E. dy/dx S.E. FEMALE 0.081*** [0.010] 0.074*** [0.015] 0.071*** [0.012] 0.062*** [0.014] 0.073*** [0.013] 0.096*** [0.011] 0.037** [0.019] AGE 0.000 [0.001] -0.002** [0.001] 0.000 [0.001] -0.002*** [0.001] 0.001 [0.001] -0.001 [0.001] 0.000 [0.001] NOT_MARRIED -0.014 [0.012] -0.031 [0.028] -0.012 [0.013] -0.050*** [0.017] 0.007 [0.016] -0.026* [0.015] 0.012 [0.020] EDUYRS -0.016*** [0.002] -0.018*** [0.034] -0.016*** [0.002] -0.020*** [0.003] -0.015*** [0.003] -0.021*** [0.002] -0.008** [0.004] UPPER_CLASS -0.020** [0.009] 0.017 [0.012] -0.023* [0.013] 0.009 [0.011] -0.011 [0.014] -0.024** [0.011] -0.016 [0.012] LRINC -0.024*** [0.006] -0.050** [0.020] -0.030*** [0.005] -0.110*** [0.020] -0.020*** [0.005] -0.025*** [0.009] -0.012 [0.017] ATTEND 0.055*** [0.015] 0.062*** [0.012] 0.052** [0.020] 0.054** [0.023] 0.061*** [0.016] 0.072*** [0.013] 0.049 [0.031] RIGHT -0.020 [0.016] -0.020 [0.021] -0.028 [0.023] 0.008 [0.015] -0.043* [0.024] -0.008 [0.016] -0.088** [0.043] UNION 0.000 [0.014] -0.009 [0.027] 0.023 [0.014] 0.026** [0.013] 0.016 [0.019] 0.014 [0.014] -0.017 [0.039] ATTACH 0.009 [0.018] -0.001 [0.026] 0.007 [0.024] -0.005 [0.029] 0.012 [0.021] 0.010 [0.023] -0.011 [0.023] PRIDE1 0.118*** [0.012] 0.151*** [0.024] 0.105*** [0.013] 0.135*** [0.018] 0.118*** [0.016] 0.120*** [0.013] 0.109*** [0.020] PRIDE2 0.074*** [0.014] 0.046*** [0.020] 0.089*** [0.019] 0.095*** [0.029] 0.072*** [0.016] 0.087*** [0.015] 0.042*** [0.018] NATSUP 0.119*** [0.011] 0.127* [0.024] 0.128*** [0.011] 0.142*** [0.021] 0.112*** [0.012] 0.121*** [0.019] 0.122** [0.029] DEMPR -0.030** [0.012] -0.001 [0.030] -0.039*** [0.011] -0.044** [0.019] -0.014 [0.015] -0.035** [0.014] -0.022 [0.022] ECONPR -0.021** [0.011] -0.014** [0.023] -0.027** [0.013] -0.034* [0.020] -0.013 [0.012] -0.022* [0.011] -0.018 [0.020] AGRICULTURE 0.124*** [0.039] 0.125* [0.062] 0.125*** [0.045] 0.180*** [0.055] 0.096** [0.046] 0.195*** [0.040] 0.042 [0.053] INDUSTRY 0.056*** [0.014] 0.081*** [0.024] 0.041** [0.019] 0.047*** [0.017] 0.056*** [0.019] 0.065*** [0.013] 0.034 [0.031] SERVICE 0.028** [0.014] 0.069*** [0.015] 0.011 [0.018] 0.051** [0.021] 0.021 [0.021] 0.039** [0.015] 0.013 [0.026] LGNIPC 0.005 [0.025] -0.082** [0.040] 0.031 [0.039] 0.495*** [0.079] -0.001 [0.023] 0.051 [0.071] -0.016 [0.041] XRATIO -0.402*** [0.110] 0.206* [0.118] -0.332** [0.159] 0.383 [0.424] -0.484*** [0.069] -0.364*** [0.116] -0.682** [0.276] IPR 0.452*** [0.143] -0.417*** [0.159] 0.511*** [0.157] -0.439 [0.441] 0.527*** [0.087] 0.383** [0.172] 0.758*** [0.253] GDP_GROWTH 1.073 [0.721] 10.980*** [3.071] 1.412 [0.914] -0.880 [2.907] 0.127 [0.558] 1.314 [1.288] 0.026 [0.639]
TABLE 7: PROTECTIONISM OPINION - COUNTRY CHARACTERISTICS (CONTINUATION)
INFLATION 1.455** [0.615] -4.539*** [1.377] 2.862*** [0.590] 20.662*** [6.581] 1.547*** [0.431] 2.249** [1.056] 2.237** [1.132] LANGOFF_ENGLISH 0.059 [0.043] 0.251*** [0.068] 0.010 [0.052] 0.163*** [0.060] 0.007 [0.059] 0.117*** [0.041] 0.051 [0.054] LANGOFF_SPANISH 0.079*** [0.028] 0.100*** [0.020] -0.078 [0.074] -0.202** [0.074] 0.049 [0.076] 0.070 [0.056]
LONGCOLONY 0.004 [0.043] 0.017 [0.086] 0.003 [0.032] -0.324*** [0.056] -0.005 [0.038] -0.040 [0.054] 0.006 [0.067] LOC_US -0.064* [0.039] 0.133 [0.099] -0.084* [0.049] -0.113** [0.045] 0.063 [0.045] LOC_UE -0.091 [0.061] 0.314*** [0.062] -0.253*** [0.084] -0.096 [0.059] -0.123* [0.067]
Observations 17131 5208 11923 5587 11544 11930 5201
Pseudo R-squared 0.08 0.06 0.09 0.10 0.07 0.08 0.05
NOTES: * significant at 10%; ** significant at 5%; *** significant at 1% Source: see Table 2


![TABLE 7: P ROTECTIONISM OPINION - COUNTRY CHARACTERISTICS ( CONTINUATION ) INFLATION 1.455** [0.615] -4.539*** [1.377] 2.862*** [0.590] 20.662*** [6.581] 1.547*** [0.431] 2.249** [1.056] 2.237** [1.132] LANGOFF_ENGLISH 0.059 [0.043] 0.251*** [0.068]](https://thumb-us.123doks.com/thumbv2/123dok_us/8447402.2248620/30.1263.79.1200.268.446/rotectionism-opinion-country-characteristics-continuation-inflation-langoff-english.webp)
