Performance Analysis of User Speed Impact on
IEEE 802.11ah Standard affected by Doppler Effect
Abdul Aziz Marwan
1; Doan Perdana
2; and Danu Dwi Sanjoyo
31,2,3
Faculty of Electrical Engineering, Telkom University Jl. Telekomunikasi No 1 Terusan Buah Batu 40257, Bandung, Indonesia
Abstract: Internet of Things (IOT) offers a new dimension of technology and information where connectivity is available anywhere, anytime, and for any purpose. IEEE 802.11 Wireless Local Area Network group is a standard that developed to answer the needs of wireless communication technology (WI-Fi). Recently, IEEE 802.11 working group released the 802.11ah technology or Wi-Fi HaLow as a Wi-fi standard. This standard works on the 1 GHz frequency band with a broader coverage area, massive device and the energy efficiency issues. This research addresses, the influence of Doppler Effect using Random Waypoint mobility model on 802.11ah with different user speed are analyzed. The design of the simulation system is done by changing user speed and MCS. Based on the result, it can be concluded that the overall performance of the network with all of the parameter scenarios is decreasing along with the increasing user speed, RAW group, and bandwidth. In the user speed scenario, the MCS 5 with RAW group = 2 and bandwidth = 2 MHz in v = 10 km/h scenario has the worst performance with an average delay which is about 0.065463 s, average throughput is about 0.328120 Mbps, and average PDR is about 99.8901%.
Keywords: Restricted Access Window (RAW), IEEE 802.11ah, Random Waypoint, Modulation and Coding Scheme (MCS), Network Simulator 3.
1.
Introduction
Nowadays, Internet of Thing (IoT) offers a new dimension in the world of technology and information where connectivity is available wherever, whenever, and for anything. The current global trend of Internet of Thing is very rapidly evolving from the needs of users that want the efficiency of devices in various aspects in order to facilitate the user's own activities [1]. The number of connected devices being the main point of problems in IoT technology itself related to energy efficiency or energy consumption. The IEEE 802.11 Wireless Local Area Network standard working group operating at 2.4 GHz and 5 Ghz band frequencies is a standard that developed to address the needs for wireless (Wi-Fi) communication technology problems that have a high data rate, easy to develop and lower value in cost aspect, such as Wireless Sensor Network (WSN) and Machine to Machine (M2M) communication that used in application of military, commercial, health care, monitoring of traffic, and also controlling the inventory [2][3]. In its development, the IEEE 802.11 working group released 802.11ah or Wi-fi HaLow technology as the new Wi-fi standard. This standard works on a 1 GHz band frequency with broader area coverage, more effective in cost value with an energy efficiency improvement [4]. 802.11ah provides a shortest MAC header, segmented traffic indication map (TIM), restricted access window (RAW), and target wake time (TWT) that support the efficiency and quantity of energy used by stations (STAs) [5].
In its application, 802.11ah technology can accommodate devices or stations in large numbers and every station has their movement pattern such as static or mobile user characteristics. The movement of stations or mobility can affect the performance of the 802.11ah itself. The most commonly used mobility model according to the literature is the Random Waypoint (RMW) model [6]. Firstly, each station will go to the random destination with random speed, move towards the destination, and pause on several times, then moving again towards the coordinates of the destination. Other similar mobility models such as Random Direction model, the Random Walk model, Manhattan and the Gauss-Markov mobility model are also often used in experimental simulations to obtain data that represent real condition network in the world [7].
The user movement results in fading. The term fading, or, small-scale fading, means rapid fluctuations of the amplitudes, phases, or multipath delays of a radio signal over a short period or short travel distance. While the Doppler Effect is one of the factors that influencing fading which is speed of the mobile. Speed of the mobile is the relative motion between the base station and the mobile results in random frequency modulation due to different Doppler shifts on each of the multipath components [8]. In this research we discuss about the Doppler Effect with the changing of user speed schemes on IEEE 802.11ah standard network performances using Random Waypoint Mobility model. Each of simulation scenario is tested with two different user speed schemes, which are v = 5 km/h and v = 10 km/h. This scenario aims to analyse the performance of user speed impact on 802.11ah and finding the worst user speed that have the worst performance. The user speed schemes are using the v = 5 km/h and v = 10 km/h because the average walking speed of human is 5 km/h. Furthermore, the performance of network is measured using simulation result from Network Simulator 3. The measured output are delay, throughput, and PDR.
The remainder of this research is organized as follows: The related works of this research is presented in section II. In section III the scenario and system design are discussed. The result and analysis are presented in section IV. Section V. presents the conclusion of the research.
2.
Related Works
IEEE 802.11ah RAW for dense IoT network about homogeneous and heterogeneous traffic pattern. The simulation done by changing station number, traffic load and RAW mechanism. The result shows that RAW mechanism is not only increase the latency and throughput but also decrease the network’s power consumption. Yanru Wang has done the simulation about RAW mechanism feature of 802.11ah by applying probability theory and Markov Chain on it [11]. He focused on energy efficiency analysis in 802.11ah. The scope of his research is to optimizing RAW problem for IEEE 802.11ah based on the uplink communication network. He presents a scheme of novel retransmission to utilize the next empty slot to retransmit for collided devices, derive the energy efficiency of the uplink transmission, and propose an energy-aware window control algorithm to optimize the energy efficiency. Bellekens and the team evaluate seven kinds of path loss models, based on campaign of a large scale sub-urban measurement, with macro line-of sight or LoS, pico LoS, and also non-LoS by equal and also different deployments of antenna's height. they proved that the most accurate model is used and determined in combination with parameters of radio transceiver from 802.11ah station hardware to get the throughput and packet loss of MAC-Layer as a distance function [12].
Jeongin Kim and Ikjun Yeom proposed the new of algorithm that can improve the network performance of 802.11ah. The first one is a method that can reduce the maximum delay by allocate the nodes which cannot access the channel to the preferentially reserved slot. The second one is an algorithm to change the reservation of slot duration for nodes that cannot access 802.11ah channel by collision frequency detection. It’s done using NS-3 simulator and show improvement in reducing the value of maximum delay[13].
The author [14] analyze the influence of RAW size to the QoS of the network. Small RAW size can increase delay value due to the collision. On the other hand, large RAW size also can increase delay due to the RAW Turn Around time. So, they proposed algorithms to allocating the nodes and change reservation slot duration in RAW period. The research show that the maximum delay of the algorithm is 0.59 s and it is about 2.6 times smaller if we compared to the maximum delay value of 802.11ah standard.
Doan Perdana has done the simulation about two ray ground propagation channel that caused by AWGN on IEEE 1609.4 standard on Gauss Markov mobility model and Random Way point mobility model, they proved that the random way mobility model has a better performance than Gauss Markov model in low density of nodes [15]. From [16] they proposed a new novel method that consist of a regrouping and a signalling process algorithm. The regrouping algorithm is proposed to minimizing the potential transmission collisions that caused by hidden node problems. The access point will acquire knowledge about the traffic requirement and potential hidden node pairs of the STAs in the network. After that the access point will regroup the STAs into several group of contention according to either an iterative updating manner decentralized or algorithm that Viterbi-like centralised. From the simulation, the proposed techniques show a good improvement to reduce the collision, and also this technique can be used in
other contention based wireless network where the MAC protocol support grouping mechanism.
R. M. N. Ajinegoro [17] has done the simulation about performance analysis of mobility impact on IEEE 802.11ah standard with traffic pattern scheme. They proved that the use of various types of mobility in the 802.11ah standard with heterogeneous and homogeneous traffic patterns has its own influence in network performance. The best mobility model in the proposed scheme is Random Walk mobility model while the Gauss-Markov mobility is showing the lowest performances compared to the other models. This is because the Random Waypoint mobility itself has pause time parameters that make the station stay still in a few moments before moving again, at that pause time, so the communication between access point and station will become more smoothly so the process of sending information becomes better than when it’s on moving condition, while at Gauss-Markov mobility has an alpha as a tuning parameter that makes the movement of Gauss-Markov mobility model’s stations more dynamic than the others [17]. Triani Wulandari [18] has done the simulation about the node density performance analysis on IEEE 802.11ah standard for VoIP service. The evaluation of IEEE 802.11ah standard in the node density scenario accompanied by the changing of RAW station and RAW group number, the use of MCS 5 with 2 MHz bandwidth resulting better network performance than MCS 7 with 1 MHz bandwidth. They proved that increasing the number of RAW stations will result in better performance on the network, but in overcrowded network conditions will affect the results obtained so that the selection number of RAW Group, RAW slot and MCS Index must also adjust to other parameters according to the conditions network used [18].
3.
Scenario and System Design
The simulations on this research were performed on Network Simulator 3 release 3.21 with 802.11ah module which has been modified according to [19].
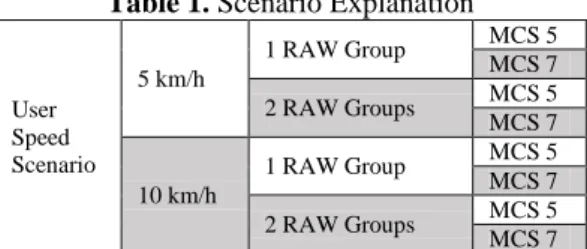
The user speed scenario aims to analyse the Doppler Effect on 802.11ah with different MCS. Simulations were performed on 100 nodes with an increase in the number of RAW stations by 10% of the total number of nodes in the simulation up to 50 nodes. On each number of station, the simulation were performed in two different RAW groups, and on each RAW group condition, the simulation were performed in two different MCS conditions as explained in table 1.
Table 1. Scenario Explanation
User Speed Scenario
5 km/h
1 RAW Group MCS 5
MCS 7
2 RAW Groups MCS 5
MCS 7
10 km/h
1 RAW Group MCS 5
MCS 7
2 RAW Groups MCS 5
MCS 7
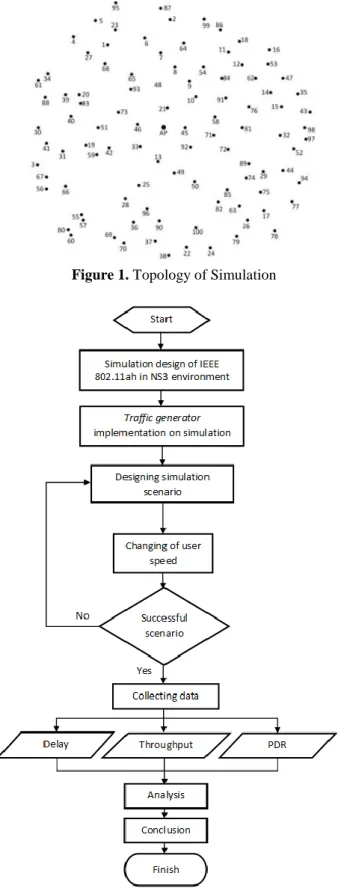
Figure 1. Topology of Simulation
Figure 2. Flowchart System
In the simulation topology, was placed one Access Point and 100 nodes of STA around it that illustrated in Fig 1. This research focuses on RAW mechanism in MAC layer of 802.11ah standard. The other features such as TIM segmentation and TwT were not implemented in the simulation.
The simulation has used the Traffic Generator as a sender as well as a receiver packets that will be delivered. Generation of traffic is done by UDP transport protocol because when
data is transmitted, data transmission time is more important than its integrity [2], it is in accordance with the needs of delivery data on IoT communications where communication in real time is necessary.
The flowchart system of this research is presented in figure 2. According to the system, after designing the simulation of 802.11ah standard in NS3 environment, traffic generator is implemented on the simulation. The user speed changing scenario of simulation is designed to collect the data. If the scenarios are succeeded, delay, throughput and PDR data can be collected to be analyzed. Thus, the Doppler Effect influence on network performance can be analyzed for the conclusion.
The output from the simulation in this research is QoS parameters which are as follows [20]:
- Average End to End Delay, which is the average time of delivering the data package from the sender to the receiver [21][22].
- Throughput, which is defined as the speed (rate) effective for transferring the data. Throughput is total number of packets received in bits divided by the number of delivery time.
- Packet Delivery Ratio (PDR), which is the ratio between the numbers of packets successfully received and the number of packets sent.
4.
Result and Evaluation
Table 2. Simulation Parameters
Parameters Value
Physical Layer WLAN/ IEEE
802.11ah
Transport Layer UDP
Payload Size 100 Bytes
Rho 100 m
Number of STA 100
Number of RAW STA 10, 20, 30, 40, 50
Number of AP 1
MCS
MCS 5 (2 MHz bandwidth and 5200
Kbps data rate) and MCS 7 (1 MHz bandwidth and 3000
Kbps data rate)
RAW Group 1 and 2
RAW Slot 1
RAW Slot duration 0.010 s
Mobility Model Random Waypoint Mobility
User Speed 5 km/h and 10 km/h
The Doppler Effect is calculated to find which of the small-scale fading are affected the user speed scenario and which MCS are affected by the Doppler Effect. Which is Delay Spread that causing signal power to be weakened and Inter-Symbol Interference (ISI), Doppler Spread that causing signal power to be weakened, and Doppler Shift that causing frequency signal wave to be changed or distorted.
The first influence of Doppler Effect is Delay Spread: Frequency Selective Fading which is about 40x10-6 s << 2x10⁻³ s or Ts << ,where symbol duration is lower than maximum excess delay and (1 MHz >> 0,1 MHz for MCS 7 and 2 MHz >> 0,1 MHz for MCS 5) or Bs >> Bc, where bandwidth of signal is higher than channel bandwidth. And the second influence of Doppler Effect is Doppler Spread: Slow Fading which for v = 5 km/h is about 40 << 42 x 103 or Ts>> Tc5 and for v = 10 km/h is about 40 << 21 x 103 or Ts>> Tc10, where symbol duration is lower than time coherence channel. And the third influence of Doppler Effect is Doppler Shift which for v = 5 km/h is about -4,261 Hz to 4,261 Hz and for v = 10 km/h is about -8,521 Hz to 8,521 Hz, where the sender frequency signal wave is distorted.
Figure 3. Delay on v = 5 km/h user speed
Figure 3. shows the influence of Doppler Effect of increasing the number of stations to the delay that obtained from simulations with MCS 5 (2 MHz bandwidth and 5200 Kbps data rate) and MCS 7 (1 MHz bandwidth and 3000 Kbps data rate) in v = 5 km/h user speed scenario. There is a fluctuation in both MCSs of both RAW groups. It’s impacted by Doppler Spread: Slow Fading causing the delay value in both MCSs of both groups to be fluctuated. From the graph above, the value of delay that obtained from MCS 7 is greater than MCS 5 in both groups with an average delay which is about 0.148878 s and 0.145219 s. In this scheme, as we can see from the result in the terms of average delay, that the MCS 5 has the lowest average delay value than MCS 7 which is about 0.046033 s and 0.047373 s.
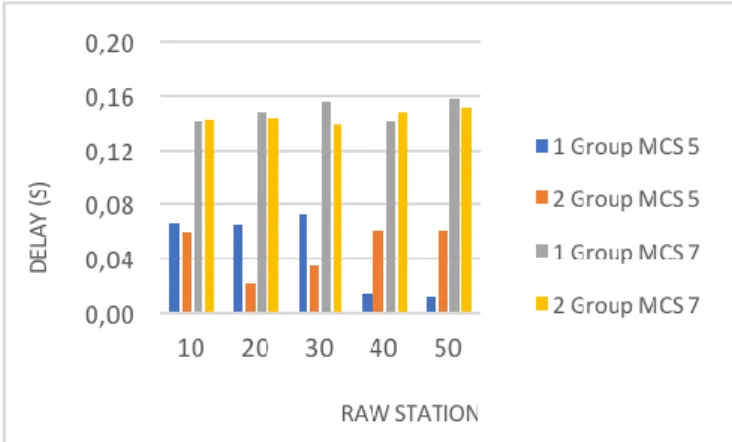
Figure 4. shows the influence of Doppler Effect of increasing the number of stations to the delay that obtained from simulations with two different MCSs in v = 10 km/h user speed scenario. There is a fluctuation in both MCSs of both RAW groups. It’s impacted by Doppler Spread: Slow Fading causing the delay value in both MCSs of both groups to be fluctuated. From the graph above, the value of delay that obtained from MCS 7 in both groups is greater than MCS 5 with an average delay which is about 0.152090 s and 0.145435 s. In this scheme, as we can see from the result in the terms of average delay, that the MCS 5 has the lowest
average delay value than the MCS 7 which is about 0.060366 s and 0.065463 s.
As we can see from figure 2 and 3, the highest average delay value is when v = 10 km/h user speed scenario in MCS 5 and 7 with RAW group = 1 and 2 which is about 0.060366 s, 0.065463 s, 0.152090 s, and 0.145435 s. It’s impacted by a Doppler Effect that causing the delay value to be higher which causes the performance to decline. This is because the influence of Doppler Effect is getting stronger with the increasing user speed which is the Doppler Spread: Slow Fading. Based on the calculation, the lower the time coherence channel, the stronger the Doppler Spread: Slow Fading. The performance is decline because Doppler Spread: Slow Fading causing the signal power to be weakened.
Figure 4. Delay on v = 10 km/h user speed
The MCS 5 with bandwidth = 2 MHz and MCS 7 with bandwidth = 1 MHz in v = 10 km/h scenario is affected by a Doppler Effect that causing the delay value to be lower which causes the performance to decline. The performance is decline because Delay Spread: Frequency Selective Fading causing the Inter-Symbol Interference (ISI) and the signal power to be weakened and because Doppler Shift causing the frequency signal wave to be changed or distorted. Based on the calculation, the higher the bandwidth, the stronger the Doppler Spread: Frequency Selective Fading and the Doppler Shift. Although, the Doppler Spread: Frequency Selective Fading and Doppler Shift is not strong enough to causing the throughput and PDR value to be lower in MCS 7 which causes the performance to decline. Resulting the Doppler Effect only affected the delay value of MCS 7 in v = 10 km/h while the Doppler Effect affected the delay, throughput, and PDR value of MCS 5 in v = 10 km/h.
Figure 6. Throughput on v = 10 km/h user speed
Figure 5. shows the influence of Doppler Effect of increasing the number of stations to the throughput that obtained from simulations with MCS 5 (2 MHz bandwidth and 5200 Kbps data rate) and MCS 7 (1 MHz bandwidth and 3000 Kbps data rate) in v = 5 km/h user speed scenario. There is a fluctuation in both MCSs of both RAW groups. It’s impacted by Doppler Spread: Slow Fading causing the throughput value in both MCSs of both groups to be fluctuated. From the graph above, the value of throughput that obtained from MCS 7 in both groups is lower than MCS 5 with an average throughput which is about 0.277280 Mbps and 0.286820 Mbps. In this scheme, as we can see from the result in the terms of average throughput, that the MCS 5 has the highest average throughput value than MCS 7 in both groups which is about 0.340952 Mbps and 0.340908 Mbps.
Figure 6. shows the influence of Doppler Effect of increasing the number of stations to the throughput that obtained from simulations with two different MCSs in v = 10 km/h user speed scenario. There is a fluctuation in both MCSs of both RAW groups. It’s impacted by Doppler Spread: Slow Fading causing the delay value in both MCSs of both groups to be fluctuated. From the graph above, the value of throughput that obtained from MCS 7 is lower than MCS 5 in both groups with an average throughput which is about 0.281842 Mbps and 0.287137 Mbps. In this scheme, as we can see from the result in the terms of average throughput, that the MCS 5 with RAW group = 1 and 2 has the highest average throughput value than MCS 7 in both groups which is about 0.333860 Mbps and 0.328120 Mbps. As we can see from figure 4 and 5, the lowest average throughput value is when v = 10 km/h user speed scenario in MCS 5 with RAW group = 1 and 2 which is about 0.333860 Mbps and 0.328120 Mbps. It’s impacted by a Doppler Effect that causing the throughput value to be lower which causes the performance to decline. This is because the influence of Doppler Effect is getting stronger with the increasing user speed which is the Doppler Spread: Slow Fading. Based on the calculation, the lower the time coherence channel, the stronger the Doppler Spread: Slow Fading. The performance is decline because Doppler Spread: Slow Fading causing the signal power to be weakened.
The MCS 7 with bandwidth = 1 MHz in v = 10 km/h scenario is not affected by a Doppler Effect that causing the throughput value to be lower which causes the performance to decline. This is because the influence of Doppler Effect is getting weaker with the decreasing bandwidth which is the Delay Spread: Frequency Selective Fading and Doppler
Shift. Based on the calculation, the higher the bandwidth, the stronger the Doppler Spread: Frequency Selective Fading and the Doppler Shift.
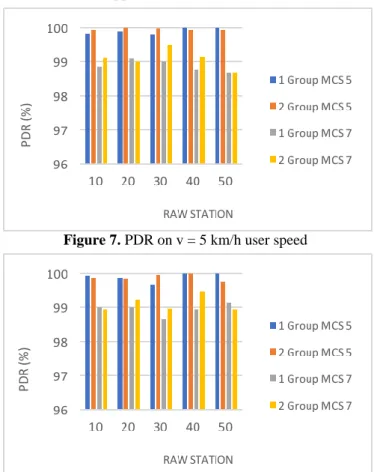
Figure 7. PDR on v = 5 km/h user speed
Figure 8. PDR on v = 10 km/h user speed
Figure 7. shows the influence of Doppler Effect of increasing the number of stations to the PDR that obtained from simulations with with MCS 5 (2 MHz bandwidth and 5200 Kbps data rate) and MCS 7 (1 MHz bandwidth and 3000 Kbps data rate) in v = 5 km/h user speed scenario. There is a fluctuation in both MCSs of both RAW groups. It’s impacted by Doppler Spread: Slow Fading causing the PDR value in both MCSs of both groups to be fluctuated. From the graph above, the value of PDR that obtained from MCS 7 is lower than MCS 5 in both groups with an average PDR which is about 98.8829 % and 99.0803 %. In this scheme, as we can see from the result in the terms of average PDR, that the MCS 5 with RAW group = 1 and 2 has the highest average PDR value than MCS 7 in both groups which is about 99.9098 % and 99.9593 %.
Figure 8. shows the influence of Doppler Effect of increasing the number of stations to the PDR that obtained from simulations with two different MCSs in v = 10 km/h user speed scenario. From the graph above, the value of PDR that obtained from MCS 7 in both groups is lower than MCS 5 with an average PDR which is about 98.9428 % and 99.1110 %. In this scheme, as we can see from the result in the terms of average PDR, that the MCS 5 has the highest average PDR value than MCS 7 which is about 99.8976 % and 99.8902 %.
Doppler Spread: Slow Fading. Based on the calculation, the lower the time coherence channel, the stronger the Doppler Spread: Slow Fading. The performance is decline because Doppler Spread: Slow Fading causing the signal power to be weakened.
The MCS 7 with bandwidth = 1 MHz is not affected by a Doppler Effect that causing the PDR value to be lower which causes the performance to decline. This is because the influence of Doppler Effect is getting weaker with the decreasing bandwidth which is the Delay Spread: Frequency Selective Fading and Doppler Shift. Based on the calculation, the higher the bandwidth, the stronger the Doppler Spread: Frequency Selective Fading and the Doppler Shift.
5.
Conclusions
In the user speed scenario, the network performance value will decrease along with the increasing user speed. This is because the higher the user speed, the stronger the influence of Doppler Effect. The worst user speed during the simulation in the scenario is the v = 10 km/h with MCS 5 and RAW group = 2 with the average delay which is about 0.65805 s, the average throughput is about 0.53811 Mbps, the average PDR is about 96.75%. Based on the MCS, the RAW group = 2 has the worst performance than the RAW group = 1 because the RAW slot duration is getting shorter with the increasing RAW group which result in some stations that cannot access the channel and collision can occur.
It can be concluded that the worst performance in the proposed scheme is v = 10 km/h while the v = 5 km/h is showing a slightly better performance. This is because the influence of Doppler Effect is getting stronger with the increasing user speed which is the Doppler Spread: Slow Fading. Based on the calculation, the lower the time coherence channel, the stronger the Doppler Spread: Slow Fading.
The use of various types of MCS in the 802.11ah standard with different bandwidth has its own influence in network performance. It can be concluded that the worst performance in the proposed scheme is MCS 7 while the MCS 5 is showing a slightly better performance. But for the influence of Doppler Effect in v = 10 km/h, the network performance of delay, throughput, and PDR in MCS 5 is lower than MCS 7. This is because the influence of Doppler Effect is getting stronger with the increasing bandwidth which is the Delay Spread: Frequency Selective Fading and Doppler Shift. Based on the calculation, the higher the bandwidth, the stronger the Doppler Spread: Frequency Selective Fading and the Doppler Shift.
References
[1] I. Khan, “Performance Analysis of 5G Cooperative-NOMA for IoT-Intermittent Communication,” Int. J. Commun. Networks Inf. Secur. 314, vol. 9, no. 3, pp. 314–322, 2017. [2] E. Aljarrah, “Deployment of multi-fuzzy model based routing
in RPL to support efficient IoT,” Int. J. Commun. Networks Inf. Secur., vol. 9, no. 3, pp. 457–465, 2017.
[3] D. Perdana, F. Dewanta, I. Prasetya, and D. Wibawa, “Extending Monitoring Area of Production Plant Using Synchronized Relay Node Message Scheduling,” Int. J. Commun. Networks Inf. Secur., vol. 9, no. 1, pp. 111–116, 2017.
[4] W. Sun, M. Choi, and S. Choi, “IEEE 802.11ah: A Long Range 802.11 WLAN at Sub 1 GHz,” J. ICT Stand., vol. 2, no. 2, pp. 83–108, 2014.
[5] O. Raeesi, J. Pirskanen, A. Hazmi, T. Levanen, and M. Valkama, “Performance evaluation of IEEE 802.11ah and its restricted access window mechanism,” in Proc. IEEE ICC Workshops, Jun. 2014, pp. 460–466.
[6] K. Rupinder and S. Gurpreet, “Survey of Various Mobility Models in VANETs,” Int. J. Eng. Comput. Sci., vol. 3, no. 3, pp. 4073–4080, 2014.
[7] R. F. S., D. Perdana, M. Nanda, R. Ode, “Performance evaluation of PUMA routing protocol for Manhattan mobility model on vehicular ad-hoc network,” 22nd Int. Conf. Telecommun. (ICT 2015), no. Ict, pp. 80–84, 2015. [8] A. Mitra. "Lecture Notes on Mobile Communication: A
Curriculum Development Cell Project Under QIP, IIT Guwahati," India, Nov. 2009.
[9] T. Report and S. Latr, “An IEEE 802.11ah simulation module for NS-3,” Affil. Univ. Antwerp, no. January, pp. 1–5, 2016. [10] L. Tian, J. Famaey, and S. Latr, “Evaluation of the IEEE 802.11ah Restricted Access Window Mechanism for dense IoT networks,” Conf. Int. Symp. a World Wireless, Mob. Multimed. Networks, vol. 17, no. May, 2016.
[11] Y. Wang, Y. Li, K. K. Chai, Y. Chen, and J. Schormans, “Energy-Aware adaptive restricted access window for IEEE 802.11ah based smart grid networks,” 2015 IEEE Int. Conf. Smart Grid Commun. SmartGridComm 2015, pp. 581–586, 2016.
[12] B. Bellekens, L. Tian, P. Boer, M. Weyn, and J. Famaey, “Outdoor IEEE 802.11ah Range Characterization,” GLOBECOM 2017 - 2017 IEEE Glob. Commun. Conf., vol. 4–8 Dec., 2017.
[13] J. Kim and I. Yeom, “QoS enhanced channel access in IEEE 802.11ah networks,” 2017 17th Int. Symp. Commun. Inf. Technol., pp. 1–6, 2017.
[14] V. Banos, M. S. Afaqui, E. Lopez, and E. Garcia, “Throughput and Range Characterization of IEEE 802.11ah,” IEEE Lat. Am. Trans., vol. 15, no. 9, pp. 1621– 1628, 2017.
[15] L. Tian and S. Latr, “An IEEE 802.11ah simulation module for NS-3,” pp. 1–5, 2016.
[16] L. Zheng, L. Cai, J. Pan, and M. Ni, “Performance analysis of grouping strategy for dense IEEE 802.11 networks,” in Proc. IEEE GLOBECOM, Dec. 2013, pp. 219–224. [17] R. M. N. Ajinegoro, D. Perdana, and R. M. Negara,
“Performance Analysis of Mobility Impact on IEEE 802.11ah Standard with Traffic Pattern Scheme,” Int. J. Commun. Networks Inf. Secur., vol. 10, no. 1, pp. 139-147, April 2018.
[18] T. Wulandari, D. Perdana, and R. M. Negara, “Node Density Performance Analysis on IEEE 802.11ah Standard for VoIP Service,” Int. J. Commun. Networks Inf. Secur., vol. 10, no. 1, pp. 79-84, April 2018.
[19] L. Tian, S. Deronne, S. Latré, and J. Famaey, “Implementation and Validation of an IEEE 802.11ah Module for ns-3,” Conf. Work. ns3 (WNS3), Seattle, USA, no. January, pp. 49–56, 2016.
[21] D. Perdana and R. F. Sari, “Performance Evaluation of Multi-channel Operation IEEE 1609.4 Based on Multi-hop Disseminatio,” Int. J. Comput. Sci. Netw. Secur., vol. 13, no. 3, pp. 42–47, 2013.