http://www.sciencepublishinggroup.com/j/ajdmkd doi: 10.11648/j.ajdmkd.20190401.11
ISSN: 2578-7810 (Print); ISSN: 2578-7837 (Online)
Multi-Agent Based Diagnostic Model for Breast Tumour
Classification
Yusuf Musa Malgwi, Gregory Maksha Wajiga, Etemi Joshua Garba
Department of Computer Science, Modibbo Adama University of Technology, Yola, Nigeria
Email address:
To cite this article:
Yusuf Musa Malgwi, Gregory Maksha Wajiga, Etemi Joshua Garba. Multi-Agent Based Diagnostic Model for Breast Tumour Classification.
American Journal of Data Mining and Knowledge Discovery. Vol. 4, No. 1, 2019, pp. 1-7. doi: 10.11648/j.ajdmkd.20190401.11 Received: February 5, 2019; Accepted: March 14, 2019; Published: April 10, 2019
Abstract:
Breast cancer is one of the most hazardous of all types of cancer affecting mainly women. It is the second leading cause of death in Nigerian women. It is difficult to classify breast tumour. The diagnosis of breast cancer on patients in hospitals and clinics is highly subjective and it is reliant on the physician’s expertise. This may often lead to incorrect diagnosis and long waiting time to diagnose breast tumour which may increase the possibility of Cancer metastasizing. This study focused on developing a multi-agent based model for diagnosis of breast tumours using the k-Nearest Neighbor (k-NN) algorithm by classifying the nature of the tumours based on their associated patterns of symptoms and other risk factors of Cancer diseases. A k-NN algorithm using Java and MYSQ was developed to extract and classify the symptoms associated with Breast Cancer. Java Agent Development Environment (JADE) was used for the modeling and simulation. The accuracy score was tested on a breast tumour clinical datasets which were gotten and formed from Federal Medical Centers (FMC) Yola and Gombe in Nigeria. The experimental result of the prediction model shows a percentage accuracy score of 98.9%.Keywords:
Breast Tumour, Multi-Agent, k-NN Algorithm1. Introduction
Cancer is defined as a class of diseases designate by uncontrollable cell growth. There are over 100 different types of cancer, and each is classified by the type of cell that is initially affected. One of the most hazardous and deadly diseases these days is the breast cancer. Breast cancer starts in cells, the building blocks that make up tissues. Tissues can be found in parts of the human body, including the breast. Usually, regular cells become old, they shrink to die, and then new cells are formed. Sometimes, this process does not follow the normal way. This unusual creation of the cells forms a mass of tissue, called a lump, tumour or growth. Tumours and cancers are not one and the same [1].
A tumour can be benign and will not develop into cancer. Cancer on the other hand is a malignant condition and the spread of abnormal cellular growth could become uncontrollable. However, when you have a tumour, it is expected you undergo a biopsy or mammography test in order to determine if the growth is malignant or benign.
Breast cancers can be diagnosed by classifying tumours. But generally, it is difficult to distinguish between tumours. Physicians need reliable diagnostic procedure to distinguish between these two tumours. When identified early, cancer is more likely to respond to effective treatment and could result in a greater probability of surviving, less morbidity, and less expensive treatment. Significant improvements could be made in the lives of cancer patients by detecting cancer early and avoiding delays in care.
Death rate due to breast cancer is very high. According to World Health Organization (WHO), breast cancer impacts over 1.5 million women each year worldwide. In 2015; 570,000 women died due to breast cancer which is approximately 15% of all death among women from cancer. In 2017 about 252,710 cases of breast cancer were diagnosed and about 610 women died in America [2].
In Nigeria and all over the world, people are suffering from long waiting times to be diagnosed of breast tumours as a result of limited medical resources and long procedures of diagnosis.
women. The increase in the occurrence of cancer is not only due to increased life expectancy, but is also related to the improvement in diagnostic technology. Breast cancer progresses slowly and, if diagnosed early, the possibility of cure or prolongation of survival is considerably increased. Delay can adversely affect prognosis, reducing the chances of cure, due to the growth of the tumour. Reducing treatment delay improves outcomes in breast cancer. Waiting to diagnose breast cancer for a long time may increase the possibility of the cancer spreading. Thus, reducing these delays is believed to be of high importance and less expensive. Doctors or medical practitioners can take prompt action to remove the malignant cells and patients can move forward with their lives.
The aim of this study is to develop a multi-agent based model for diagnosing breast tumour using the k-Nearest Neighbor (k-NN) algorithm by classifying the nature of the tumours based on their associated patterns of symptoms and other different risk factors of cancer diseases.
The objectives are to develop a fact gathering tool that captures the symptoms associated with the breast cancer disease using database management tool (Java and MYSQL). To develop a k-NN algorithm using Java and MYSQ that will extract and classify the symptoms associated with breast cancer. To develop a Multi-agent based diagnostic model using Java Agent Development Environment (JADE) for the modeling and simulation and to determine the prediction accuracy score of the using k-fold cross-validation method and a WEKA class.
In this work, the researchers intend to integrate both the features of the Data mining, Machine learning and Agent in order to implement a more efficient model that can address the challenging effects of long time waiting of diagnosis results on breast tumour.
2. Related Work
Ali and his team propose a viewpoint for breast cancer classification based on the Wisconsin diagnostic and prognostic breast Cancer datasets for feature selection, and classification using neural network approach, and especially the multi-layer perceptron and the Radial Basis Function [3]. The dataset consists of nine features that represent the input layer to the neural network. The neural network is expected to classify the input features into two classes of cancer type (benign and malignant). The proposed approach was tested on the datasets which resulted to 97% accuracy score of classification using Radial Basis Function neural network.
Also, Subhas presented a method where he classified a particular type of breast cancer based on statistical parameters of different breast Cancer’s risk factors [4]. He uses the system’s user interface to capture the detail information like gender, age, etc. from the patient. Symptom T where entered into the system and severity level X (Low, Medium and High) of the patient is presented as a result corresponding to each symptom with respect to each breast
cancer.
Individual weight value associated with the Symptoms for a Disease D corresponding to a breast cancer type is given by the equations.
SD = WTD*XT (1)
Where SD represents the severity of the disease,
WTD represents weight of symptom T in disease D and XT
represents severity of symptom T with which a patient reports.
The severity value for Low = 0.2, Medium = 0.3 and High = 0.5, etc. arbitrarily assumed in the present work.
Similarly, he calculated the individual weighted value associated with the risk factor for a disease D corresponding to a breast Cancer type using Equation the;
RD=WTD*XT (2)
Where RD represents the weight associated with the risk factor for a disease D, WT D represents weight of risk factor
T in disease D, XT represents severity of risk factor T with
which a patient Reports.
The other aspect of his work is using the k-nearest neighbor algorithm for the classification. In the process, the value of k (k is the parameter which specifies the number of Neighbours to be classify on one particular sample category) taken as input parameter of this algorithm.
i. By calculating the distance between the query-instance and all the training samples.
ii. To Sort the distance and to determine the Nearest Neighbour based on the K-th minimum distance. iii.To gather the category of the Nearest Neighbour. iv. Use a simple majority of the category of the Nearest
Neighbour as the prediction value of the query instance. The implementation is put into execution using Java language and MYSQL for the database.
In their work, Hamid and Khani introduce a comparative survey on data mining techniques in the diagnosis and prediction of breast cancer and also an analysis of the prediction of survivability rate of breast cancer patients [5]. The data used is the Surveillance, Epidemiology, and End Results Public Use Data. They have investigated three data mining techniques: Naïve Bayes, the back-propagated neural network, and the C4.5 decision tree algorithms. They used these algorithms to predict the survivability rate of Surveillance, Epidemiology, and End Results breast cancer data set. The Naïve Bayes technique relies on the famous Bayesian perspective succeeding a clear, simple and fast classifier. It has been called ‘Naïve’ due to the fact that it assumes mutually self-supporting attributes. In practice, it is almost never true but is achievable by preprocessing the data to remove the reliant categories.
performance. They used the WEKA toolkit to experiment with these three data mining classifiers.
In Htet and Khin [6], they propose a technique to breast cancer diagnosis classification. Their objective is to create a new technique that checks whether a patient has a benign or malignant breast cancer using certain indicators. In order to achieve the objective of their work, they propose a solution based on the notion of neural networks. The neural network is trained with breast cancer data by using feed forward neural network model and island differential evolution learning algorithm with momentum and variable learning rate. They tested the performance of the new model based on the Wisconsin Breast Cancer Database (WBCD). The proposed model was implemented using the island-based training method for better accuracy and less training time by using and analyzing between two different migration topologies.
Walaa propose a method to enhance the diagnosis of breast cancer by integrating an unsupervised learning method K-means with Support Vector Machine (SVM) which is a supervised learning method running on WDBC and Wisconsin Prognosis Breast Cancer Dataset (WPBC). In the proposed approach, the learning process consists of a training step and a testing step [7]. In the learning process, the SVM K-means distributes data into k equally sized partitions. The Training is applied on (k-1) folds. Then, testing is done on the remaining folds. For each fold, the process is repeated, and the average error rate is calculated to form k-fold estimate. The proposed method is assessed using two datasets for breast cancer: Wisconsin Diagnostic Breast Cancer (WDBC) dataset and Wisconsin Prognosis Breast Cancer (WPBC) all obtained from University of California Irvine (UCI) machine learning repository. The procedures were conducted using 10-fold cross validation method. The results obtained are very promising where the accuracy approaches to 100% in case of the 10-fold method using WDBC, and 98% using WPBC, respectively. This method completely removed the irrelevant attributes using feature selection method the chi square. This method was able to enhance the classification and performance by speeding the process.
Arpit and Mayur propose a method for refinement in k-means clustering algorithm [8]. The k-mean clustering algorithm is used in clustering similar types of data for prediction analysis and also the probability of most relevant functions are calculated using the Euclidian distance formula as the functions are clustered. In the intensification, two new features are added. The first step is to calculate normal distance metrics on the basis of normalization. While in the second step, the function is clustered on the basis of majority voting. A set of cancer data was used to find the results. The dataset is stuffed using MATLAB and plotted on a 2D plane according to existing K-means algorithm.
The proposed refinement in the k-Means clustering die away the two vital drawbacks of k-means clustering where the accuracy level and calculation time are devour in
clustering the dataset. These two factors accuracy level and calculation time may not matter much but when they used large datasets that have trillions of records. The extended refinement has achieved the full accuracy level up to 100%, with very little time and with more quality clusters.
Autsuo propose a robust classification algorithm for breast cancer prediction [9]. It predicts whether a patient has a benign or malignant. He uses Decision trees and Neural Networks data mining techniques tools to achieve that. Both algorithms were constructed and using training dataset to test it. Decision tree algorithms were based on constructing a tree that consists of nodes where each node reflects a test on an attribute until you reach a leaf node. In neural networks, the dataset attributes are divided into three layers these includes Input, Hidden and output layer. The first two layers were used to indicate the output layer. The two algorithms were tested using breast cancer Wisconsin dataset, and then compared to each other based on their ability to predict cancerous tumours. The algorithms were found to correctly classify more than 92% cases in the 10 experiments. However, the Neural Network algorithm had a better predictive accuracy rate on average rate of correct classification of 95.9%.
Dora and her team proposed the novel Gauss Newton Representation based Algorithm (GNRBA) for classification of breast cancer. It uses the sparse representation with feature selection and evaluates the sparsity in a computationally efficient way. The present technique proposed new gauss Newton based classifier to find optimal weights for training samples for classification. The present techniques are tested with Wisconsin breast cancer database and Wisconsin Diagnosis breast cancer database from the UCI machine learning repository. The result shows that the present technique provides better accuracy, sensitivity, specificity, confusion matrices compare to traditional approaches [10].
3. Proposed Model
In this study, the researchers have proposed a multi-agent platform in a distributed data mining system for diagnosing breast tumours with the aid of k-NN algorithm. The researchers introduced three agents. They are the medical practitioner agent, classifier agent and the database agent where each agent performs its own task under the coordination of the medical practitioner agent; the medical practitioner agent enables the user to input his or her symptoms/risk factors in order for the classifier agent to classify the tumour. The classify agent is responsible for classifying the symptoms presented by the medical practitioner agent into either malignant or benign using the data mining and k-NN algorithm techniques. The database agent stores and retrieves the information presented to it by the medical practitioner agent.
Purposive and convenience sampling techniques were used to select FMC Yola and FMC Gombe in Nigeria as study area (s). All the patients from May, 2018 to May, 2013 formed the sample size of 2,048 from the hospitals (962 from FMC, Yola and 1086 from FMC Gombe). The sources of data were Medical Records from Medical Record Departments, Histopathology Department, and Oncology Department and Patient folders.
3.1. Analysis Phase
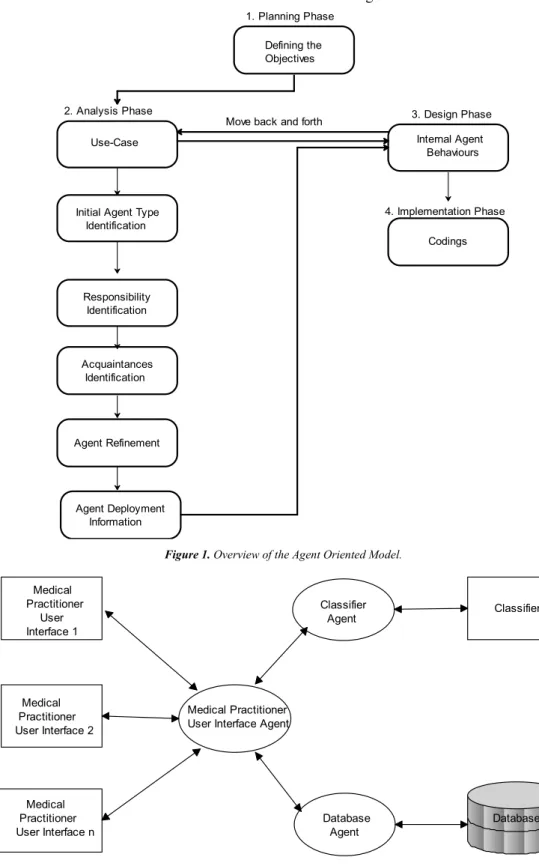
During the analysis phase, the acting entities of the problem domain are identified and modeled as agents. Agents and their actions (or behavior) are refined and specified at the design phase. Finally, at the implementation phase, agents are programmed with the aid of a multi-agent development environment (JADE). Overview of the model is shown in Figure 1.
Figure 1. Overview of the Agent Oriented Model.
Figure 2. The model of the MAS. Initial Agent Type
Identification
Responsibility Identification
Acquaintances Identification
Agent Refinement
Agent Deployment Information
1. Planning Phase
2. Analysis Phase
Move back and forth 3. Design Phase
4. Implementation Phase Defining the
Objectives
Use-Case Internal Agent
Behaviours
Codings
Database Medical
Practitioner User Interface 1
Medical Practitioner User Interface 2
Medical Practitioner User Interface n
Medical Practitioner User Interface Agent
Classifier Agent
Database Agent
3.2. The Design Phase
The design phase is aimed at specifying the solution. Carrying out the design phase allows us to reach a level of detail that is sufficient enough to have a relatively straight forward transition to the implementation-with the possibility of a significant amount of code being generated. However, the design phase considers the internal agent behaviors.
Use cases are an effective way to capture the potential functional requirements of a new system. Each use case presents one or more scenarios that demonstrate how the system should interact with the end-user or another system to achieve a specific goal.
3.3. Data Collection and Preparation
For this study, the data was collected from 3rd May, 2018 to 24th July, 2018 at FMC Yola and Gombe. These dataset consist of 2,127 instances including 79 records with missing values, Noise and inconsistent data from 11 attributes.
3.4. The k-NN Model
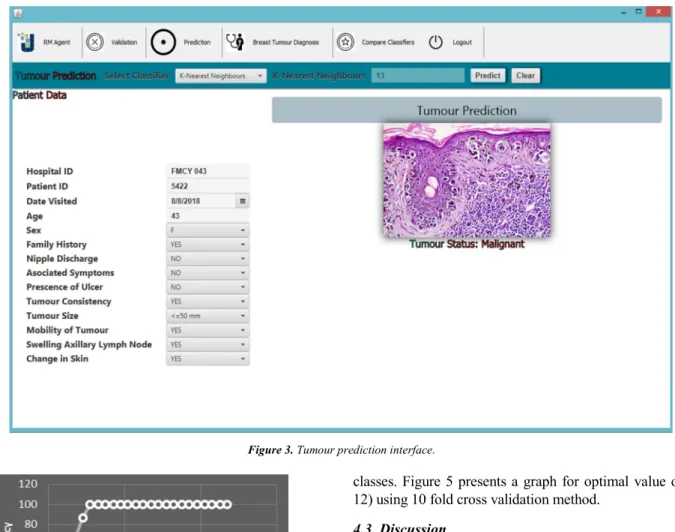
The work is designed to classify a particular type of tumour based on statistical parameters of different cancer’s symptoms and risk factors. The proposed model includes providing the details information of patients such as symptoms and risk factor that she/he is suffering from and other necessary information like age, sex, family history, nipple discharge, change in skin, associated symptoms, presence of ulcer, consistency of the tumour, size of the tumour, mobility of the tumour and axillary lymph node given by the medical practitioners through the system’s user interface.
Symptoms T were entered into the system and the class X (Malignant and Benign) of the patient is presented as a result corresponding to each symptom with respect to each breast tumour. Individual weight value associated with the symptom for a tumour disease D (SD) corresponding to a breast tumour
type is given by the equations.
SD = WTD*XT (3)
Where WTD represents weight of symptom T in disease D,
XT represents class of symptom T with which a patient
reports. The next stage involves the classification using the k -nearest neighbor algorithm. In this process, the value of K (The parameter k specifies the number of neighbor to classify one particular sample category) taken as input parameter of this algorithm.
i. Calculate the distance between the query-instance and all the training samples
ii. Sort the distance and determine the Nearest Neighbour based on the K-th minimum distance.
iii.Gather the category of the Nearest Neighbour.
iv. Use simple majority of the category of the Nearest Neighbour as the prediction value of the query instance. v. Use Java language and MYSQL for the database in the
implementation.
3.5. Pseudo-code Showing an Illustration for k-NN Model
Procedure k-NN-Learner (TestingDataSet) for each testing instance {
find the k most nearest instances of the training set according to a
distance metric (Euclidean distance) Resulting Class = most frequent class label of the k nearest instances }
3.6. Assumptions in k-NN
k-NN presumes that the data is in a feature space and the data points are in a metric space. The training data are vectors in a multidimensional feature space; each is represented with a class label. The training phase of the algorithm is made up only to store the feature vectors and class of the training samples.
While in the classification phase, k is a user-defined constant, and an unlabeled vector (a query or test point) is classified by assigning the label which is most frequent among the k training samples nearest to that query point. Usually Euclidean distance is used as the distance metric.
3.7. Parameter Selection
The best choice of k depends upon the data; generally, larger values of k reduce the effect of noise on the classification, but make boundaries between classes less distinct. A good k can be selected by various heuristic techniques, for example, cross-validation. The special case where the class is predicted to be the class of the closest training sample (i.e. when k = 1) is called the nearest neighbor (NN) algorithm.
4. Implementation, Results and
Discussion
4.1. Implementation
The implementation is based on the JADE platform. JADE is a middle-ware (written entirely in the Java language, which simplifies the implementation of multi-agent systems by providing a set of graphical tools that support the debugging and deployment phases. The agent platform can be distributed across multiple machines, regardless of the underlying operating system, and the configuration controlled via a remote graphical user interface (GUI).
Figure 3. Tumour prediction interface.
Figure 4. The optimal value of k using 10 folds crosses validation.
4.2. Results
The experimental result and the accuracy score were tested with a breast tumour clinical datasets which were gotten and formed from FMCs Yola and Gombe. The attributes are selected based on the opinions of expert (Medical Practitioners) in the hospitals.
The breast tumour clinical record dataset was used to distinguish malignant (cancerous) from benign (non-cancerous samples). The dataset has a total of 2,048 rows and 11 columns indicating the attributes. Classes from the Waikato Environment for Knowledge Analysis (WEKA) version 3.7.13 were used to analyze clinical datasets and evaluate the performance of the predictive data mining.
To ascertain the percentage accuracy of the model, the model was tested using 10-fold cross validation method, the model however achieved a higher optimal value of k when the value of k = 12 (which is the nearest neighbor) with 100% accuracy score. Generally, a larger value of k reduces the effect of noise on the classifier and makes boundaries between
classes. Figure 5 presents a graph for optimal value of k (i.e. 12) using 10 fold cross validation method.
4.3. Discussion
Table 1. Confusion Matrix for the binary Classifier.
N=1,022 Predicted: No Predicted: Yes
Actual: No 33 03
Actual: Yes 08 978
Analysis from Table 1,
i. Two possible predicted classes exist: "Yes” meaning they have the disease “and "No" means they don't have the disease.
ii. A total of 1,022 predictions were made by the classifier. The totals of 1,022 patients were tested for the presence of that disease.
iii. Out of the total number of 1,022 cases, the classifier predicted 988 times for “Yes” and 34 times for "No". iv. Actually, 986 patients in the sample have the disease,
while 36 patients do not.
The researchers define the most basic terms as whole numbers:
True positives (TP): This a case in which “Yes” is predicted (they have the disease) and actually they have the disease.
True negatives (TN): Predicted “No” and truly they don't have the disease.
False positives (FP): Predicted “Yes”, but truly they don't have the disease. (Also known as a "Type I error.")
Table 2. Row and Column totals of the Confusion Matrix.
N=1,022 Predicted: No Predicted: Yes Total
Actual: No TN = 33 FP = 03 36
Actual: Yes FN = 08 TP = 978 986
Total 41 981
Computational rates from a confusion matrix: i. Accuracy: How regular is the classifier correct?
(TP+TN)/total = (978+33)/1,022 = 0.9892
ii. Misclassification (Error) Rate: How regular is it wrong? (FP+FN)/total = (33+08)/1,022 = 0.0401 (Equivalent to 1 minus Accuracy)
iii.True Positive Rate (Sensitivity): When it is truly “Yes”, how regular does it predict “Yes”? TP/actual yes = 978/986 = 0.9919
iv. False Positive Rate: When it is truly “No”, how regular does it predict “Yes”? FP/Actual No = 03/36 = 0.08333 v. Specificity: When it is truly “No”, how regular does it
predict “No”?
TN/Actual No = 33/36 = 0.9167 (equivalent to 1 minus False Positive Rate)
vi. Precision: When it predicts “Yes”, how regular is it correct?
TP/Predicted yes = 978/981 = 0.9969
vii.Prevalence: How regular does the “Yes” condition truly occur in the sample? Actual yes/total = 986/1,022 = 0.9648.
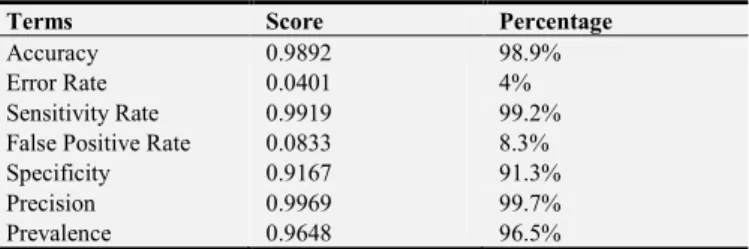
Table 3. Terms totals of the Confusion Matrix.
Terms Score Percentage
Accuracy 0.9892 98.9%
Error Rate 0.0401 4%
Sensitivity Rate 0.9919 99.2%
False Positive Rate 0.0833 8.3%
Specificity 0.9167 91.3%
Precision 0.9969 99.7%
Prevalence 0.9648 96.5%
The percentage accuracy score of the model is estimated at 98.9% which is an indication of a reliability of the system.
5. Conclusion
Based on the result presented, the diagnostic system has 98.9% accuracy score while the misclassification rate is 0.04 (4%), Sensitivity rate is 0.99 (9.9%), False Positive rate is 0.083 (8.3%), Specificity 0.917 (91.7%), Precision rate is 0.997 (99.7%) and Prevalence rate is 0.965 (96.5%) which by implication means that the system can be used as an aid that can be adopted by Hospitals and clinics for diagnosis of breast tumour.
As future work, significant advances have been made in some areas of breast cancer research resulting in improvements in diagnosis over the last few decades, other areas have not benefited to the same degree and the researchers continue to have many gaps in knowledge. This study can be enhanced and expanded to the diagnosis of other
different kind of cancer such as Brain Cancer, Skin Cancer, and Prostrate Cancer etc.
References
[1] Ponraj, N., Jenifer, E., Poongodi, P. & Manoharan, S. (2012)."Morphological operations for the mammogram image to increase the contrast for the efficient detection of breast cancer", (European Journal of Scientific Research), (ISSN) 1450-216X (68) NO.4 (2012). PP.494-505.
[2] Siegel, R. L., Miller, K. D & Jemal, A. (2017). (A Cancer Journal for Clinicians). Am Cancer Society 67: 7-30. H. Poor,
An Introduction to Signal Detection and Estimation. New York: Springer-Verlag, 1985, ch. 4.
[3] Ali, R., Ali, K. & Mohammad, A. (2012). Breast cancer classification using Neural Network approach, the 13th International Arab Conference on Information Technology, ISSN 1812-0857, PP.15-19.C. J. Kaufman, Rocky Mountain Research Lab., Boulder, CO, private communication, May 1995.
[4] Subhas, H. (2013). An Approach to diagnosis of cancer using k-Nearest Neighbour algorithm. A thesis submitted in partial fulfillment of the requirements for the master of computer science and engineering to the department of computer science and engineering, Jadavpur University Kolata. [5] Hamid, K. & Khani, Z. (2015). A comparative survey on data
mining techniques for breast cancer diagnosis and prediction. (Indian Journal of Fundamental and Applied Life Sciences), Vol.5 (S1), pp. 4330-4339. E. H. Miller, “A note on reflector arrays (Periodical style—Accepted for publication),”
Engineering Letters, to be published.
[6] Htet, T. & Khin, M. (2015). An approach for Cancer Diagnosis Classification using neural network. Advance Computing: An international Journal (ACIJ), Vol.6, No. 1, PP. 1-11.N. Meghanathan and G. W. Skelton, “Risk Notification Message Dissemination Protocol for Energy Efficient Broadcast in Vehicular Ad hoc Networks,” IAENG International Journal of Computer Science, vol. 37, no. 1, pp. 1–10, Jul. 2010.
[7] Walaa, G. (2016). SVM-K-means: Support Vector Machine based on K-means clustering for Cancer Diagnosis. (International Journal of Computer and Information Technology) (ISSN: 2279 - 0764) Volume 05 – Issue 02, 252-257.
[8] Arpit, B. & Mayur, S. (2017)."Improved k-mean clustering algorithm for prediction analysis using classification technique in data mining", International Journal of Computer Applications. Vol. 157, No 6, pp. 35 – 40.
[9] Autsuo, H. (2018). Diagnosis of breast cancer using decision tree and artificial neural network algorithms. (International Journal of Computer Applications Technology and Research). Volume 7–Issue 01, pp. 23-27.