Wideband Code Division Multiple
Access (W–CDMA) Tutorial
Definition
Wideband code division multiple access (W–CDMA) is a CDMA channel that is four times wider than the current channels that are typically used in 2G networks in North America.
Overview
In January 1998, European Telecommunications Standards Institute (ETSI) decided to choose the W–CDMA technology to be the multiple access techniques for the third- generation mobile telephone system. For a mobile communication system, a key parameter is the system capacity. A number of methods to increase system capacity in a W–CDMA network are discussed. This tutorial presents results from different antenna pattern parameters and sectorization techniques for optimizing the maximum number of active subscribers.
Topics
1. Cell Site Loading2. Three-Sector Cell Site Configurations 3. Six-Sector Cell Site Configurations
4. Capacity Limitations Due to Orthogonality and Antenna Performance Self- Test
Correct Answers Glossary
Web ProForum Tutorials
http://www.iec.org The International Engineering Consortium Copyright © 2/12
1. Cell Site Loading
Given the limit on spectrum resources, efficient optimization techniques are needed for realizing cost-efficient ways to maximize the capacity in a W–CDMA network. The capacity is essentially interference limited by the overall
interference level in the coverage area of each site. A computer simulation for investigating the system capacity was performed that modeled the radio channel in an urban environment. The simulator included many of the CDMA
characteristics such as power control and different parameter setting in the hand over algorithm. Given this simulation, antenna characteristics such as sector orientation, number of sectors per site, horizontal beamwidth, and front-to-back ratio were studied. Also studied was the influence of the radio environment, giving rise to different orthogonality factors.
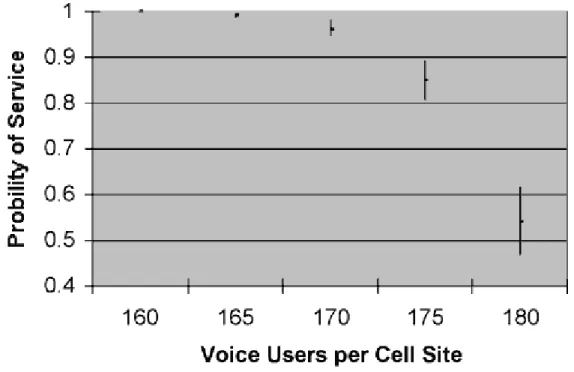
The signal-to-interference ratio typically limits the probability of having service in a dense cell site. As we can see from Figure 1, the roll off of service probability for voice traffic is quite quick—from 160 to 180 users per cell site in a typical three-sector configuration compared to about 90 users for omni site
configurations. The error bars in the following figures annotate plus or minus one standard deviation about the mean value obtained from the numerical
simulations. The numerically obtained results using a set of network statistics for a typical urban setting are shown in Figure 1.
Figure 1. Cell Site Loading in a Three-Sector Network Configuration
Web ProForum Tutorials
http://www.iec.org The International Engineering Consortium Copyright © 3/12
2. Three-Sector Cell Site Configurations
With the given set of simulation conditions, the practical number of users per W– CDMA channel is between 170 and 175. Depending on the antenna
characteristics, the number of actual users that can talk on a given sector face will change.
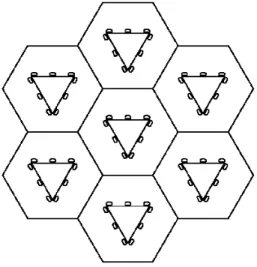
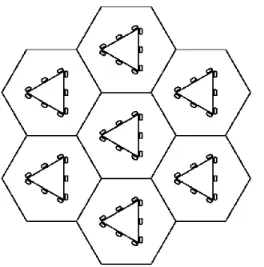
The typical shape for cell site footprints is a hexagonal shape. For such a shape, the typical number of sectors per cell is one, three, or six. When using three or six sectors, there are two standard orientations. These orientations and shapes are demonstrated for three sector cell site configurations in Figure 2 and Figure 3.
Web ProForum Tutorials
http://www.iec.org The International Engineering Consortium Copyright © 4/12
Figure 3. Typical Three-Sector Cell Site Configuration Rotated by 30 Degrees
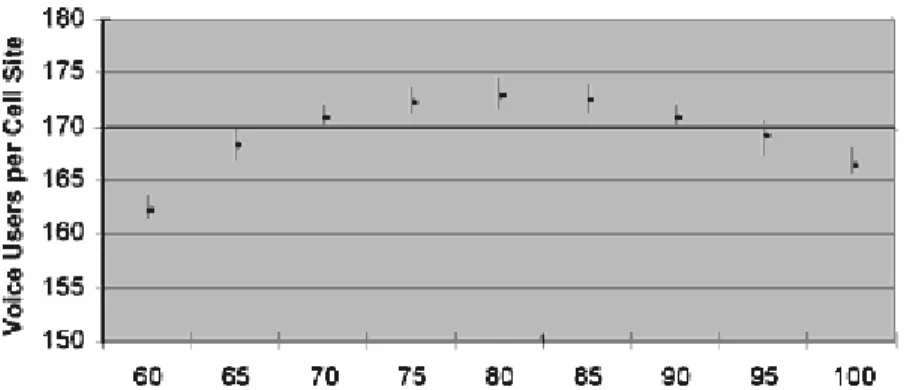
Using these two different types of three-sector cell site configurations, the optimum horizontal half power beamwidth is predicted. The results for the configuration depicted in Figure 2 are presented in Figure 4, and the results for the configuration depicted in Figure 3 are presented in Figure 5.
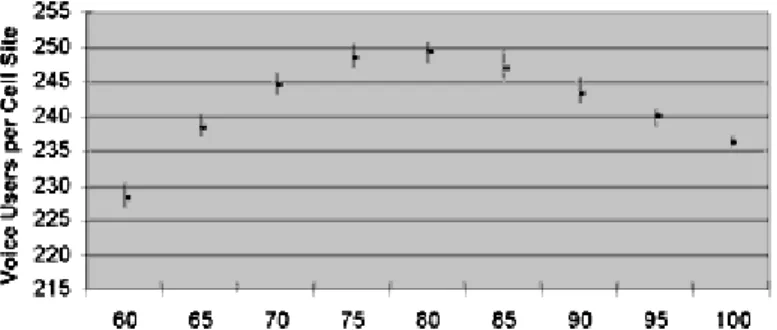
Figure 4. Capacity Predictions for a Typical Three-Sector Cell Site Configuration
Web ProForum Tutorials
http://www.iec.org The International Engineering Consortium Copyright © 5/12
Figure 5. Capacity Predictions for a Typical Three-Sector Cell Site Configuration Rotated by 30 Degrees
The results presented above show that the optimal beamwidth for the configurations demonstrated in Figure 2 and Figure 3 is 65 and 80 degrees respectively.
3. Six-Sector Cell Site Configurations
To further increase the capacity at each cell site with out increasing the number of W–CDMA carriers, a common practice is to increase the number of sector faces at the desired cell sites. A common six-sector configuration is illustratively demonstrated in Figure 6.
Figure 6. Typical Six-Sector Cell Site Configuration
Using the six-sector site configuration shown in Figure 6, the anticipated
Web ProForum Tutorials
http://www.iec.org The International Engineering Consortium Copyright © 6/12
Figure 7. Capacity Predictions for a Typical Six-Sector Cell Site Configuration
The results presented above show that the optimal beamwidth for the configurations demonstrated in Figure 6 is 40 degrees.
As demonstrated in the previous figures, the rotational orientation of the sites and the number of sectors per site require different beamwidth antennas for optimal capacity performance. The choice of the proper antenna beamwidth is a compromise between the interference in the network by having antennas with too broad a beamwidth and the coverage holes induced by having antennas with too narrow a beamwidth. For all the capacity predictions, the overhead for the pilot was assumed to be 5 percent, and the number of sectors involved in a soft handoff was limited to three.
4. Capacity Limitations Due To
Orthogonality and Antenna Performance
The capacity of the W–CDMA network is also limited to the amount of self-induced interference by the mobiles using the same sector face. This self-self-induced interference is the disruption of the orthogonality of the codes by the multipath in the wireless network. Although the fingers in the rake receiver will provide some additional diversity in a high multipath environment, the multipath is
detrimental to the orthogonality of the W–CDMA channel. For the previous results, an orthogonality factor of 0.4 is used. A study of maximum orthogonality and no orthogonality in relation to antenna beamwidth can be seen in Figure 8 and Figure 9.
Web ProForum Tutorials
http://www.iec.org The International Engineering Consortium Copyright © 7/12
Figure 8. Capacity Predictions for a Typical Three-Sector Cell Site Configuration Rotated by 30 Degrees with a Maximum Level of Orthogonality
Figure 9. Capacity Predictions for a Typical Three-Sector Cell Site Configuration Rotated by 30 Degrees with No Measurable Amount of Orthogonality
Here, the optimal beamwidth of the antenna is quite invariant to the level of orthogonality in the network. Over the complete range of orthogonality, the optimal beamwidth varies from 75 to 80 degrees.
The previous two figures show that the orthogonality of the W–CDMA channel significantly impacts the network capacity. Another contributor to the
degradation of the W–CDMA channel is the radiation from the antennas in the backward direction. All of the results presented previously are for antennas with a front-to-side ratio of 30 dB. If the radiation from the base station antenna is increased in the backward direction in the form of a single back lobe, the
degradation of the capacity can be studied. The results of this numerical study are shown in Figure 10. The different lines are for the back-lobe beamwidths 60, 30, and 10 degrees.
Web ProForum Tutorials
http://www.iec.org The International Engineering Consortium Copyright © 8/12
Figure 10. Capacity Predictions for a Typical Three-Sector Cell Site Configuration Rotated by 30 Degrees for Different Back-Lobe Beamwidths
The results in Figure 10 show that as the total energy in the backward directed lobe is increased by either increasing the beamwidth of the back lobe or by decreasing its front-to-back ratio, the capacity of the W–CDMA network diminishes. In general, the capacity of the W–CDMA network can be made optimized by choosing antennas that have the proper beamwidth for the given environment and cell site configuration.
Self-Test
1. The _____________ is essentially interference limited by the overall interference level in the coverage area of each site.
a. network b. beamwidth c. capacity
2. The signal-to-interference ratio typically limits the probability of having service in a dense cell site.
a. true b. false
3. The typical shape for cell site footprints is a __________ shape. a. square
Web ProForum Tutorials
http://www.iec.org The International Engineering Consortium Copyright © 9/12
c. rectangular d. hexagonal
4. To further increase the capacity at each cell site without increasing the number of W–CDMA carriers, a common practice is to increase the number of sector faces at the desired cell sites.
a. true b. false
5. The rotational orientation of the sites and the number of sectors per site require ______________ beamwidth antennas for optimal capacity performance.
a. the same b. different c. no
6. The capacity of the W–CDMA network is not affected by the amount of self-induced interference by the mobiles using the same sector face.
a. true b. false
7. _____________is the disruption of the orthogonality of the codes by the multipath in the wireless network.
a. Antenna performance b. Echo
c. Environment-induced interference
8. Although the fingers in the rake receiver will provide some additional diversity in a high multipath environment, the multipath is detrimental to the
orthogonality of the W–CDMA channel. a. true
Web ProForum Tutorials
http://www.iec.org The International Engineering Consortium Copyright © 10/12
9. The radiation from the antennas in the backward direction benefits the W– CDMA channel.
a. true b. false
10. In general, the capacity of the W–CDMA network can be made optimized by choosing antennas that have the proper beamwidth for the given environment and cell site configuration.
a. true b. false
Correct Answers
1. The _____________ is essentially interference limited by the overall interference level in the coverage area of each site.
a. network b. beamwidth
c. capacity
2. The signal-to-interference ratio typically limits the probability of having service in a dense cell site.
a. true
b. false
3. The typical shape for cell site footprints is a __________ shape. a. square
b. circular c. rectangular
Web ProForum Tutorials
http://www.iec.org The International Engineering Consortium Copyright © 11/12
4. To further increase the capacity at each cell site without increasing the number of W–CDMA carriers, a common practice is to increase the number of sector faces at the desired cell sites.
a. true
b. false
5. The rotational orientation of the sites and the number of sectors per site require ______________ beamwidth antennas for optimal capacity performance.
a. the same
b. different
c. no
6. The capacity of the W–CDMA network is not affected by the amount of self-induced interference by the mobiles using the same sector face.
a. true
b. false
7. _____________is the disruption of the orthogonality of the codes by the multipath in the wireless network.
a. Antenna performance b. Echo
c. Environment-induced interference
8. Although the fingers in the rake receiver will provide some additional diversity in a high multipath environment, the multipath is detrimental to the
orthogonality of the W–CDMA channel.
a. true
b. false
9. The radiation from the antennas in the backward direction benefits the W– CDMA channel.
a. true
Web ProForum Tutorials
http://www.iec.org The International Engineering Consortium Copyright © 12/12
10. In general, the capacity of the W–CDMA network can be made optimized by choosing antennas that have the proper beamwidth for the given environment and cell site configuration.
a. true
b. false
Glossary
CDMAcode division multiple access
ETSI
European Telecommunications Standards Institute
W–CDMA