http://www.jscdss.com Vol.3 No.2 April 2016: 26-34 Article history:
Accepted 2 February 2016 Published online 2 February 2016
Journal of Soft Computing and Decision
Support Systems
Automatic Test Data Generation Based on Hierarchical Model
Faeghe Sayyari a, Sima Emadi b,*a
Department of Computer Engineering, Yazd Science and Research Branch, Islamic Azad University, Yazd, Iran b
Department of Computer Engineering, Yazd Branch, Islamic Azad University, Yazd, Iran
* Corresponding author email address: [email protected]
Abstract
The main discussion on software development is software testing with real data. Software testing is one of the expensive and time consuming processes and many studies have been conducted to facilitate and perform it automatically. One of the most important topics in software testing is developing the test path to general test data and coverage of the generated path. Generation the data for test includes identifying a complex of data which evaluate the test criterion. Optimization methods can be used to solve the problem of data testing. Heuristic search methods especially evolutionary algorithms are cost savings and can be effective in the automated generation of Test data. One of the most important challenges in the development of data tests is lack of full coverage of defined Ranges and ignoring the important parameters of user. In this study, a solution is proposed based on Hierarchical model and ant colony optimization algorithm and model-based testing to faster generation test input data and inserted to the program. Then, the test data will be provided and exported for further studies by using generation data and parallel running ant colony algorithm. The model in this study is based on Markov chain. The results obtained from Markov chain are good choices for studying the viability of the testing process while developing them. Evaluation of the proposed algorithm has shown better performance compared to existing methods in terms of cost, coverage, time and parameters of user.
Keywords: Ant colony optimization algorithms, Hierarchical model, Path-cover generation, Model-based testing, Test data generation
1. Introduction
In order to assess the quality of software, it is necessary to examine software precisely to discover and solve their defects and problems; before they actually used. Developing test data for the generation of input data is very difficult and time consuming manually, so automated generation is used. Automated software testing could significantly reduce the costs of software development. Other benefits of this work are possibility to design more advanced tests and performing tests faster and more accurately even remotely (Collins et al., 2012; Nănău, 2010).
One of the methods of automated testing is test-based model which can make automated all kinds of tests such as unit testing, system testing and acceptance and provide better test coverage. The purpose of model-based testing is increasing reliability and reducing costs of software through automation of testing samples of official behavior in the system model.
Markov chain is a good choice for statistical model based testing and its main characteristics examine the feasibility of developed testing stages. In mathematical terms, transition from one state to the other is occurred in Markov chain; of course number of the States is countable. Markov chain is a stochastic process without memory means that the conditional probability distribution of the next State depends
only on its current State and it is not related to the previous events.
Statistical model based testing in Markov chains uses Markov chains to develop software model which is proposed in and is a very efficient way to model the software under test.
In recent years, many efforts have been done to apply some optimization techniques based on search in the field of software testing. At first in 2003, ant colony optimization was used in the field of software testing and ant colony optimization approach and Markov model were described to carry out a series of test paths in a software system (Suwannasart et al., 2008). Another study presented an approach based on ant colony optimization to examine the software based on control flow by developing the test sequence (Srivastava and Rai, 2009). A simple algorithm was provided by ant colony optimization to help to define the optimal test path using the update feature by ant pheromones ( study, ant colony optimization algorithm was used on data flow test that the algorithm is applied to generate sets of test data to cover the set of generated paths (Ghiduk, 2010). Experiment results in this paper show that this method works better in term of the number of test method, performance and percent of coverage compared to other related methods.
Recently, in (Shah et al., 2012) a method of non-repetitive transmitting mode based on ant colony
optimization algorithm was presented. In this study, white-box testing method based on ant colony optimization algorithm was compared to existing black-box testing and the result showed that the path cover at ant colony optimization algorithm is higher. Currently, ant colony optimization is widely used in automated testing manufacturing technology (Srivastava et al., 2013).
Due to high competition in the generated offered to the market, software organizations need to produce high-quality software. Hence, complete test coverage and reduce costs is essential and obligatory. In the proposed methodology (combining ant colony optimization algorithm and model-based testing methods) test cases are designed and software are implemented and improved in various iteration and enter into a separate step to speed up the generation of program code by designed model with automated code technique before writing program code; so changes can be applied easily to software at any time of development. The ultimate goal is to increase coverage and reduce costs, risks and challenges of software testing.
The article structure is as follows: In the second section the foundations of the proposed method and algorithm of generation of optimal path testing and Test data is provided; in the third section the evaluation of proposed model and the case study is presented and in the fourth section, conclusions of this study are presented. Also, some strategies are provided in the study.
2. The proposed algorithm
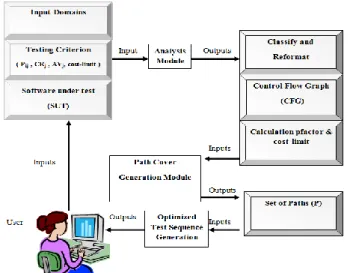
Test data due to permanent changes in the software development process must be produced with a minimum cost and full coverage. Considering these issues, the proposed algorithm is provided according to Fig. 1 by combining ant colony optimization algorithm and model-based testing.
Fig. 1. The block diagram of the proposed technigue
2.1algorithm of path coverage generation
Following algorithm is used in the modules to provide the path to create a set of paths that cover all defined communications in the software under test.
In this algorithm, all nodes based on the maximum amount of p-factor and minimum transport cost is replaced and generate a path that is necessary to measure the cover in all defined nodes. The proposed algorithm has the ability to add other parameters of user and according to these parameters, the optimal path be can extracted of algorithm.
Algorithm for ant t:
Step 0: for each node do steps from 1 through 3 0.1 Select DU: select uncovered yet node to be covered 0.2 Set start and end node
Step 1: Initialize all parameter
1.1 Set heuristic Value (η): for every branch in the CFG initialize heuristic value η =2
1.2 Set pheromone level (τ): for every branch in the CFG initialize pheromone value τ =1
1.3 Set visited status (Vs): for every node in the CFG Vs=0 1.4 Set Probability level (L): for each branch in the CFG initialize probability L=0
1.5 Set α=1, and β= 1, These parameters are associated with 1.6 Set count: count = cc cyclometic complexity
1.7. Set key: key = end _node
Step 2: Repeat the following steps while count > 0 2.1. Initialize: start=i, sum=0, visit=0.
2.2. if (Vs[i] ==0) then Vs[i] =1 And visit =visit+1
2.3 Evaluate Feasible Set: If there is no feasible path then go to step 3.
2.4 calculate probability:
∑
2.5 calculate p-factor: P-factorj = Pij + CRj + AVj
2.6. Move to next node: Using the below rule move to next node R1: Select paths (i→j) with maximum Lij and p-factor
R2: If two or more paths (i→j and i→k) have equal probability level like (Lij = Pik) then select path according to below rule: R2.1. Select path with maximum p-factor
R2.2.If (feasible set entry==end _node) then select end_ node as the next node otherwise follow R2.2
R2.3. Select that path which have next node not visited yet (Visited status Vs =0). If two or more nodes have same visited status Vs[j] =Vs[k] and same p-factor then select randomly 2.7. Update the parameter:
2.7.1 Update Pheromone: (τij)= (τij)α + (ηij)–β 2.7.2 Update Heuristic: ηij = 2*(ηij) 2.7.3 Calculate Strength:
sum = sum + τij. strength [count] = sum. start = next_node.
2.7.4 Calculate p-factor value for next node 2.8. if (start! = end_node) then go to step 2.3 else
if (visit==0) then discard the path it is the redundant path otherwise add new path
2.9. count =count-1
2.10 If (start! = end_node) and COUNT=0 then exit algorithm Step 3: Complete the generated path
Counter variable shows the cyclic complexity of this method and in this algorithm the amount is 100. When the counter reaches zero indicates that all decision nodes have been passed.
The algorithm automatically stops at one of the following conditions:
i. There is no any node.
ii. Reaches to the cost or p-factor or the allowed nodes.
2.2 Test-data generation algorithm
The test-data generation module uses the following algorithm to generate set of test data to satisfy the set of paths in the path cover. The algorithm easily traverses all the nodes and derives the required set of data.
Step 1: Build the model
1.1 Build a hierarchical model as in Fig. 4.
1.2 Determining the proper range with the software which is in the process of testing in different layers.
1.3 Dividing the layers into various layers, based on p-factor path. 1.4 Ants are being placed in the first node of Hierarchical model. Step 2: Moving Ants
2.1 By ants movement between the nodes, Record the number of node.
2.2 movements between each layer, export a random number. 2.3 If the next node is not the final node, goto step 2-1 2.4Record the path.
2.5 export the test data based on the number of layers. 2.6 Run the program by using the resulted data and record the path.
2.7 calculating the similarity between the running path and the path based on users situation.
2.8 Update pheromone. 2.9 record the test data
2.10 output the set of test data and the set of covered paths
Algorithm will stop automatically if reached the final node, or the highest node of estimated situation by the user
3. Evaluation of the proposed algorithm
To ensure the proper functioning of the proposed algorithms, these algorithms are evaluated by phone model to observe output analysis of algorithms, improvement of efficiency, paths cover, data of generated test and the minimum amount of cost.
In addition to reviewing the results of the proposed algorithm, it is necessary to compare the results with the similar method which previously evaluated and verified.
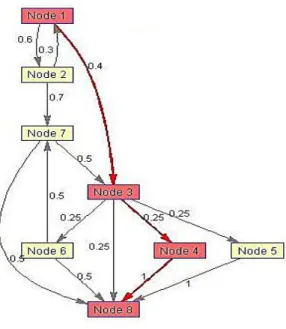
In this model, stages of phone communication for a control flow graph are shown in Fig. 2 that is used to explain the proposed algorithm.
The model consists of set of nodes V which consists of {ON HOOK}, {RINGING}, {OFF HOOK}, {BUSY
TONE}, {ERROR TONE}, {RING TONE},
{CONNECTED}, {EXIT}.
The exit State is essentially a sink i.e. there are no outgoing transitions from it. The set of transitions or edges as in this case are as follows:
{{ON HOOK},{RINGING}}, {{ON HOOK}, {OFF HOOK}},{{RINGING},{ON HOOK}}, {{RINGING},{RINGING}},
{{OFF HOOK},{BUSY TONE}}, {{OFF HOOK},{ERROR TONE}}, {{OFF HOOK},{RING TONE}}, {{RING TONE},{CONNECTED}}, {{CONNECTED},{OFF HOOK}}, {{RINGING},{CONNECTED}},
{{OFF HOOK},{EXIT}}, {{BUSY TONE},{EXIT}}, {{ERROR TONE},{EXIT}},{{RINGTONE},{EXIT}},
{{CONNECTED},{EXIT}}
Fig. 2. A model for a telephone(Ghosh et al., 2010)
For convenience, the names of the States are replaced by some symptoms which is shown in Fig. 2. Lij the probability of passing from node i to j is shown Table 1. If there is not such a passing, the value is zero. Now, the proposed algorithm is being implemented on this graph using Ant colony optimization to achieve the stages of the test. The amount of pheromones for all edges is 1 initially.
{ }
Suppose that = 1 and = 1. ij factor shows ants tend to go from node i to node j. putting ij = Lij in the functional model would be appropriate.
Table 1
Transitional probabilities and stimuli
Probability of transition Transitional stimuli State name (to) State name (from) 0.6 Incoming 2 1 0.3 Disconnect 1 2 0.4 Lift Receiver 3 1 0.25 Hang Up 8 3 0.25 Dial Busy 4 3 0.25 Dial Bad 5 3 0.25 Dial Good 6 3 0.5 Connect 7 6 0.7 Lift Receiver 7 2 0.5 Disconnect 3 7 1.0 Hang Up 8 4 1.0 Hang Up 8 5 0.5 Hang Up 8 6 0.5 Hang Up 8 7
Apart from the use of probability derived from Eq. (2) (Ghosh et al., 2010), there are other factors that affect the decision of ant to move in next stage and these factors should be considered.
{ ( ) } ∑ ( ) Two factors that are used for next movement are the importance of CR and the average number of visits per node (AVi). Important factor values (CRj) is given in Table 2.
Table 2 Criticality value
Node (State) Criticality
1 9.0
2 8.0
3 10.0
4 30.0
5 26.0
6 27.0
7 45.0
8 0.0
The average number of visits is obtained by Eq. (3) (Ghosh et al., 2010) and is shown in Table 3.
∑ For example, calculating the average number of visits for State 2 is:
AV1 = 1.0
AV2 = (AV1 x P12) = 1.0 x 0.6 = 0.6
The next factor is factor P (P-Factor). P-factor shows each State of j when the ant is in node i (Ghosh et al., 2010).
{ }
Table 3
Average number of visit
Average visits Node (State) 1.0 1 0.6 2 0.635 3 0.1 4 0.1 5 0.1 6 0.47 7 0.0 8
Pij is the probability obtained from the relation 2, CRj is important factor, and AVij is the average number of visits.
Now, the cost should be considered. There are no limits on the cost and is considered as cost limit in the testing process; It is assumed that the cost of testing or each edge is identified shown by Cij that {i, j} now for each stage of the test, the test cost is:
∑ For set the i = 1, 2, 3 ... n, the growing cost is as following:
√ To ensure that financial constraints are considered, ensure that the growing cost is in the range of cost limit.
4. experimental results and reviews
The Ant According to Fig. 2 starts from an initial State 1. A chromatic path is chosen (Ant colony optimization at this stage is not intended to prevent any discrimination in the branches of the graph at the beginning.) then go to the State 3. So, the status of current stage is 13. In stage 3, the ant should estimate all p-factors in three which are accessible by one movement. So this Modes are 4, 5, 6 and 8 respectively, p-factor of these States is obtained using the following Eq. (4).
P-factor4 = P34 + CR4 + AV4 = 30.138
P34 = {(1.0)1 x (0.25)2} /6.5 = 0.3824 By putting these values in Eq (2) we have:
CR4 = 30.0
P-factor5 = P35 + CR5 + AV5 = 26.138
P-factor6 = P36 + CR6 + AV6 = 27.138
P-factor8= P38 + CR8 + AV8 = 0.0384
Which means the ant chooses State 4 with maximum amount of p-factor to pass next. Testing process up to here is 134. In Mode 4, the only possible way is {4 and 8}, so, the ultimate stages of test is as shown in Fig. 4, 1348.
Table 4 shows the output of different levels of cost limit. Each output shows important covered States, cost and p-factor of the traveled path.
Fig. 4. Ant select path
In Table 4, the value of pfactor of all node is shown based on the node which is directly related to.
Table 4
The value of node p-factor
node 1 2 3 4 5 6 7 8
1 0 9.2 11.035 0 0 0 0 0
2 10.3 0 0 0 0 0 46.17 0
3 0 0 0 30.35 26.35 27.35 0 0.25002
4 0 0 0 0 0 0 0 1.00002
5 0 0 0 0 0 0 0 1.00002
6 0 0 0 0 0 0 45.97 0.50002
7 0 0 11.135 0 0 0 0 0.50002
Table 5
Outputs different values about cost
Calculation path cost Calculation path
p-factor Path coverage
0.65 11.285
138
1.65 42.385
1348
1.65 38.385
1358
1.8 55.87
1278
2.05 66.755
12738
2.55 94.355
127368
3.05 93.855
12758
Table 5 shows the output of different levels of cost limit by Eq. (5) and Eq. (6). Each output shows important covered States, cost and p-factor of the traveled path.
To ensure that even in most stringent financial constraints, the important States are covered, the following test stages are obtained when cost- limit = 20.0:
123, 138, 1358, 1348
According to the Output, it could be concluded that after a certain ceiling of cost limit no change is occurred in output and regarding financial limits is not necessary. Optimized set of test stages (full coverage) are obtained in a certain ceiling. Similarly trend is also in counting of important covering nodes. Relative Value of cost limit has reverse relationship with the test stages.
1.1 Data Test generation Algorithm
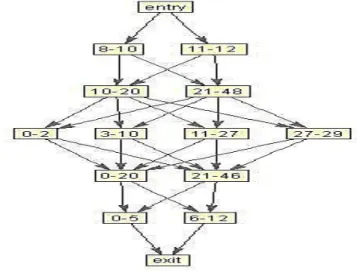
In order to create ants test data, the movement should be started from the entrance node of search model in Fig. 4 and provide the test data.
In this case study, the entrance rang of each variable of telephone model is placed in 048 range and each range in each layer is divided into smaller ranges.
In previous researches, the numerical range of hierarchy model had been randomly chosen and the layers are being divided into the same size pieces. But in the proposed technique, the entrance range is chosen based on the maximum and minimum p-factor and the available paths in each layer are chosen.
Fig. 5.Search hierarchical model for cell phone applications
Fig. 6.Search hierarchical model for cell phone applications
The search begins by the ants being located on the entrance node of hierarchical model. The ant select one node randomly from each layer until the ant gets to the end node, as it is seen in the Fig. 7. Now imagine that the information would be like 2, 35, 7, 42 and 9, so the program which is being tested is run based on these data and the path which is being run is recorded. The proceeded path is as 14 – 13 – 11 – 6 – 5 – 2 – 1. Then the value of the formula will be updated and the above strategy will be repeated in order to create the data which are needed for test in order to cover the path.
Fig. 7. The generation of test data
In Table 6, the generate data in each layer shows the telephone hierarchical search model.
Table 6
Generation data from the search model
Output Layers
1 2 3 4 5
1 18 15 4 30
2 24 0 10 11
2 35 12 10 3
2 39 0 12 1
2 42 26 12 4
2 41 0 8 2
1 11 4 8 11
1 43 25 11 9
2 23 18 9 12
2 44 9 12 4
Generation data in hierarchical model with defined ranges is being used in ant colony algorithm. According to programs under the tests, the process of the program is being founded by codes. Then the ant colony considers the exported data from last step in order to select the next step in ants movement which paths are being exported based on these data at the end. According to the users input data and exported paths from previous level based on the cost and p-factor parameters which are clear, proceeds to exporting data which are considered by the user.
4.2 comparing the proposed algorithm with other methods
methods and a more complete coverage of the test is provided.
Table 7
Compare current algorithms with proposed algorithm
reference method
Parameters evaluated Proposed
algorithm
(Ghosh et al.,2010) ant colony
algorithm Data-Flow
Testing Pheromone.
Test Path generation
(Ahmed and Ghiduk,2010) ant colony
algorithm Markov chains Pheromone.
P-factor Test Path
generation
Proposed algorithm ant colony
algorithm Data-Flow
Testing Markov chains
model based testing Pheromone.
P-factor cost user parameters Test Path
generation
Ant colony optimization is used to construct the stages of model-based testing; but this method does not consider the importance of the process or not produce the stages of optimized test (Li and Lam, 2004). A Comparative study was done to compare the results obtained from the proposed method and the method described previously (Li and Lam, 2004). This method is chosen for comparison with the proposed method. according to our research, this method is the only way that a test based on ant colony optimization model is consistent; this comparative study is based on the number of nodes and edges with is covered by the same number of surveys. n stage test is considered here is obtained by the n number of the first survey model, because more coverage with fewer stages of testing is arguably more cost savings and this is a more efficient method. In the phone models, the most important States are 7, 4, 5 and 6. There are 14 edges (pass) and 8 nodes (State) in our model. When the number of test is 4, the set of test stages is defined in the following way:
Existing technique
1368
1358
1348
138
Number of nodes covered = 6 (3 out of 4 most critical)
Number of edges covered = 8
Percentage of node coverage = (6/8) x 100 = 75
Percentage of edge coverage = (8/14) x 100 = 57.14
Proposed technique
1358
127348
1348
127368
Number of nodes covered = 8 (all the 4 most critical)
Number of edges covered = 10
Percentage of node coverage = (8/8) x 100 = 100
Percentage of edge coverage = (10/14) x 100 = 71.42
Fig. 8. Number of nodws covered with 4 test sequences
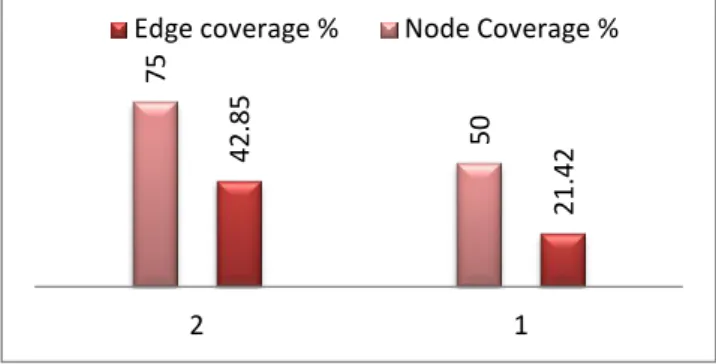
When the number of test sequences is 2, the set of test sequences obtained is as follows:
Existing technique
1348
138
Number of nodes covered = 4 (1 out of 4 most critical)
Number of edges covered = 3
Percentage of node coverage = (4/8) x 100 = 50
Percentage of edge coverage = (3/14) x 100 = 21.42
Proposed technique
127348
1348
Number of nodes covered = 6 (2 out of 4 most critical)
Number of edges covered = 6
Percentage of node coverage = (6/8) x 100 = 75
Percentage of edge coverage = (6/14) x 100 = 42.85
57.14
71.42 75
100
1 2
Fig. 9. Number of nodws covered with 2 test sequences
Fig. 8 and Fig. 9 show a graph describing the results obtained above when the number of test sequences is 4 and 2.
It is clear that the proposed method not only gives better coverage but also ensures coverage of more important States. Doerner and Gutjahr (Gutjahr et al., 2003) used Ant colony optimization to create a model based on Markov chain; but on the techniques described (Gutjahr et al., 2003) does not consider the importance of each State. Techniques proposed in this study clearly uses the importance and the value (the average number of visits) to judge the importance of each case. Better coverage of important nodes is provided especially when cost limit are very strict. In such a situation, fewer test stages are created with cost limit, but test is optimized and this is our wish results!
5. Conclusions
According to the development of software and high volume of manufacturing software, test is of great importance due to rapid changes in software and testing cost per change is high. In this study using a model-based testing, software is considered as a small modules and ant colony optimization algorithm and Markov chain are used by generation test paths and By using a Hierarchical model of created test data and limiting the generation of path and test data with p-factor and cost complete coverage of the test is provided and the cost of test is reduced.
In proposed algorithm has been shown to generate an optimal set of the test data, combination of model-based testing and ant colony algorithm in software data flow testing is effective. The proposed method also proved to be able to pass on those priorities is given to the node. Even with stringent cost limit, it was observed that the important States have been covered. It was approved that Ant colony optimization algorithm can be effective in generation of testing stages, especially in models based on the graph; at the end of the limit in the proposed algorithms, the parameters of cost and p-factor with pheromones in great software with similar States is effective to choose nodes with the same highly effective visibility and efficient. The complexity of the algorithm is for ne passing O (n2) and shows efficiency and low computational load.
The proposed method can be useful for program managers in improving software quality in the limited time
and resources. Of course, this method should also be checked to use in larger programs.
In line with this research, in the future character and Boolean intervals can be used for generation testing paths. This method can be used as object-oriented programs by complementing and modifying more. Future Work and research can be included multiple passing possibilities between nodes.
References
Collins, E., Dias-Neto, A., & de Lucena, V. F. (2012, July). Strategies for agile software testing automation: An industrial experience. In Computer Software and Applications Conference Workshops (COMPSACW), 2012 IEEE 36th Annual (pp. 440-445). IEEE.
Doerner, K., & Gutjahr, W. J. (2003, July). Extracting test sequences from a Markov software usage model by ACO. In Genetic and Evolutionary Computation—GECCO 2003 (pp. 2465-2476). Springer Berlin Heidelberg.
Doungsa-ard, C., Dahal, K., Hossain, A., & Suwannasart, T. (2008). GA-based automatic test data generation for UML state diagrams with parallel paths. In Advanced Design and Manufacture to Gain a Competitive Edge (pp. 147-15) Ghiduk, A. S. (2010). A new software data-flow testing approach
via ant colony algorithms. Universal Journal of Computer science and engineering Technology, 1(1), 64-72.
Li, H., & Lam, C. P. (2004). Software Test Data Generation using Ant Colony Optimization. In International Conference on Computational Intelligence (pp. 1-4).
Nănău, C. Ş. (2010). Automated Test Generation And Agile Methodologies. Bulletin of the Transilvania University of Brasov, Series III: Mathematics, Informatics, Physics, 3(52). Singh, S., Kaur, A., Sharma, K., & Srivastava, S. (2013).
Software testing strategies and current issues in embedded software systems. International Journal of Scientific & Engineering Research, 3(4), 1342-1357.
Srivastava, P. R., & Rai, V. K. (2009). An ant colony optimization approach to test sequence generation for control flow based software testing. In Information Systems, Technology and Management (pp. 345-346). Springer Berlin Heidelberg. Srivastava, P. R., Baby, K. M., & Raghurama, G. (2009,
January). An approach of optimal path generation using ant colony optimization. In TENCON 2009-2009 IEEE Region 10 Conference (pp. 1-6). IEEE.
Srivastava, P. R., Jose, N., Barade, S., & Ghosh, D. (2010). Optimized test sequence generation from usage models using ant colony optimization. International Journal of Software Engineering & Applications, 2(2), 14-28.
Srivastava, P. R., Naruka, S. S., Alam, A., Agarwal, N., & Shah, V. M. (2012). Software coverage analysis: black box approach using ANT system. International Journal of Applied Evolutionary Computation (IJAEC), 3(3), 62-77.
21.42
42.85 50
75
1 2