Dr. Sapna Page 506 A STUDY OF BURNOUT AMONG UNIVERSITY TEACHERS IN RELATION TO THEIR
PERSONALITY Dr. Sapna
Assistant Professor, Tirupati College of Education, Ratia
Abstract
One of the banes of modern stressful life style is the occurrence of burnout syndrome among the educated people. Most of the educated people, who opt to be a teacher, cope with the heavy demands of the professional obligations and may suffer from the burnout syndrome sooner than later. Because of this malady, one becomes indifferent and listless towards one’s profession and consequently happens to grow larger pathological apathy towards one’s profession. This study attempts to pinpoint the factors, which contribute to the high rate of burnout among teachers of Universities. Burnout amongst teachers does not affect themselves alone but their students as well. Teacher’s burnout has become an area of interest among researchers and practitioners in many fields during the past decade. The researchers have investigated personality, source of stress, burnout, organizational behaviour and emotional intelligence of the educators who appear to be experiencing burnout to a greater degree than their colleagues. Research findings have indicated the gaps in findings. Keeping in view these gaps in mind, the present study has been designed to understand more systematically, the complex and multifaceted nature of burnout and its relationship with personality,
Introduction
"A teacher can never truly teach unless he is still learning himself. A lamp can never light another light unless it continues to burn its own."
Dr. Rabindra Nath Tagore
In the above line Dr. Rabindra Nath Tagore has described the role of teacher in teaching profession which formally takes place in university. The kind and quality of overall atmosphere of working place is an index of the nature of work, that prevails there. In educational institutions, a healthy environment is all the more very important for an effective process of education to take place. The teacher is the top most academic and professional person in the educational pyramid under whose charge, the destiny of our
children is placed by the parents and society. The success of any educational system depends much on the requisite qualities of a teacher. Teaching is very demanding job. Unlike many profession success in teaching is hard to measure and varies by individual. Further, teachers are often expected to fulfil many roles and teachers have many pressures on them and these overloads lead them to burnout.
Review of the Related Literature
Pruaner (2005) investigated a very interesting study on teacher burnout, locus of control and early morning free control level in teachers. The evaluation of the parameters revealed the close correlation between the number of bodily complaints, locus of control and degree of burnout found in the teachers. The result revealed that unmarried, untrained but having few ever years of teaching experience has a high level of burnout. Moreover teaching experience bring stress more.
Malik (2005) explored the relationship of burnout among nurses with personality, organizational commitment and emotional intelligence.
Duggal (2006) investigated the sample of 300 female school teacher from government, private and public school of Chandigarh and Punjab and tested then on the Maslach Burnout Inventory (MBI) and found that teacher belongs to rural areas showed significant difference on the three dimensions of burnout when compared with teachers belonging to urban areas.
Salami (2011) investigated the relationship of job stress, personality and social support to burnout among college of education lecturers.
Burnout
Dr. Sapna Page 507 overwhelmed, emotionally drained, and unable
to meet constant demands. Personality
Personality refers to individual differences in characteristic patterns of thinking, feeling and behaving. The study of personality focuses on two broad areas: One understands individual
differences in particular personality
characteristics, such as sociability or irritability. The other understands how the various parts of a person come together as a whole. Personality is a set of individual differences that are affected by the socio-cultural development of an individual: values, attitudes, personal memories, social relationships, habits and skills.
Definitions of Related Variables
Burnout: Burnout is a state of mental, physical and emotional exhaustion that often results from a combination of very high expectation and persistent situational stress. It may reflect in a continued dissatisfaction with the situation, ranging from mild bordom to severe depression, irritation, exhaustion and physical ailment. The expression of too much pressure and too few sources of satisfaction can develop in to feeling of exhaustion leading to burnout. Personality: Personality is a complex concept and to define, it is very difficult task. Psychologically speaking personality is all that a person is, it is the totality of one's behaviour towards oneself and other as well.
Objectives of the Study
The main objective of the present study is to examine the relationship between the burnout with personality among the university teachers in Haryana. To achieve the main objective, sub-objectives are framed in the study as follows:
To study the burnout and personality of university teachers with reference to their gender.
To compare the burnout of university teachers with reference to their gender.
To compare the personality of university teachers with reference to their gender.
To analyze the relationship between the burnout variable and personality among the university teachers in Haryana. Hypotheses of the Study
There is no significant difference of burnout of university teachers with reference to their gender.
There is no significant difference of personality of university teachers with reference to their gender.
There is no significant relationship between the burnout variable and personality among the university teachers in Haryana.
Delimitations of the Study
The study has been limited to present university in Haryana only.
The study has limited to the use of only ten psychological variables viz. eight of burnout, two of personality.
The study has been limited to only 350 university teachers from university present in Haryana were taken in final analysis and comparison.
Research Method
In the present study under descriptive survey methods universities survey were done to know about burnout and personality of university teachers in Haryana state. For this purpose five universities of Haryana state i.e. Guru
Jambheshwar University Science and
Technology, Hisar, Kurukshetra University, Kurukshtera, Maharishi Dayanand University, Rohtak, Bhagat Phool Singh Mahila Vishvavidhalya, Khanpur, Chaudhary Devi Lal University, Sirsa are selected.
Population and Sample
All the government university teachers of Haryana state are included in the population of the study. In present study, a random sampling technique is used for selection the sample. A sample of 400 university teachers from various universities of Haryana State is selected in this
study. These universities are Guru
Jambheshwar University of Science and Technology, Hisar, Kurukshetra University, Kurukshtera, Maharishi Dayanada University, Rohtak, Bhagat Phool Singh Mahila Vishvavidhalya, Khanpur and Chaudhary Devi Lal University, Sirsa. But from 400 questionnaires, 350 questionnaires are selected because 50 questionnaires are rejected due to inadequate data. And from 350 respondents there were 182 male respondents and 168 female respondents.
Tools Used
Following tools are applied in this study A) Burnout Inventory by Dr. Karuna Shankar
Dr. Sapna Page 508 B) Maudsley Personality Inventory (MPI) by
Dr. S.S. Jalota and S.D. Kapoor Data analysis
Demographic Profile of Respondents The following section explains the demographic profile of the respondents of the present study .
Table 1: Gender Groups of Respondents
Gender groups Frequency Per cent
Male 182 52.0
Female 168 48.0
Total 350 100.0
Source: Survey
Table 1 shows the gender profile of the respondents of the study. Majority of respondents i.e. 52 per cent are males and remaining respondent are females i.e. 48 per cent in the study.
Burnout of University Teachers with Reference to their Gender.
There is no significant difference of burnout of university teachers with reference to their gender.
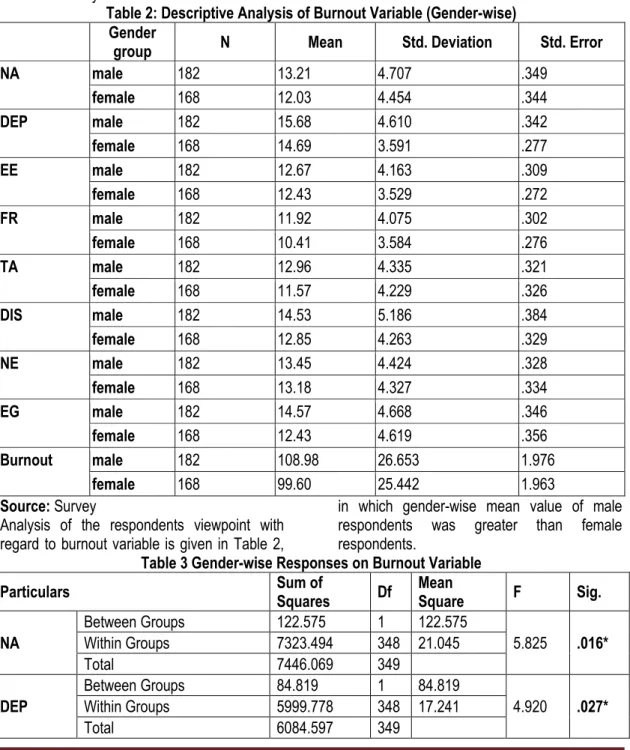
Table 2: Descriptive Analysis of Burnout Variable (Gender-wise) Gender
group N Mean Std. Deviation Std. Error
NA male 182 13.21 4.707 .349
female 168 12.03 4.454 .344
DEP male 182 15.68 4.610 .342
female 168 14.69 3.591 .277
EE male 182 12.67 4.163 .309
female 168 12.43 3.529 .272
FR male 182 11.92 4.075 .302
female 168 10.41 3.584 .276
TA male 182 12.96 4.335 .321
female 168 11.57 4.229 .326
DIS male 182 14.53 5.186 .384
female 168 12.85 4.263 .329
NE male 182 13.45 4.424 .328
female 168 13.18 4.327 .334
EG male 182 14.57 4.668 .346
female 168 12.43 4.619 .356
Burnout male 182 108.98 26.653 1.976
female 168 99.60 25.442 1.963
Source: Survey
Analysis of the respondents viewpoint with regard to burnout variable is given in Table 2,
in which gender-wise mean value of male respondents was greater than female respondents.
Table 3 Gender-wise Responses on Burnout Variable
Particulars Sum of Squares Df Mean Square F Sig.
NA
Between Groups 122.575 1 122.575
5.825 .016*
Within Groups 7323.494 348 21.045
Total 7446.069 349
DEP
Between Groups 84.819 1 84.819
4.920 .027*
Within Groups 5999.778 348 17.241
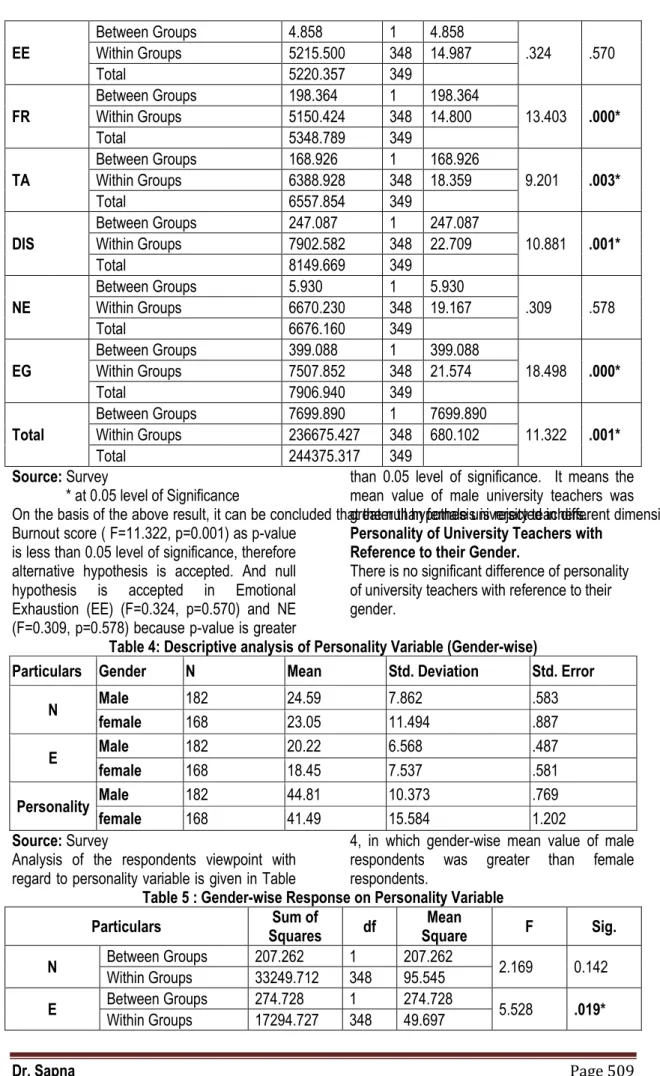
Dr. Sapna Page 509 EE
Between Groups 4.858 1 4.858
.324 .570
Within Groups 5215.500 348 14.987
Total 5220.357 349
FR
Between Groups 198.364 1 198.364
13.403 .000*
Within Groups 5150.424 348 14.800
Total 5348.789 349
TA
Between Groups 168.926 1 168.926
9.201 .003*
Within Groups 6388.928 348 18.359
Total 6557.854 349
DIS
Between Groups 247.087 1 247.087
10.881 .001*
Within Groups 7902.582 348 22.709
Total 8149.669 349
NE
Between Groups 5.930 1 5.930
.309 .578
Within Groups 6670.230 348 19.167
Total 6676.160 349
EG
Between Groups 399.088 1 399.088
18.498 .000*
Within Groups 7507.852 348 21.574
Total 7906.940 349
Total
Between Groups 7699.890 1 7699.890
11.322 .001*
Within Groups 236675.427 348 680.102
Total 244375.317 349
Source: Survey
* at 0.05 level of Significance
On the basis of the above result, it can be concluded that the null hypothesis is rejected in different dimensions of burnout variable i.e. Non-accomplishment NA (F=5.825, p=0.016), Depersonalization (DEP) (F=4.920, p=0.027), Friction (FR) (F= 13.403, p=0.000), Task avoidance (TA) (F= 9.201, p=0.003), Distancing (DIS) (F=10.881, p=0.001), Easy going (EG) (F=18.498, p= 0.000), and total Burnout score ( F=11.322, p=0.001) as p-value
is less than 0.05 level of significance, therefore alternative hypothesis is accepted. And null hypothesis is accepted in Emotional Exhaustion (EE) (F=0.324, p=0.570) and NE (F=0.309, p=0.578) because p-value is greater
than 0.05 level of significance. It means the mean value of male university teachers was greater than female university teachers. Personality of University Teachers with Reference to their Gender.
There is no significant difference of personality of university teachers with reference to their gender.
Table 4: Descriptive analysis of Personality Variable (Gender-wise)
Particulars Gender N Mean Std. Deviation Std. Error
N Male 182 24.59 7.862 .583
female 168 23.05 11.494 .887
E Male 182 20.22 6.568 .487
female 168 18.45 7.537 .581
Personality Male 182 44.81 10.373 .769
female 168 41.49 15.584 1.202
Source: Survey
Analysis of the respondents viewpoint with regard to personality variable is given in Table
4, in which gender-wise mean value of male respondents was greater than female respondents.
Table 5 : Gender-wise Response on Personality Variable
Particulars Squares Sum of df Square Mean F Sig.
N Between Groups 207.262 1 207.262 2.169 0.142
Within Groups 33249.712 348 95.545
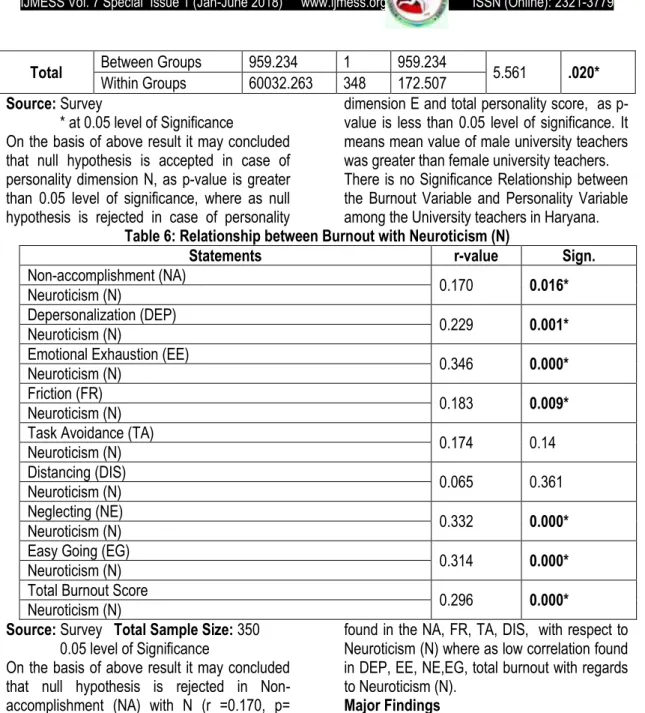
Dr. Sapna Page 510 Total Between Groups Within Groups 959.234 60032.263 1 348 959.234 172.507 5.561 .020* Source: Survey
* at 0.05 level of Significance
On the basis of above result it may concluded that null hypothesis is accepted in case of personality dimension N, as p-value is greater than 0.05 level of significance, where as null hypothesis is rejected in case of personality
dimension E and total personality score, as p-value is less than 0.05 level of significance. It means mean value of male university teachers was greater than female university teachers. There is no Significance Relationship between the Burnout Variable and Personality Variable among the University teachers in Haryana. Table 6: Relationship between Burnout with Neuroticism (N)
Statements r-value Sign.
Non-accomplishment (NA) 0.170
0.016* Neuroticism (N)
Depersonalization (DEP) 0.229
0.001* Neuroticism (N)
Emotional Exhaustion (EE) 0.346
0.000* Neuroticism (N)
Friction (FR) 0.183 0.009*
Neuroticism (N)
Task Avoidance (TA) 0.174 0.14
Neuroticism (N)
Distancing (DIS) 0.065 0.361
Neuroticism (N)
Neglecting (NE) 0.332
0.000* Neuroticism (N)
Easy Going (EG) 0.314
0.000* Neuroticism (N)
Total Burnout Score 0.296 0.000*
Neuroticism (N)
Source: Survey Total Sample Size: 350 0.05 level of Significance
On the basis of above result it may concluded that null hypothesis is rejected in Non-accomplishment (NA) with N (r =0.170, p= 0.016), Depersonalization (DEP) with N (r =0.229, p=0.001), Emotional Exhaustion (EE) with N (r =0.346, p= 0.000), Friction (FR) with N (r =0.183, p=0.009), Neglecting (NE) with N (r =0.332, p=0.000), Easy going (EG) with N (r=0.314, p=0.000) and total burnout score with N (r = 0.296, p=0.000) because the p-value is less than 0.05 level of significance, therefore alternative hypothesis is accepted. And null hypothesis is accepted in Task avoidance (TA) with N (r =0.174, p=0.14) and Distancing (DIS) with N (r =0.065, p=0.361), as p-value is greater than 0.05 level of significance. Further, the value of coefficient of correlation i.e. r- value in the table 4.29, shows that there is positive correlation in the different dimensions of the burnout with Neuroticism (N), dimension of personality. On the basis of above, it may conclude that there is negligible correlation
found in the NA, FR, TA, DIS, with respect to Neuroticism (N) where as low correlation found in DEP, EE, NE,EG, total burnout with regards to Neuroticism (N).
Major Findings
Section A: Demographic Profile of Respondents
The present section discusses the major findings of the demographic profile of the respondents of the study as follows:
Majority of the respondents are males in comparison to females in the study. Section B: Burnout of University Teachers
with Reference to their Gender.
The following section explains the gender-wise association of the Burnout variable.
Analysis of the respondents viewpoint with regard to burnout variable, in which gender-wise ANOVA result show that there is significant association (at 0.05 level of significance) in different dimension
of burnout variable i.e.
Dr. Sapna Page 511 (DEP), Friction (FR), Task avoidance (TA),
Distancing (DIS), Easy going (EG), and total Burnout score. It means the mean value of male university teachers was greater than female university teachers where as insignificant association in Emotional Exhaustion (EE) and Neglecting (NE).
Section C : Personality of University Teachers with Reference to their Gender
The following section explains the gender-wise association of the personality variable.
Gender-wise response of the respondents toward personality variable, it is noticed that there is significant association in dimension of personality variable i.e. Extraversion (E) and total personality score. It means mean value of male university teachers was greater than
female university teachers. While
insignificant association in dimension of personality variable i.e. Neuroticism (N) and total personality score.
Section D: Relationship among the Burnout with Personality
The following section explain the relationship among the Burnout dimensions such as Non-accomplishment, Depersonalization, Emotional
Exhaustion, Friction, Task Avoidance,
Distancing, Neglecting, Easy Going and total Burnout score with Personality variable.
The relationship between the burnout dimensions such as NA, DEP, EE, FR, TA, DIS, NE, EG and total Burnout score with Neuroticism (N), dimension of personality of the respondents of the study is consider, it is found that there is significant
difference in NA with N, DEP with N, EE with N, FR with N, NE with N, EG with N and total burnout score with N where as insignificant difference found in the TA with N and DIS with N. Further, the value of coefficient of correlation i.e. r- value, show that there is positive correlation in the different dimensions of the burnout with Neuroticism (N), dimension of personality. References
Eysenk, H.J Mannual of the Maudslay personality ventor. London; university of London press, 2005. Gerits, L.; Derkson, Jan J.L., Verbruggen, A.B. and Katzko, M. (2005). Emotional intelligence profiles of nurses caring for people with severe behaviour problems. Personality and Individual
Differences, 38 (1), 33-43.
Iimori, M., (2008). Relationship of nurse burnout with personality,
characteristics and coping behaviours. Industrial Health, 46,
326-335.
Kumara, M. (2002). A study of burnout among high school female teachers in relation to their personality, occupational stress, and self-related cognitions, Unpublished Thesis, K.U.K. Lennort, S. Littorin, P. (2005). Relationship of emotional intelligence, personality, and work performance. Scandiavian
Journal of organizational Theory and Practice, 21-37.
Malik, A. (2005). A study of burnout among nurses in relation to personality, organizational commitment, and emotional intelligence. Unpublished, M.A. Dissertation, K.U.K.
Miner, M.H. (2007). Burnout in the first year of ministry: Personality and belief style as important predictors. Mental
Health, Religion and Culture, 10(1), 17-29
Norman, W.T. (1963). Toward an adequate taxonomy of personality attributes: Replicated factor structure in peer nomination personality ratings. Journal of Abnormal and Social
Psychology. 66, 574-583. Online available at:
http://www.ncbi.nlm.nih.gov/pmc/articles/PMC2794272/ Perkins, A.M. and Corr, P.J. (2006). Cognitive ability as a buffer to newroticism: Charchiell’s secret weapon? Personality and Individual Differences. 40 (1), 39-51.
Rajneesh, (2001). Emotional intelligence in relation to five factors of personality and cognitive and emotional components of
empathy. M.A. Dissertation, Kurukshetra University, Kurukshetra.
Singh, U. and Kumari, M. (2006). Relationship among personality dimensions, occupational stress, self-related cognitions and burnout of high school female teachers. Maharishi Dayanand