Sharif University of Technology
Scientia IranicaTransactions E: Industrial Engineering www.scientiairanica.com
A novel project portfolio selection framework: An
application of fuzzy DEMATEL and multi-choice goal
programming
B.H. Tabrizi
, S.A. Torabi and S.F. Ghaderi
School of Industrial Engineering, College of Engineering, University of Tehran, Tehran, Iran. Received 20 August 2014; received in revised form 8 May 2015; accepted 19 October 2015
KEYWORDS Project portfolio selection; Projects synergy; Fuzzy DEMATEL; Multi-choice goal programming.
Abstract.Project portfolio selection is an important problem for having an ecient and eective project management. This paper proposes a new framework to identify the optimal project portfolio. First, the inuencing criteria are derived with respect to higher priorities from the fuzzy DEMATEL method under the balanced scorecard framework. Afterwards, a utility-based multi-choice goal programming technique is applied to determine the project portfolio in regard to the chosen criteria and some other operational limitations. The synergy amongst projects and the outsourcing option are also taken into account in order to provide a more realistic selection process. Finally, applicability and validity of the proposed integrated model are tested by a case study conducted in a pharmaceutical company. © 2016 Sharif University of Technology. All rights reserved.
1. Introduction
Investing continuously in successive and simultaneous projects can guarantee the benecial growth of any organization. However, the concern is that the po-tential projects mostly exceed the capacity levels of organizations. Having an ecient project manage-ment is hence required for such organizations and the project-oriented ones, in particular [1]. Project man-agement consists of dierent phases including setting the portfolio, scheduling corresponding tasks, assigning necessary resources, etc., where the rst task starts with the Project Portfolio Selection (PPS) problem. Project portfolio plays a noticeable role in the thorough success of the undertaken projects. Consequently, PPS can highly inuence the achievement to the goals of the organizations and is addressed in the category of project and engineering management as an active
*. Corresponding author. Tel.: +98 21 88021067; Fax: +98 21 88013102
E-mail address: [email protected] (B.H. Tabrizi)
research topic [2]. PPS deals with the problem of how to select a nite number of projects amongst the extant alternatives while considering their contributions to the objectives of the organization as well as limitation of resources.
Since PPS is an initial step in putting the projects into eect, inappropriate decisions may result in two outgrowths. The former is that available resources are consumed for projects which are not completely advantageous and the latter is that the organization is deprived of potential gains which it would reach if it invested in more protable projects (i.e., the opportunity cost). PPS is a strategic decision prob-lem often characterized by multiple, conicting, and disproportionate criteria by which the Decision Maker (DM) has to set a portfolio of the most appealing alternatives with respect to dierent aspects of the projects eciency [3].
As the given problem (i.e., PPS) needs to be studied under a variety of objectives, it is often considered with respect to simultaneous application of multi-attribute and multi-objective programming
techniques. However, some papers have just applied the multi-attribute techniques such as Vetschera and de Almeida [4] (2011). Multi-attribute techniques are mainly used for an initial screening and ranking purposes. In other words, they can be used as the inputs for multi-objective models in which the nal selection is carried out by incorporating limitations of the system. For example, Iniestra and Gutierrez [5] (2009) considered a PPS problem for transportation planning by the use of a constrained multi-objective model with quadratic objective functions. They ltered the solution by a knee identication procedure and ap-plied the ELECTRE-III method to practice preferences of the DM.
Some papers enhanced the selection problem by taking additional issues into account. For instance, Liu and Wang [6] (2011) combined the PPS problem with time-dependent resource constraints scheduling. They concentrated on dierent periodical procurement strategies and budget limitations. However, the nal results were determined only by the prot maximiza-tion objective.
The rest of the paper is organized as follows. A brief literature review is presented in the next section. The proposed PPS framework is dened in Section 3, in addition to the MCDM techniques. Section 4 consists of a real case study, performed in an Iranian pharmaceutical company, and a sensitivity analysis in order to clarify the practical application of the integrated model. Finally, conclusion remarks and future research directions are discussed in the last section.
2. Literature review
There is extensive literature on PPS problem with regard to its signicant functionality in today's com-petitive markets. Herein, we have concentrated on the issue in accordance with distinctive novelty aspects, by reviewing the literature. To this aim, the research stud-ies have been classied with respect to incorporation of interdependencies, in/outsourcing, and uncertainty aspects, as follows.
Accounting for the contingency interdependence of the existing projects is a crucial issue to select the portfolio. Since a given project may aect the output of another project, and vice versa, the PPS may function not optimally if projects are considered as independent units. The following papers can be exem-plied in which the inner interaction of the projects has been investigated. De Almeida and Duarte [7] (2011) investigated the project synergy according to the benets gained by their interactions by a non-linear zero-one optimization problem. They determined the synergy values in accordance with multiple criteria and DM's preference information based on the importance
of each criterion. Carazo et al. [8] (2010) proposed an integrated binary programming model for setting the project portfolio and scheduling the chosen projects by identifying the optimum time to launch each project into the portfolio. They considered the potential synergy amongst projects and applied a scatter search-based approach as the solution methodology. The synergy values were based on Stummer and Heiden-berger's method [9] (2003). Pendharkar [10] (2013) presented a comprehensive decision-making framework to evaluate IT projects portfolio with and without consideration of interdependencies. They applied a dynamic programming-based method to investigate in-dependent projects and a mixed-integer programming approach for dependent projects. Abbassi et al. [11] (2014) also accounted for projects' interdependencies in research and development PPS by a binary non-linear mathematical programming model. They applied a cross-entropy algorithm to solve the model.
Another important aspect in PPS problems can be associated with the possibility of utilizing outer sources (i.e., outsourcing). Outsourcing choice can yield to increase in productivity of the organization. In other words, a further opportunity is provided in circumstances where the organization is not able to per-form a given project by itself, by any reason, although its selection is benecial. Mojsilovic et al. [12] (2007) proposed a management methodology for outsourcing projects. They considered the problem for the case of vendors and developed a risk assessment model and a systematic analysis of outsourcing results. Tsai et al. [13] (2010) focused on IT projects and dealt with dierent strategies of sourcing with a combination of DEMATEL, Analytic Network Process (ANP), and zero-one Goal Programming (GP). They used the DEMATEL and ANP techniques to build the rela-tionship map and priority weight matrix, respectively. Afterwards, unnecessary relations could be left out by setting a threshold. The nal yield (i.e., the priority weights) was entered into the GP model to help the DM choose the best strategy.
The considerable point in application of multi-criteria approaches (e.g., DEMATEL or ANP) is that their mere use does not necessarily trigger the op-timum portfolio as they may be biased. Therefore, balanced scorecard (BSC) has been applied here as a managerial tool in the PPS problem. It provides the opportunity to evaluate managerial activities and processes with unbiased viewpoints by taking both tangible and intangible aspects, i.e. nancial and non-nancial, into account [14]. BSC considers three more aspects including the relationship among the customers (CR), Internal Business Process (IBP), and Learning and Growth (LG), in addition to the nancial facet of decision making. Therefore, it is expected that DEMATEL can lead to a well-directed selection of
the key criteria in the PPS problem under the BSC framework. Cho and Lee [15] (2011) applied the BSC to select the appropriate processes of the business project management. Xu and Yeh [16] (2012) dealt with evaluation and planning of both the lower and higher-level goals of an organization by the BSC framework.
In addition to the mentioned aspects, incorpora-tion of uncertainty in decision making can strengthen the obtained results. There are rather a variety of papers which have focused on the uncertainty issue. For instance, Khalili-Damghani et al. [17] (2013) pro-posed a fuzzy GP approach to account for conicting goals with imprecise priorities under a multi-period planning horizon. They used Technique for Order Preference by Similarity to Ideal Solution (TOPSIS) to restrict the PPS to a bi-objective problem. Bhat-tacharyya et al. [18] (2011) incorporated uncertainty and synergy concepts in their proposed fuzzy objective programming model. They applied multi-objective genetic algorithm to solve the problem which consisted of cost and risk minimization and outcome maximization. Chang and Lee [19] (2012) dealt with the circumstances where the input and output data had a vague nature. They proposed an integrated frame-work, including Data Envelopment Analysis (DEA), knapsack formulation, and Fuzzy Set Theory (FST), to set the optimum portfolio. The model was solved by three dierent constraint-handling techniques and articial bee colony and the results were compared.
Tavana et al. [20] (2013) proposed a fuzzy multi-dimensional multiple-choice knapsack problem formu-lation in PPS. Their model consisted of an ecient "-constraint method and an adapted multi-objective evolutionary algorithm. They also limited the obtained alternatives by a DEA model. Gutjahr et al. [21] (2013) addressed the allocation of the work to human re-sources and distribution of work over time by a stochas-tic optimization model for PPS. Moreover, they took outsourcing opportunities into account and applied a modication of variable-neighborhood search algorithm to determine the upper-bound of the problem.
Regarding the critical role of the PPS problem in the organization survival, more comprehensive models are needed to be developed. For example, it is advisable to provide exibility in the organizations by considering dierent sourcing options so that they can handle potentially protable projects even if there is no technical knowledge or there is resource availability restriction. Another important aspect of the PPS prob-lem is associated with taking the interactive eects into consideration where running two distinctive projects at the same time may cause them to have reciprocal impacts on each other and aect the organization performance, likewise. Therefore, this paper aims to consider the projects synergy and sourcing options under information ambiguity. To do so, rst, more
inuencing criteria are derived by a multi-attribute technique and, nally, the projects are selected with respect to the given criteria and operational constraints (e.g., the manpower and budget limitations) by a multi-objective programming model.
The main contributions of the paper can be summarized as follows:
Application of an integrated MCDM framework comprised of fuzzy DEMATEL and a tailored multi-choice goal programming model to deal with the PPS problem;
Realization of the most crucial criteria, with respect to the balanced score card concept, derived from the DEMATEL;
Simultaneous consideration of dierent sourcing al-ternatives to perform a project and the synergy eect in the portfolio.
3. Problem denition
An integrated model is developed in this section to tackle PPS problem consisting of fuzzy DEMATEL and Multi-Choice Goal Programming (MCGP) technique based on utilities of the decision maker. The fuzzy DEMATEL identies the core criteria regarding the imprecision of individuals' statements within the selec-tion process. Then, the PPS is handled by a tailored MCGP model considering organization constraints. 3.1. Fuzzy DEMATEL
Decision-making trial and evaluation laboratory (DE-MATEL) was rst introduced by the Battelle Memorial Institute through its Geneva Research Centre [22,23]. DEMATEL can be referred to as a structural model which is able to extract the relations between intricate criteria. The method can determine the importance of the criteria under consideration and the extent that a given factor inuences the others, as well. It is based on digraphs, i.e. directed graphs, and functions according to two cause and eect groups [24].
The usage of DEMATEL leads to reduction in the amount of criteria required to be taken into considera-tion. It provides a visual illustration of addressing the actions and decisions, which can enhance performance of the organization [25].
The implementation steps of DEMATEL are briey described below:
1. Find the pair-wise comparison matrix: In this step, the DM needs to develop a pair-wise comparison matrix in which array aij denotes how criterion
i inuences criterion j. To do the comparisons, integer scores are utilized ranging from 0, 1, 2, 3, and 4 such that they stand for \No inuence", \Very low inuence", \Low inuence", \High inu-ence", and \Very high inuinu-ence", respectively. The
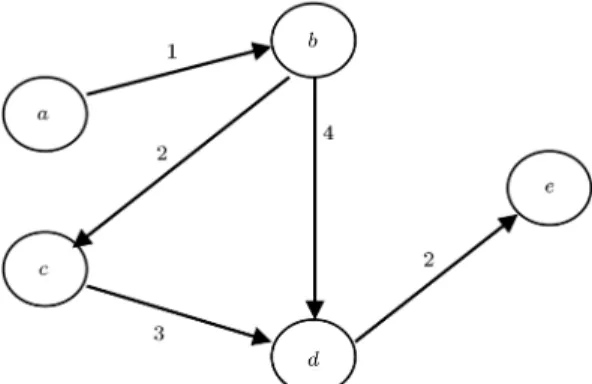
Figure 1. Example of an inuence map.
comparison matrix can be developed to an average matrix in the case of presence of a group of experts. Eq. (1) shows the calculation process of an average matrix while it is to include the comparison results of experts (e.g., h):
[aij]nn= 1h h
X
k=1
[Xk
ij]nn; (1)
where Xk
ij denotes opinion of the kth expert
re-garding the degree to which criterion i inuences criterion j. The initial direct relation matrix is obtained in this step, showing the initial direct inuence that an element dispatches to and receives from other elements. Moreover, an inuence map can be extracted by mapping out the causal eect between each pair of criteria. Figure 1 depicts a network inuence map, in which the letters and arrows indicate the criteria and the eects, respectively. For example, an arrow from b to d shows the eect that b practices on d, and number 4 states that the eect is very high.
2. Calculate the normalized initial direct-relation ma-trix: Eqs. (2) and (3) calculate the normalized direct-relation matrix M in which all diagonal elements are set to zero.
M = k:A; (2)
k = 1 maxPn
j=1jaijj
; 8i = 1; 2; ; n: (3)
3. Compute the relation matrix: The total-relation matrix S can be computed following the normalized direct-relation matrix. It can be ob-tained through Eq. (4) in which I stands for the identity matrix.
S = M + M2+ M3+ + M1=X1 i=1
Mi
= M(1 M) 1: (4)
4. Compute dispatcher and receiver groups:
Dis-patcher and receiver groups can be identied with respect to D R and D + R values, in which R and D represent the sums of columns and rows of matrix S, respectively. Eqs. (5)-(7) calculate a level of inuence to others and a level of relationships with others. How a criterion inuences the others is interpreted by D R, such that the positive values represent the criteria with more inuence and higher priority, i.e. the dispatchers. On the contrary, the negative values refer to the mostly inuenced criteria with lower priority, i.e. the re-ceivers [26]. Without loss of generality, the relation degree of a given criterion with the others can also be derived from D + R. In other words, the higher the value of D+R, the more amount of relation the corresponding criterion has [27].
S = [si;j]nn; i; j 2 f1; 2; ; ng; (5)
D =Xn
j=1
si;j; (6)
R =Xn
i=1
si;j: (7)
5. Set a threshold value and obtain the map: An appropriate impact-diagraph-map can be obtained by selecting a threshold value as the inuence level by the DM. The map incorporates the elements whose values surpass the selected threshold. The impact-diagraph-map can be developed by mapping the data set of (D+R, D-R), in which D+R and D-R make up horizontal and vertical axes, respectively.
As the construction of pair-wise comparison ma-trices in DEMATEL is rarely certain, fuzzy logic has been taken into consideration to deal with extant am-biguities. FST was introduced by Zadeh [28] (1965) to address linguistic variables, based on the membership function concept. The purpose of the theory is to lessen the eects of subjective judgments stemming from extant fuzziness of peoples' thoughts, which has been proved eciently. Here, Triangular Fuzzy Numbers (TFN) have been used to address linguistic values, as a common existing way in the literature.
The application of an ecient fuzzy aggregation method is accounted for another important issue to deal with the interval by which a TFN is dened. In a broader sense, each fuzzy aggregation method needs a defuzzication method to convert the fuzzy numbers into explicit crisp scores. Without loss of generality, there are many dierent defuzzication methods in the literature; however, a good defuzzication method should regard a fuzzy number in terms of its shape, spread, height, and relative location on the x-axis [29].
For instance, centroid (center-of-gravity) method does not distinguish between two fuzzy numbers with the same crisp value and dierent shapes [30]. Hence, Con-verting Fuzzy data into Crisp Scores (CFCS), devel-oped by Opricovic and Tzeng [31] (2003), is commonly used as an ecient method to prevent facing such problems. The approach is based on a ve-step algo-rithm beneting from the possibility of questionnaires application. Dierent papers have addressed the CFCS method, since it could strengthen the group decision-making procedures (e.g. [14,32]). The implementation steps of the algorithm are explained through Eqs. (8)-(15), supposing that ~Zk
ij = (lkij; mkij; rijk) stands for the
fuzzy assessment of the kth evaluator (k = 1; 2; ; h) on the eect degree of criterion i over criterion j. Step 1. Normalization:
xrk
ij = (rijk min lkij)=maxmin; (8)
xmk
ij= (mkij min lkij)=maxmin; (9)
xlk
ij = (lkij min lijk)=maxmin; (10)
where max
minmax rkij min lkij.
Step 2. Compute right (rs) and left (ls) normalized values:
xrsk
ij= xrijk=(1 + xrijk xmkij); (11)
xlsk
ij = xmkij=(1 + xmkij xlijk): (12)
Step 3. Compute total normalized crisp values: xk
ij =
[xlsk
ij(1 xlskij) + xrskijxrskij]
[1 xlsk
ij+ xrskij] : (13)
Step 4. Compute crisp values: Zk
ij = min lijk + xkij maxmin: (14)
Step 5. Integrate crisp values:
Zij = 1=h(Zij1 + Zij2 + + Zijh): (15)
The fuzzy DEMATEL method can now be imple-mented with regard to the mentioned steps of DEMA-TEL under imprecise decision making. A linguistic scale is required in order to deal with the uncertain assessments of the DM. The scale of linguistic variables is formed with respect to the amount of inuence shown in Table 1. The criteria should be compared with each other from the viewpoint of linguistic vari-able \inuence". The elements of the initial direct-relation matrix are obtained through the crisp values of fuzzy assessments. Afterwards, the normalized direct-relation and total-direct-relation matrices can be achieved, respectively, through Eqs. (2)-(4). The output of the total-relation matrix can then be reected by the causal diagram.
Table 1. The fuzzy linguistic scale.
Linguistic term Abbreviation Corresponding TFN
No inuence No (0,0,0.25)
Very Low inuence VL (0,0.25,0.5)
Low inuence L (0.25,0.5,0.75)
High inuence H (0.5,0.75,1.0)
Very High inuence VH (0.75,1.0,1.0)
3.2. Multi-choice goal programming
GP is associated with the seminal work of Charnes and Cooper [33] (1961), developed later by others (e.g., see [34,35]). It has received much attention since its introduction and has been frequently used in treating multiple conicting objectives. GP provides the DM with appropriate aspiration level of setting for the given goals. It functions based on the devi-ation minimizdevi-ation between the aspirdevi-ation and goals achievement levels. However, the dependence of the basic GP method on the DM in setting the aspiration levels has always been considered as a controversial issue. Hence, Multi-Choice Aspiration Level (MCAL) was presented to enhance the practical application of the classic GP so that DMs could set more aspiration levels for each goal [36]. Figure 2 illustrates a possible feasible region and the given solution for dierent GP approaches. MCGP was further modied to a constrained version, called constrained MCGP, which was not dependent on the use of multiplicative terms of binary variables [37].
However, Chang [38] (2011) improved his previ-ous work and presented a new concept for achieving aspiration levels based on the utility functions. The main idea was to prepare goal achievement in terms of the highest utility level. To describe the utility-based MCGP, formulated by model (16), the associated parameters and decision variables are introduced, as follows. Moreover, it should be noted that the index i is associated with the ith goal. Specically, weight
Figure 2. Solutions of dierent GP methods according to the feasible space.
i plays the role of a preferential component for the
utility function ui(yi).
Parameters:
wi Weights corresponding to deviational
variables d+ i , di
i Weights corresponding to deviational
variable fi
gi;min The lower value for yi
gi;max The upper value for yi
Decision variables:
i The utility value of the ith goal
yi A continuous variable with a value
range of [gi;min; gi;max]
d+
i Positive deviation from the ith goal
aspiration level
di Negative deviation from the ith goal aspiration level
min
n
X
i=1
[wi(d+i + di ) + ifi ];
S.t. iggi;max yi
i;max gi;min; i = 1; 2; ; n;
fi(X) d+i + di = yi; i = 1; 2; ; n;
i+ fi = 1; i = 1; 2; ; n;
gi;min yi gi;max; i = 1; 2; ; n;
d+
i ; di ; fi ; i 0; i = 1; 2; ; n;
X 2F (F is a feasible set and X is free in sign): (16) On the other hand, model (17) can be substituted for circumstances with the purpose of satisfying the maximum possible amount of utility value. In other words, model (16) corresponds to the less, the better conditions (e.g., cost or risk minimization) and model (17) pertains to the more, the better conditions (e.g., prot or manpower utilization maximization).
minXn
i=1
[wi(d+i + di ) + ifi ];
S.t. ig yi gi;min
i;max gi;min; i = 1; 2; ; n:
fi(X) d+i + di = yi; i = 1; 2; ; n;
i+ fi = 1; i = 1; 2; ; n;
gi;min yi gi;max; i = 1; 2; ; n;
d+
i ; di ; fi ; i 0; i = 1; 2; ; n;
X 2F (F is a feasible set and X is free in sign). (17) The applicability of the utility-based goal programming model can be elaborated by the following example. Consider a company whose Chief Executive Ocer (CEO) has suggested the achievement of X monetary units as the initial aspiration level of organizational goals for the current year, in terms of the given resource limitations and incompleteness of available informa-tion. Moreover, he/she has pointed that the higher the aspiration level, the better it is in the long-term if more resources can be provided. The CEO sets the initial aspiration level for their goal according to this scenario by a conservative policy. It is noteworthy that the initial target setting stage may be accompanied by underestimation. Regarding the above-mentioned notes, the president needs a decision aid to comprehend the appropriate aspiration level for guiding the target value of the CEO and nd the corresponding potential feasible region. In other words, a multiple-aspiration-level mechanism can play a signicant role to develop the GP approach. In a broader point of view, decision making can be performed in regard to the expected utilities for each objective (i.e., the aspiration levels achievement).
The implementation steps of the proposed ap-proach are illustrated in Figure 3, as follows.
4. Case study and discussion
A real case study has been conducted in order to test applicability of the proposed model. The case study pertains to a large pharmaceutical company in Iran. The management board of the company had to decide about the acceptance (whether to insource or outsource) or rejection of launching some nutritious supplements. To do so, it was needed to select the most appropriate set of medicines such that the company reached its vision in the best way. Hence, the proposed PPS problem was applied to determine, rstly, on which alternatives the company should concentrate and, secondly, whether it is advisable to produce or outsource the selected supplements.
The decision committee adopted the following ve steps:
1. Fuzzy DEMATEL questionnaire design;
2. Calculation process of fuzzy DEMATEL method;
3. Specifying the signicant evaluation criteria;
4. Developing the impact-diagraph-map;
5. Extracting the most inuential criteria to be ap-plied in the utility-based MCGP.
Figure 3. The owchart of the PPS problem.
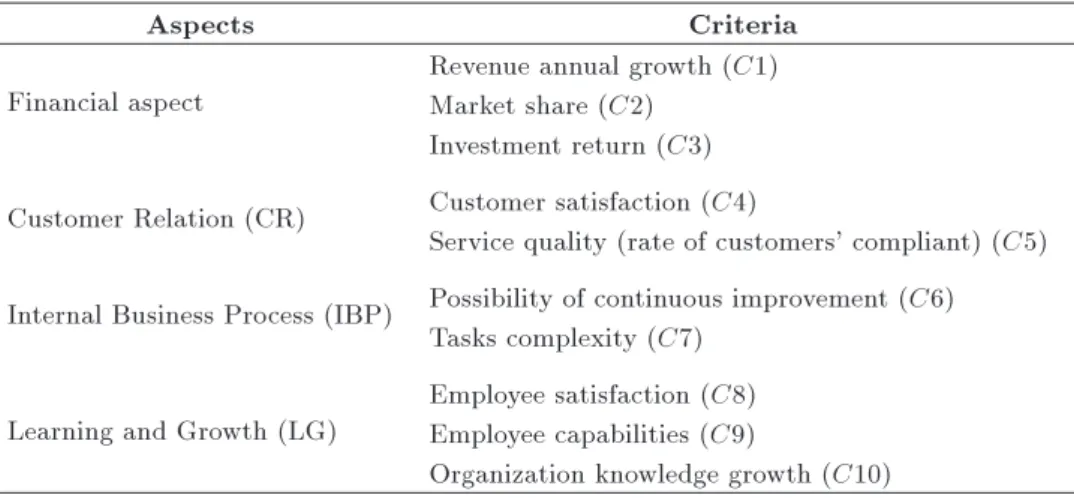
Table 2. Evaluation aspects of each criterion based on the BSC approach.
Aspects Criteria
Financial aspect
Revenue annual growth (C1) Market share (C2)
Investment return (C3) Customer Relation (CR) Customer satisfaction (C4)
Service quality (rate of customers' compliant) (C5) Internal Business Process (IBP) Possibility of continuous improvement (C6)
Tasks complexity (C7) Learning and Growth (LG)
Employee satisfaction (C8) Employee capabilities (C9)
Organization knowledge growth (C10)
4.1. Fuzzy DEMATEL questionnaire design The executed study utilized 10 evaluation criteria under the BSC umbrella. In fact, dierent criteria were taken into account as appropriate representations of the corresponding aspects of BSC. However, the aspects can be extended to a larger set of criteria in further studies, if necessary. The incorporated criteria are shown in Table 2, from C1 to C10, respectively. Revenue annual growth (C1) shows the annual growth in revenue of the company. Market share (C2) corresponds to the portion of the extant demand, which is absorbed by the company. Investment return (C3) stands for the time period in which the invested funds are recovered. Customer satisfaction (C4) is associated with the amount of fullled satisfaction
amongst the customers. Service quality (C5) shows the level of provision of service to customers. Possibility of continuous improvement (C6) states the potential of continuous improvement in return for implementing a specic project. Tasks complexity (C7) points to the amount that performing the activities of a project is intricate. Employee satisfaction (C8) indicates the satisfaction degree of the company's personnel obtained in the course of carrying out a given project. Employee capabilities (C9) also represents the inuence of a project on the capabilities of the personnel. Finally, organization knowledge growth (C10) points to the extent that the current knowledge of the organization is likely to be enhanced by the performance of a project.
The fuzzy DEMATEL method was used to ap-praise each of the criteria inuencing the projects portfolio. The questionnaire of fuzzy DEMATEL was designed in three separate parts. The rst part described each criterion and presented a concise def-inition for easy understanding and response. Then, respondents were asked to give the inuence degree of each criterion on the others, as mentioned in Section 2. Finally, the last part of the questionnaire was related to the personal data.
4.2. The calculation of fuzzy-DEMATEL method
The designed questionnaires were distributed amongst the decision committee members involving the man-agement team and a group of senior consultants. Table 3 shows the assessment data with respect to linguistic variables. Afterwards, the initial direct-relation and the normalized direct-direct-relation matrices were generated through Eqs. (2) and (3) (see Tables 4 and 5). Finally, total-relation matrix was attained using Eq. (4) (see Table 6).
4.3. Signicant criteria
The calculations of the fuzzy DEMATEL demonstrated which of the criteria played a signicant role in the portfolio of the projects. According to Table 6, employee capabilities (C9), possibility of continuous
improvement (C6), organization knowledge growth (C10), and tasks complexity (C7) were the bottom criteria, respectively. The results revealed that the aforementioned criteria belonged to the cause group and revenue annual growth (C1), market share (C2), investment return (C3), customer satisfaction (C4), service quality (C5), and employee satisfaction (C8) constituted the eect group.
4.4. The impact-diagraph-map
The obtained results of the total-relation matrix were also used to achieve the impact-diagraph-map. The impact-diagraph-map is the most important product of the total-relation matrix, which consists of the strategy map and the causal diagram. The strategy map represents the organizational strategy by the cause and eect model [39]. The impact-diagraph-map has been depicted in Figure 4.
4.5. Application of the utility-based MCGP The utility-based MCGP model was developed after-wards, with respect to the key criteria and extant operational limitations. The available budget of the company seemed to be one of the chief constraints in the course of the projects selection. On the other hand, available personnel working time had to be taken into account as a crucial element, so that the selected projects could be delivered to the stakeholders in time.
Table 3. The assessment data of criteria.
C1 C2 C3 C4 C5 C6 C7 C8 C9 C10
C1 No H H VL L L No H VL L
C2 VH No H VL VL No No H L VL
C3 H L No VL VL L VL H VL L
C4 H H H No VH VL VL VL No VL
C5 L H H H No VL VL VL No VL
C6 H H H H H No L L H VH
C7 VL L L L L VL No H L H
C8 L L L L L L VL No VL H
C9 H H H L H H VH L No H
C10 VH VH H VH H H H L H No
Table 4. The initial direct-relation matrix.
C1 C2 C3 C4 C5 C6 C7 C8 C9 C10
C1 0.000 0.517 0.665 0.358 0.576 0.437 0.262 0.671 0.325 0.496 C2 0.724 0.000 0.533 0.225 0.386 0.282 0.237 0.614 0.290 0.229 C3 0.547 0.405 0.000 0.205 0.449 0.483 0.187 0.660 0.321 0.451 C4 0.593 0.682 0.596 0.000 0.768 0.304 0.271 0.330 0.185 0.254 C5 0.380 0.609 0.488 0.418 0.000 0.253 0.189 0.288 0.164 0.235 C6 0.626 0.737 0.594 0.755 0.581 0.000 0.537 0.576 0.614 0.778 C7 0.408 0.556 0.569 0.397 0.514 0.346 0.000 0.694 0.372 0.732 C8 0.535 0.526 0.502 0.404 0.427 0.481 0.238 0.000 0.164 0.577 C9 0.626 0.664 0.607 0.449 0.639 0.584 0.635 0.443 0.000 0.574 C10 0.793 0.763 0.748 0.743 0.560 0.697 0.709 0.427 0.658 0.000
Table 5. The normalized direct-relation matrix.
C1 C2 C3 C4 C5 C6 C7 C8 C9 C10
C1 0 0.08478 0.10905 0.05870 0.09445 0.07166 0.04296 0.11003 0.05329 0.08133 C2 0.11872 0 0.08740 0.03689 0.06329 0.04624 0.03886 0.10068 0.04755 0.03755 C3 0.08970 0.06641 0 0.03361 0.07363 0.07920 0.03066 0.10823 0.0526 0.07395 C4 0.09724 0.11184 0.09773 0 0.12594 0.04985 0.04444 0.05411 0.03033 0.04165 C5 0.06231 0.09986 0.08002 0.06854 0 0.04148 0.03099 0.04722 0.02689 0.03853 C6 0.10265 0.12085 0.09740 0.12381 0.09527 0 0.08806 0.09445 0.10068 0.12758 C7 0.06690 0.09117 0.09330 0.06510 0.08429 0.05674 0 0.11380 0.06100 0.12003 C8 0.08773 0.08625 0.08232 0.06625 0.07002 0.07887 0.03902 0 0.02689 0.09462 C9 0.10265 0.10888 0.09954 0.07363 0.10478 0.09576 0.10413 0.07264 0 0.09412 C10 0.13004 0.12512 0.12266 0.12184 0.09183 0.1143 0.11626 0.07002 0.10790 0
Table 6. The total-relation matrix.
C1 C2 C3 C4 C5 C6 C7 C8 C9 C10 D D+R D-R
C1 0.2102 0.2921 0.3097 0.2122 0.2792 0.2243 0.1688 0.2911 0.1757 0.2448 2.4085 5.3488 -0.5316 C2 0.2787 0.1738 0.2532 0.1626 0.2173 0.1734 0.1402 0.2507 0.1466 0.1771 1.9741 4.9878 -1.0395 C3 0.2687 0.2523 0.1870 0.1738 0.2392 0.2136 0.1447 0.2680 0.1618 0.2208 2.1302 5.0906 -0.8300 C4 0.2753 0.2916 0.2770 0.1366 0.2859 0.1847 0.1524 0.2227 0.1395 0.1882 2.1544 4.3621 -0.0533 C5 0.2064 0.2405 0.2215 0.1713 0.1353 0.1484 0.1176 0.1802 0.1134 0.1538 1.6889 4.4116 -1.0338 C6 0.3768 0.3983 0.3735 0.3235 0.3488 0.2113 0.2553 0.3424 0.2615 0.3423 3.2341 5.4327 1.0356 C7 0.2900 0.3150 0.3133 0.2310 0.2856 0.2244 0.1393 0.3089 0.1935 0.2920 2.5935 4.4060 0.7809 C8 0.2743 0.2763 0.2701 0.2069 0.2427 0.2172 0.1556 0.1755 0.1438 0.2418 2.2047 4.8814 -0.4718 C9 0.3481 0.3595 0.3475 0.2595 0.3306 0.2779 0.2519 0.3011 0.1538 0.2938 2.9242 4.6898 1.1585 C10 0.4113 0.4137 0.4072 0.3298 0.3577 0.3229 0.2863 0.3356 0.2754 0.2399 3.3802 5.7753 0.9851
R 2.9402 3.0137 2.9603 2.2077 2.7227 2.1985 1.8125 2.6766 1.7656 2.3951
Figure 4. The impact-diagraph-map for the given PPS problem.
Likewise, it was needed to carry out a further analysis and supervision by the project manager or the cor-responding supervisors within the project completion. Hence, the issue was taken into account as another operational constraint.
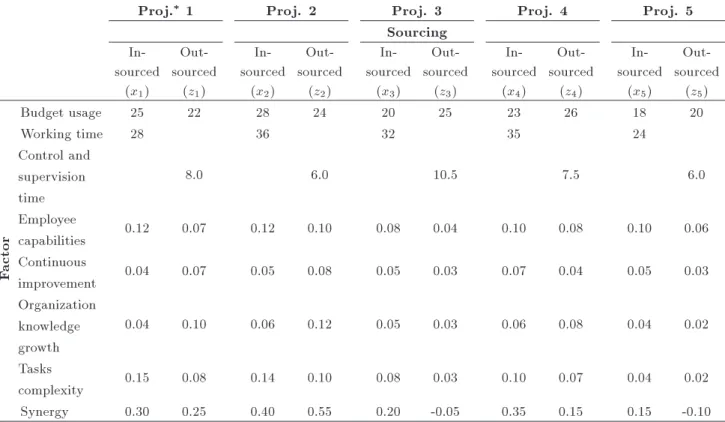
On the other hand, the project portfolio should be lled such that an acceptable level of satisfaction is obtained for the evaluation criteria. This is practiced in addition to the synergy issue by which the parallel selection is met. The study incorporated ve dierent projects which could be either insourced or outsourced. Table 7 shows the related data for each of the projects which were developed through a consensus amongst the management team.
The GP mathematical model can be written as follows, in which the rst two objectives are represented by the MCGP and the rest by the utility-based MCGP approach, respectively.
The constraints of the rst goal, i.e., personnel working time, are written by Eq. (18), in which the lower and upper bounds are equal to 100 and 140 hours a week, respectively. They encompass the required time for projects execution and analysis. As can be seen, the optimum circumstance is obtained if there is no need for under-working or overworking such that the entire available time of the work force is utilized.
Table 7. The organization limitations on selecting the projects portfolio.
Proj. 1 Proj. 2 Proj. 3 Proj. 4 Proj. 5
Sourcing
In-sourced (x1)
Out-sourced
(z1)
In-sourced
(x2)
Out-sourced
(z2)
In-sourced
(x3)
Out-sourced
(z3)
In-sourced
(x4)
Out-sourced
(z4)
In-sourced
(x5)
Out-sourced
(z5)
Factor
Budget usage 25 22 28 24 20 25 23 26 18 20
Working time 28 36 32 35 24
Control and supervision time
8.0 6.0 10.5 7.5 6.0
Employee
capabilities 0.12 0.07 0.12 0.10 0.08 0.04 0.10 0.08 0.10 0.06
Continuous
improvement 0.04 0.07 0.05 0.08 0.05 0.03 0.07 0.04 0.05 0.03
Organization knowledge growth
0.04 0.10 0.06 0.12 0.05 0.03 0.06 0.08 0.04 0.02
Tasks
complexity 0.15 0.08 0.14 0.10 0.08 0.03 0.10 0.07 0.04 0.02
Synergy 0.30 0.25 0.40 0.55 0.20 -0.05 0.35 0.15 0.15 -0.10
Proj.: Project.
y1+ e1 e+1 = 140;
100 y1 140;
d1; d+
1; e1; e+1 0: (18)
The constraints of the second goal, i.e. the control and supervision times, are shown by Eq. (19). The corresponding minimum and maximum values for the available analysis and supervision time equal 10 and 21 hours a week, respectively. Furthermore, the given constraints stand for the category of the lower value, the better choice and mainly refer to the projects which are to be outsourced.
8z1+ 6z2+ 10:5z3+ 7:5z4+ 6z5+ d2 d+2 = y2;
y2+ e2 e+2 = 15;
10 y2 21;
d2; d+
2; e2; e+2 0: (19)
In addition to the last two goals that were incorporated in terms of MCGP problems, the following goals were taken into account with respect to utility func-tions. They consist of employee capability, possibility of continuous improvement, organization knowledge growth (right triangular utilities), and tasks complexity (left triangular utility), respectively, represented by
Eqs. (20)-(23). The bound values of the utilities were practiced in accordance with the strategic and tactical planning of the company.
0:12x1+ 0:07z1+ 0:12x2+ 0:10z2+ 0:08x3
+ 0:04z3+ 0:10x4+ 0:08z4+ 0:10x5
+ 0:06z5+ d3 d+3 = y3;
1 0:3 0:1y3 0:1;
1+ f1 = 1;
0:1 y3 0:3;
d3; d+
3; f1 ; 1 0; (20)
0:04x1+ 0:07z1+ 0:05x2+ 0:08z2+ 0:05x3
+ 0:03z3+ 0:07x4+ 0:04z4+ 0:05x5
+ 0:03z5+ d4 d+4 = y4;
2 0:2 0:1y4 0:1;
0:1 y4 0:2;
d4; d+
4; f2 ; 2 0; (21)
0:04x1+ 0:10z1+ 0:06x2+ 0:12z2+ 0:05x3
+ 0:03z3+ 0:06x4+ 0:08z4+ 0:04x5
+ 0:02z5+ d5 d+5 = y5;
3 0:15 0:05y5 0:05 ;
3+ f3 = 1;
0:05 y5 0:15;
d5; d+
5; f3 ; 3 0; (22)
0:15x1+ 0:08z1+ 0:14x2+ 0:10z2+ 0:08x3
+ 0:03z3+ 0:10x4+ 0:07z4+ 0:04x5
+ 0:02z5+ d6 d+6 = y6;
4 0:15 0:050:15 y6 ; i = 1; 2; ; n;
4+ f4 = 1;
0:05 y6 0:15;
d+
6; d6; f4 ; 4 0: (23)
Finally, the last goal pertains to the synergy issue whose constraints are written by Eq. (24). It should be noted that the corresponding values addressing the amount by which a project inuences the others have been introduced through the experts' analysis meetings.
0:30x1+ 0:25z1+ 0:40x2+ 0:55z2+ 0:20x3
0:05z3+ 0:35x4+ 0:15z4+ 0:15x5
0:10z5+ d7 d+7 = y7;
5 0:5 0:2y7 0:2;
5+ f5 = 1;
0:2 y7 0:5;
d7; d+
7; f7 ; 7 0: (24)
Two other sets of constraints have to be added to the model, i.e. Eqs. (25) and (26), as well. The former
set pertains to the budget restriction, which should be taken into account as a systematic constraint. The latter set is associated with the sourcing state of the projects. They guarantee that a given project is either insourced or outsourced, if selected.
25x1+ 22z1+ 28x2+ 24z2+ 20x3+ 25z3
+ 23x4+ 26z4+ 18x5+ 20z5 62; (25)
x1+ z1 1; x2+ z2 1; x3+ z3 1;
x4+ z4 1; x5+ z5 1: (26)
Finally, the objective function has been written by Eq. (27), aiming at minimization of the weighted deviations from the target levels:
min Z =w1(d+1 + d1 + e+1 + e1)
+ w2(d+2 + d2 + e+2 + e2) + w3(d+3 + d3)
+ 1f1 + w4(d+4 + d4) + 2f2
+ w5(d+5 + d5) + 3f3 + w6(d+6 + d6)
+ 4f4 + w7(d7++ d7) + 5f5 : (27)
The decision-making committee considered the weights of the objective function as follows: w1 = 0:05,
w2 = 0:2, w3 = 0:1, w4 = 0:3, w5 = 0:2,
w6 = 0:05, w7 = 0:3, and i = 0:9 (i =
1; 2; ; 5). The mathematical model was then solved by GAMS 22-1 software and the following results were obtained: (x1; z1; x2; z2; x3; z3; x4; z4; x5; z5) =
(0; 0; 0; 0; 1; 0; 1; 0; 1; 0).
Accordingly, the third, fourth, and fth projects were selected to be insourced. However, the obtained result is dependent to a large extent on the subjects such as the resource usage requirement. Therefore, dierent portfolios may be obtained under dierent scenarios.
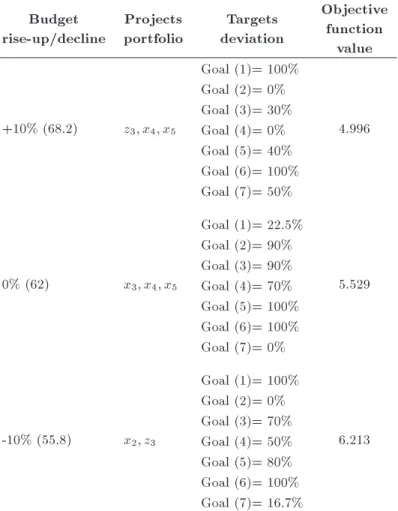
The decision-making committee took the issue into account as the company might encounter some restrictions by its nance. They implemented a sensitivity analysis to test performance of the model for circumstances in which the extant budget might change. Hence, two other conditions were considered for the budget rise-up and decline states, respectively. The results are shown in Table 8.
In the rst scenario, i.e. 10% budget rise-up, the portfolio included the fourth and fth projects to be insourced and the third project to be outsourced. In the second scenario, i.e. 10% decline in budget, the second project should be insourced and the third project should be outsourced. As can be seen, the available budget plays a signicant role in the PPS
Table 8. The sensitivity analysis for the PPS problem. Budget
rise-up/decline
Projects portfolio
Targets deviation
Objective function
value
+10% (68.2) z3; x4; x5
Goal (1)= 100%
4.996 Goal (2)= 0%
Goal (3)= 30% Goal (4)= 0% Goal (5)= 40% Goal (6)= 100% Goal (7)= 50%
0% (62) x3; x4; x5
Goal (1)= 22.5%
5.529 Goal (2)= 90%
Goal (3)= 90% Goal (4)= 70% Goal (5)= 100% Goal (6)= 100% Goal (7)= 0%
-10% (55.8) x2; z3
Goal (1)= 100%
6.213 Goal (2)= 0%
Goal (3)= 70% Goal (4)= 50% Goal (5)= 80% Goal (6)= 100% Goal (7)= 16.7%
problem. In fact, the scenarios show that the portfolio consists of the projects that can fulll the given goals the best. This can be tracked for the states in which the budget increases up to 20% from its lowest to the highest bounds. The lowest value of the objective function is realized in the rst scenario which belongs to the budget rise-up. In this case, the weighted sum of inappropriate deviations is at the minimum possible value. On the contrary, in the budget decline state, the goals have been satised to a lower extent.
The results show that the portfolio eciency could be enhanced by incorporation of outsourcing option. The aforementioned scenarios yielded to the utilization of outer organization opportunities. In fact, this issue took place as the systematic constraints did not allow for thorough adoption of projects execution. Likewise, the projects were included in the portfolio which could utilize the given budget as much as possible, in addition to optimization of the weighted deviation values.
5. Conclusion remarks
PPS problem is a crucial step in project management and can directly aect the organization performance.
The selection should be carried out in such a way that organizations can obtain the highest benet from implementing compatible and inclusive projects. This issue makes more sense as organizations have to practice in competitive and uncertain conditions under a variety of restrictions. Consequently, it is required to apply ecient approaches to deal with the PPS problem. The projects should be compared and analyzed by dierent measures in order to set the optimum portfolio. This was achieved here by an integrated framework based on the BSC, in which the most inuencing criteria were rst determined by fuzzy DEMATEL and existing objectives were realized by a modied version of MCGP. In order to select an appropriate set of projects, two important issues were taken into consideration, including synergy of the projects and outsourcing options. Finally, the proposed model was applied in a pharmaceutical case to test its applicability in practice.
The proposed model can be developed in further studies with respect to dierent aspects. For instance, a potential future research direction is to develop more comprehensive models, in which the selection and scheduling phases are carried out simultaneously. In addition, the presence of multi skilled personnel and/or
multi-mode activities as well as application of dierent fuzzy aggregation methods can be investigated in the future studies.
References
1. Hashemin, S.S., Fatemi Ghomi, S.M.T. and Modarres, M. \Optimal constrained non-renewable resource allo-cation in PERT networks with discrete activity times", Scientia Iranica, 19(3), pp. 841-848 (2012).
2. Padhy, R.K. and Sahu, S. \A real option based six sigma project evaluation and selection model", Int. J. Project Manage, 29(8), pp. 1091-1102 (2011).
3. Yu, L., Wang S., Wen, F. and Lai, K.K. \Genetic algorithm-based multi-criteria project portfolio selec-tion", Ann. Oper. Res., 197(1), pp. 71-86 (2012).
4. Vetschera, R.V. and De Almeida, A.T. \A PROME-THEE-based approach to portfolio selection prob-lems", Comput. Oper. Res., 39, pp. 1010-1020 (2011).
5. Iniestra, J.G. and Gutierrez, J.G. \Multicriteria de-cisions on interdependent infrastructure transporta-tion projects using an evolutransporta-tionary-based framework", Appl. Soft Comput., 9, pp. 512-526 (2009).
6. Liu, S.S. and Wang, C.J. \Optimizing project se-lection and scheduling problems with time-dependent resource constraints", Autom. Constr., 20, pp. 1110-1119 (2011).
7. De Almeida, A.T. and Duarte, M.D. \A multi-criteria decision model for selecting project portfolio with con-sideration being given to a new concept for synergies", Pesquisa Operacional, 31(2), pp. 301-318 (2011).
8. Carazo, A.F., Gomez, T., Molina, J., Hernandez-Daz, A.G. and Guerrero, F.M. \Solving a comprehensive model for multi-objective project portfolio selection", Comput. Oper. Res., 37, pp. 630-639 (2010).
9. Stummer, C. and Heidenberger, K. \Interactive R&D portfolio analysis with project interdependencies and time proles of multiple-objectives", IEEE Trans. Eng. Manage., 50, pp. 175-83 (2003).
10. Pendharkar, P.C. \A decision-making framework for justifying a portfolio of IT projects", Int. J. Project Manage., 32, pp. 625-639 (2014).
11. Abbassi, M., Ashra, M. and Shari Tashnizi, E. \Selecting balanced portfolios of R&D projects with interdependencies: A cross-entropy based methodol-ogy", Technovation, 34(1), pp. 54-63 (2014).
12. Mojsilovic, A., Ray, B., Lawrence, R. and Takriti, S. \A logistic regression framework for information tech-nology outsourcing lifecycle management", Comput. Oper. Res., 34, pp. 3609-3627 (2007).
13. Tsai, W.H., Leu, J.D., Liu, J.Y., Lin, S.J. and Shaw, M.J. \A MCDM approach for sourcing strategy mix decision in IT projects", Expert Syst. Appl., 37, pp. 3870-3886 (2010).
14. Tseng, M.L. \Implementation and performance eval-uation using the fuzzy network balanced scorecard", Comput. Educ., 55, pp. 188-201 (2010).
15. Cho, C. and Lee, S. \A study on process evaluation and selection model for business process management", Expert Syst. Appl., 38, pp. 6339-6350 (2011).
16. Xu, Y. and Yeh, C.H. \An integrated approach to evaluation and planning of best practices", Omega, 40, pp. 5-78 (2012).
17. Khalili-Damghani, K., Sadi-Nezhad, S. and Tavana, M. \Solving multi-period project selection problems with fuzzy goal programming based on TOPSIS and a fuzzy preference relation", Inf. Sci., 252, pp. 42-61 (2013).
18. Bhattacharyya, R., Kumar, P. and Kar, S. \Fuzzy R&D portfolio selection of interdependent projects", Comput. Math. Appl., 62, pp. 3857-3870 (2011).
19. Chang, P.T. and Lee, J.H. \A fuzzy DEA and knapsack formulation integrated model for project selection", Comput. Oper. Res., 39, pp. 112-125 (2012).
20. Tavana, M., Khalili-Damghani, K. and Abtahi, A.R. \A fuzzy multidimensional multiplechoice knapsack model for project portfolio selection using an evolu-tionary algorithm", Ann. Oper. Res., 206(1), pp. 449-483 (2013).
21. Gutjahr, W.J., Katzensteiner, S., Reiter, P., Stummer, C. and Denk, M. \Multi-objective decision analysis for competence-oriented project portfolio selection", Eur. J. Oper. Res., 205, pp. 670-679 (2010).
22. Gabus, A. and Fontela, E., World Problems, an Invitation to Further Thought Within the Framework of DEMATEL, Switzerland, Geneva: Battelle Geneva Research Centre (1972).
23. Gabus, A. and Fontela, E., Perceptions of the World Problematique: Communication Procedure, Communi-cating with Those Bearing Collective Responsibility, 1, Switzerland, Geneva: Battelle Geneva Research Centre (1973).
24. Chuang, H.M. and Chen, Y.S. \Identifying the value co-creation behavior of virtual customer environments using a hybrid expert-based DANP model in the bicycle industry", Humcentric Computing & Inform. Sci., 5, pp. 1-11 (2015).
25. Chen-Yi, H., Ke-Ting, C. and Gwo-Hshiung, T. \MCDM with fuzzy DEMATEL approach for cus-tomers' choice behavior model", Int. J. Fuzzy Syst., 9, pp. 236-246 (2007).
26. Govindan, K., Khodaverdi, R. and Vafadarnikjoo, A. \Intuitionistic fuzzy based DEMATEL method for developing green practices and performances in a green supply chain", Expert Syst. Appl., 42, pp. 7207-7220 (2015).
27. Bokaei Hosseini, M. and Tarokh, M.J. \Type-2 fuzzy set extension of DEMATEL method combined with perceptual computing for decision making", J. Ind. Eng. Int., 9, pp. 1-10 (2013).
28. Zadeh, L.A. \Fuzzy sets", Inf. Control, 8, pp. 338-353 (1965).
29. Liu, P.D. and Jin, F. \The trapezoid fuzzy linguistic Bonferroni mean operators and their application to multiple attribute decision making", Scientia Iranica, 19(6), pp. 1947-1959 (2012).
30. Chang, B., Chang, C.W. and Wu, C.H. \Fuzzy DEMA-TEL method for developing supplier selection criteria", Expert Syst. Appl., 38, pp. 1850-1858 (2011).
31. Opricovic, S. and Tzeng, G.H. \Defuzzication within a multi-criteria decision mode", Int. J. Uncertainty, Fuzziness and Knowledge-Based Syst., 11, pp. 635-652 (2003).
32. Abbassi, M., Hosnavi, R. and Tabrizi, B. \Application of fuzzy DEMATEL in risks evaluation of knowledge-based networks", J. Opt., 2013, pp. 1-8 (2013).
33. Charnes, A., Cooper, W.W., Management Model and Industrial Application of Linear Programming, 1, Wi-ley (1961).
34. Tamiz, M., Jones, D. and Romero, C. \Goal program-ming for decision making: An overview of the current state-of-the-art", Eur. J. Oper. Res., 111, pp. 567-581 (1998).
35. Romero, C. \Extended lexicographic goal program-ming: a unifying approach", Omege, 29, pp. 63-71 (2001).
36. Chang, C.T. \Multi-choice goal programming", Ome-ga, 35, pp. 389-396 (2007).
37. Chang, C.T. \Revised multi-choice goal program-ming", App. Math. Modell., 32, pp. 2587-2595 (2008).
38. Chang, C.T. \Multi-choice goal programming with utility functions", Eur. J. Oper. Res., 215, pp. 439-445 (2011).
39. Falatoonitoosi, E., Shamsuddin, A. and Shahryar, S. \Expanded DEMATEL for determining cause and eect group in bidirectional relations", The Scientic World Journal, 2014, pp. 1-8 (2014).
Biographies
Babak H. Tabrizi nished his PhD in the current year (2016) in Industrial Engineering at the College of Engineering, University of Tehran, Iran, where he also received his MS in Industrial Engineering in 2010. Moreover, he received his BS in Industrial Management in 2008 from Shahid-Beheshti University, Iran. He has published several books and papers in well-known journals and conferences. His research areas includes operations research, project management, and supply
chain management.
Seyed Ali Torabi is an Associate Professor in the School of Industrial Engineering, College of Engineer-ing, University of Tehran, Iran. He received his PhD in Industrial Engineering in 2004 from Amirk-abir University of Technology, Iran. He received his MSc and BSc in Industrial Engineering from Iran University of Science and Technology and Amirkabir University of Technology, respectively. He has pub-lished many papers in accredited journals, such as Transportation Research Part E: Logistics and Trans-portation Review, International Journal of Production Research, Journal of the Operational Research Society, Fuzzy Sets and Systems, Computers & Operations Research, and European Journal of Operational Re-search.
Dr. Torabi has had dierent academic experiences with well-reputed universities such as Brunel Business School and DeGroote School of Business. He is now cooperating with University of Tehran as the Head of Business Engineering Department in Project Management in Oil & Gas Industry for the graduate students. His research areas also include operations research, MCDM methods, project management, and logistics.
Seyed Farid Ghaderi has been an Associate Pro-fessor of Industrial Engineering in the College of En-gineering, University of Tehran, since 2001. He works as research deputy dean of industrial engineering in the Faculty of Engineering at University of Tehran. He also served as a member of Iran Power Market Regulatory Board from 2008 to 2010. Dr. Ghaderi is also originator and founder of Research Institute of Energy Planning and Management; he was CEO of the Institute from 2003 to 2007. He was also Vice President of the ICS Triplex 1999 and head of Standards Department Planning Bauru of Iran Ministry of Energy from 1989 to 1995.
Dr. Ghaderi's research interests include energy management, energy planning, energy modeling, elec-trical energy technologies, elecelec-trical energy demand and supply, energy economics, energy pricing, and energy eciency. He has also published more than 50 papers in many reputable journals such as: Energy, Energy Policy, Energy Conversion and Management, Optimization and Engineering, Applied Mathematics and Computation, and Renewable Energy and Applied Mathematical Modeling.