ISSN: 2252-8938, DOI: 10.11591/ijai.v7.i4.pp153-164 153
A Novel Optimization Algorithm Based on Stinging
Behavior of Bee
S. Jayalakshmi, R. AswiniDepartment of Computer Science and Engineering, IFET College of Engineering, Villupuram, India
Article Info ABSTRACT
Article history: Received Jul 20, 2018 Revised Sept 5, 2018 Accepted Sept 25, 2018
Optimization algorithms are search methods to find an optimal solution to a problem with a set of constraints. Bio-Inspired Algorithms (BIAs) are based on biological behavior to solve a real world problem. BIA with optimization technique is to improve the overall performance of BIA. The aim of this paper is to introduce a novel optimization algorithm which is inspired by natural stinging behavior of honey bee to find the optimal solution. This algorithm performs both monitor and sting if any occurrence of predators. By applying a novel optimization algorithm based on stinging behavior of bee, used to solve the intrusion detection problems. In this paper, a new host intrusion detection system based on novel optimization algorithm has been proposed and implemented. The performance of the proposed Anomaly-based Host Intrusion Detection System (A-HIDS) using a novel optimization algorithm based on stinging behavior of bee has been tested. In this paper, after an explanation of the natural stinging behavior of honey bee, a novel optimization algorithm and A-HIDS are described and implemented. The results show that the novel optimization algorithm offers some advantage according to the nature of the problem.
Keyword:
Anomaly detection Bio-Inspired Algorithms Host intrusion detection system Index Terms-Optimization algorithms
Stinging behavior
Copyright © 2018 Institute of Advanced Engineering and Science. All rights reserved. Corresponding Author:
S. Jayalakshmi,
Department of Computer Science and Engineering, IFET College of Engineering,
Villupuram, India.
Email: [email protected]
1. INTRODUCTION
Optimization is the process of getting the best result from the given circumstances. Design, construction and maintenance of engineering systems comprises of decision making both at the managerial and the technological level. Goals of such decisions are to minimize the effort required or to maximize the desired benefit. Needs of optimization is the most cost effective or highest attainable performance under the given constraints, by maximizing desired factors and minimizing undesired ones. The maximization is defined as to obtaining more result without cost. An optimization problem is the problem of finding the best solution from all feasible solutions. The optimization problems are knapsack problem, traveling salesman, vehicle routing problem, Job Shop Scheduling, etc.
An optimization algorithm is a process which is executed repeatedly by comparing various results until exact solution is found. There are two types of optimization algorithms. Deterministic Algorithms use specific order for changing one result to other. These algorithms are in used in some times and which is applied in engineering design problems. Stochastic Algorithms are achieving popularity due to certain properties with probabilistic translation rules.
The bio-inspired (biologically inspired) methods have several features and advantages compared to conventional optimization solvers and also to solve hard-to-define (in simple expressions), real-world problems. These bio-inspired methods have provided novel ways of problem-solving for practical issues in
traffic routing, networking, games, industry, robotics, civil, water resources and others fields. The needs to go for bio-inspired algorithm is finding the solution for complex optimization problem based on animal behavior. Biologically Inspired Systems are observing animal and human behaviors and Study biological structures. Acquired knowledge may help us mimic nature and develop better engineering systems and machines.
Bio-inspired computing is deal with complicated issues using computational methods. The objective is to produce informatics tools with enhanced robustness, flexibility, scalability and that can interface more effectively with humans. It is a multi-disciplinary process with based on Biology, Informatics, Cognitive Science, Computer Science and robotics. We study bio-inspired algorithms in security, computational intelligence, information retrieval, robotics, modeling and simulation, machine learning, and biology itself.
2. PROBLEM STATEMENT
Most of the contemporary computer security research work is based on Intrusion detection is a component of detection processes. It tries to identify if a host is under attack or not. HIDS (host Intrusion Detection System) based on location from which it collects data and anomaly based HIDS (A-HIDS). The most popular approach for today's HIDS is still signature based. It performs intrusion detection by searching for content or sequence of bytes in a single packet. This approach works well if the pattern of attacks could be found in advance. This approach is reliable and has low false negatives rate for detecting known attacks. However, it cannot detect new attacks or mutation of known attacks because have not been discovered. Anomaly-based detection (A-HIDS) builds models of normal behavior in a system, and attempt to identify attacks on deviations from the normal network activities. Anomaly-based detectors can detect new and completely unknown attacks but may have high false positive rates.
3. PROPOSED SYSTEM
3.1. Bee Stinging Behaviour
Honey bees have three castes are queens, workers, and drones. Drones are male, while workers and queens are female. Queen bee will spend half period of her life for mating (i.e. Outside of hive) and remaining lifetime it lays eggs. It has stinger used to sting other queen bees during mating for dominance. Drone is used to find the queen bee only for mating, after mating it will be dead. It has no stinger. Workers develop in 21 days. Their duties change upon the bee age in the order (birth with cleaning out their own cell after eating through their capped brood cell) are feed brood, receive nectar, clean hive, guard duty, scout, onlooker and foraging (employed bee). Some workers employ in other functional behaviors, such as "undertaking" (removing corpses of their nest mates from inside the hive).
Honeybees attack only to protect their colony, but will also attack if they are continuously disturbed outside the nest. Typical sources of attack which motivation for honeybees to add alarm pheromone, vibrations, carbon dioxide, hair, and dark colors. Stinging is the eventual final act of a honeybee, because after that she will die. First the bee becomes alerted; she takes on a guarding stance and extends the sting that recruits other bees by generating alarm pheromone. Secondly, the bee will search for the origin of stimulus and conform towards it. Final one is she will attack; emitting a high pitched buzz sound and making body thrusts against the origin of disturbance. In such a protection activity, honeybees rarely pursue stimuli for long distances (pursue victims for hundreds of meters). If a sting occurs, then the bee will die soon, after stinging because the sting is left behind the predators and the bee eviscerate itself in flying away. Once the bee’s stinger is inside a victim, it pumps out more venom and release alarm pheromones. During this time, the stinging bee will spend its dying moments disturbing its victim by flying around its head as if it were going to sting (attack) again the victim. 3.2. Bee Stinging Behaviour
In this proposed algorithm, as it has already been mentioned, an algorithm based on the stinging behavior of honey bee is presented. The general steps of the proposed novel optimization algorithm based on bee stinging behavior are presented in Figure 1.
The proposed algorithm is novel optimization algorithm based on the stinging behavior of honey bee. The novel optimization algorithm based on stinging behavior of bee is a population based search algorithm inspired by the natural stinging behavior of honey bee. Bees are species that adapt to the environment easily, so organized society is generated. The hive of the honeybee protect from many predators(Insects) such as ants, wasps, and other hive bees are intruders, as well as many mammals are bears, skunks, mice, and humans. The attack behavior of bees is protective to certain stimuli that signal the colony is in danger.
A bee will rarely sting when it is away from the hive foraging on pollen, nectar or water and also a bee sting if it is handled roughly. Venom is generated from the worker's venom gland and that is stored in the venom sac, which is filled within 14 days after their birth. The age distribution of the bees in a hive is relevant,
and that colonies with many bees less than 2 weeks, whose venom sacs are not yet filled, it show relatively little defensive behavior. A worker stings another bee to without injury to sting, but if worker stings into any other thicker skin get died.
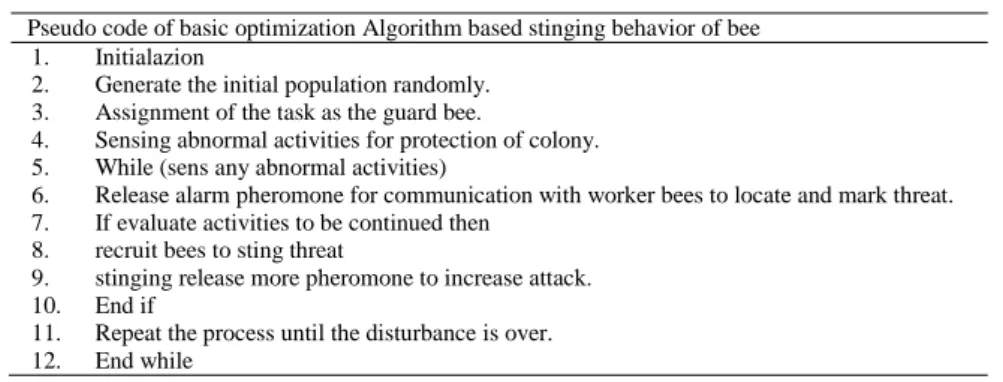
Pseudo code of basic optimization Algorithm based stinging behavior of bee 1. Initialazion
2. Generate the initial population randomly. 3. Assignment of the task as the guard bee.
4. Sensing abnormal activities for protection of colony. 5. While (sens any abnormal activities)
6. Release alarm pheromone for communication with worker bees to locate and mark threat. 7. If evaluate activities to be continued then
8. recruit bees to sting threat
9. stinging release more pheromone to increase attack. 10. End if
11. Repeat the process until the disturbance is over. 12. End while
Figure 1. Pseudo code of basic optimization algorithm based stinging behavior of bee
In the basic algorithm, the first step of the algorithm starts by worker bees being placed randomly in search space. The second step of the algorithm is assigning the duties to each and every worker bees. The worker bee contains many duties like nursing bee, hive cleaning, foraging, guard duty, etc. the algorithm mainly based on guard bees to protect the hive. The guard bees are used to protect the hive, queen and themselves from intruders (insects), mammals and other bees (robbing bees). The third step of the algorithm is based on the guard duty which is used to protect hive, queen, food and themselves. It is randomly checking any abnormal activities done form the outside of colony. If any abnormal activities are done then the guard bees are releases alarms pheromones to recruit the other bee to attack the intruders. All the bees are located and marker the intruders based on some identification like hair, smell, color, etc. If the process is continued simultaneously then sting the intruder which emits pheromone to recruit all bees to sting the intruders (i.e. increase the attacks). The process is continued until the intruder is stopped disturbance or move away from the colony.
The first step to our model is describes hunting behavior. Worker bees duties change upon the bee age in the order (birth with cleaning out their own cell after eating through their capped brood cell) are feed brood, receive nectar, clean hive, guard duty, scout, onlooker and foraging (employed bee). Some workers employ in other functional behaviors, such as cleaning corpses of their nest mates from inside the hive. The initial state of all worker bee is the state ‘decided’ U(t), means that they are doing their duties continuously. If such an decided worker bee meets a living prey animal in its surrounding environment, it stings (thus kills) this prey and thus becomes a stinger worker bee (S(t)) for some time (τStingers). After this time period it stops stinging and becomes an decided worker bee U(t) again. Assumed that the higher the spatial density of prey is expressed by variable Ψ(t)-the faster decided worker bee encounters a living prey item and the faster it is recruited to the stinging task. This process of recruitment R for stinging is therefore modeled as the following Equation 1,
R = αStingers ⋅ Ψ(t) ⋅ U(t) (1)
whereby αStingers is the recruitment rate of decided worker bees to stingers. The abandoning from the stinging task is expressed by βStingers (t) modeled as the following Equation 2, whereby.
βStingers= 1 τ⁄ Stingers (2)
βStingers(t)is the abandonment rate of stinging worker bees. These considerations finally lead to
Equation 3, which describes the dynamics of the stinger worker bee task group
dS
dt= αStingers . Ψ(t). U(t) − βStingers. S(t) (3)
As consider worker bee population as being a closed system, it can model the dynamics of the decided worker bee by the following Equation 4, whereby nHunters expresses the total number of hunting ants and U(t) expresses the number of decided worker bee:
The number of worker bee that engage in the hunting task in the full colony population (nColony) depends on the colony size. Even smaller colonies have a higher number of workers engaging in hunting than larger colonies modeled as the following Equation 5.
nHunters= nColony.
0.0795
nColony0.1309−1.22 (5) 3.3. Flowchart for Proposed System
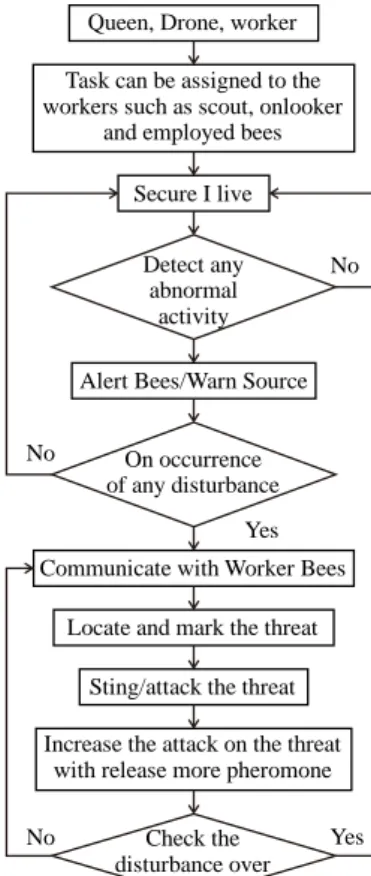
The below flow chart represent how bees are protect their hive by using stinging behavior is used in optimization algorithm to improve the performance of the bio-inspired algorithm. Worker bees duties change upon the bee age in the order (birth with cleaning out their own cell after eating through their capped brood cell) are feed brood, receive nectar, clean hive, guard duty, scout, onlooker and foraging (employed bee). Some workers employ in other functional behaviors, such as cleaning corpses of their nest mates from inside the hive. This section describes about stinging behavior of bee. In Honey bee colony, guard bees are monitoring the entrance to their hive for intruders. Guard bees are sting for three reasons. First one is intruders, Honey bees behave defensively when intruder are near. While monitoring, if guard bees are find intruder for example prey, then it will signal the intruder and also release alarm pheromone to other bees. If the process is continued, then it will sting the intruder.
Queen, Drone, worker Task can be assigned to the workers such as scout, onlooker
and employed bees Secure I live
Detect any abnormal
activity Alert Bees/Warn Source
On occurrence of any disturbance No
No
Yes Communicate with Worker Bees
Locate and mark the threat Sting/attack the threat Increase the attack on the threat
with release more pheromone Check the disturbance over
No Yes
Figure 2. Flow chart of the proposed algorithm
Second one is other hive bees; guard bees are won’t allow other hive bee because they will rob honey, pollen and nectar. They identify the other hive bees based on pheromone (i.e each hive contains a unique pheromone) by using guard bees’ sensing antennas. If other bees are continued to enter the hive then they will sting other bee.
Third one is to protect our self from any other while gathering pollen and nectar. Honey bees are capable to sting only once. Because stingers consist of barbs and are attached to the worker’s intestine, they detach from the stinging bee’s body after attacking a victim. After stinging, honey bee will die soon after transferring its venom; pheromones released at the time of attack will alarm and stimulate other worker bees to attack described in the Figure 2.
4. PERFORMANCE EVALUATION 4.1. Intrusion Detection System
Intrusion is the set of actions that attempts to compromise integrity, confidentiality or availability of network resources; while an intruder is any user or group of users who initiates such intrusive action. An Intrusion Detection System is engineered to generate an alert when it observes potentially malicious traffic. It monitors packets from network connections and determines if it is an intrusive activity or not. Once an intrusion is detected, the IDS simply performs one of the following actions: (a) Logs in a message into system audit file to be later analyzed by network security experts, (b) Send email alert to a network administrators, and (c) Stops such connection to end an intruder's attack (as placed under Intrusion Prevention System) amongst many other functions.
Intrusion Detection Systems (IDS) are security tools that provided to strengthen the security of communication and information systems. This approach is similar to other measures such as antivirus software, firewalls and access control schemes. It is divided into an anomaly detection system and signature detection system [3]. The signature based detection identifies traffic data which is to be dangerous attack where anomaly detection compares activities against a normal behavior. Hybrid intrusion detection systems combine the techniques of both these approaches. Each technique has its own advantages and disadvantages. The advantage of anomaly detection system as follows. Firstly, they are capable of detecting insider attacks. For example if any user is using any stolen account and perform such actions that are beyond normal profile of the user, an alarm will be generated by the anomaly detection system. Secondly, the detection system is based on custom made profiles. It becomes very difficult for an attacker to carry out any activity without setting off an alarm. Finally, it can detect the attacks that are previously not known. Anomaly detection systems look for anomalous events rather than the attacks.
Many HIDS employ techniques for both signature and anomaly based IDS. Signature based HIDS can only derive from well known attacks, whereas anomaly IDS can derive from both unknown and known attacks. Based on this reason, I have chosen the anomaly technique in the proposed system. Basically, the anomaly intrusion detection technique can be categorized into three categories: 1) statistically based, 2) knowledge based. The traditional detection method is also as called behavioral or statistical anomaly detection. It selects key data about network traffic as behavior to recognize the regular activities [1]. Another anomaly technique is knowledge based anomaly detection which compromise of set of rules. These set of rules are the basis of the desired model that determine the system behavior [2].
Anomaly detection is also called a hybrid detection system. It is a method to detecting the patterns in a data knowledge whose activity is not natural on certain condition. These unexpected behaviors are also termed as anomalies or outliers. The anomalies are not always considered as an attack but it identifies abnormal behavior which is previously not known. It may or may not be harmful. The anomaly detection provides very significant and critical information in various applications, for example Credit card thefts or identity thefts [4]. Mining techniques are used to analyzing the data by predict relationship between data. These include clustering, classification and machine based learning techniques. Hybrid approaches are also being created in order to attain higher level of accuracy on detecting anomalies. In this approach the authors try to combine existing data mining algorithms to derive better results. Thus detecting the abnormal or unexpected behavior or anomalies will yield to study and categorize it into new type of attacks or any particular type of intrusions.
4.2. Basic Methodology of Anomaly Detection Technique
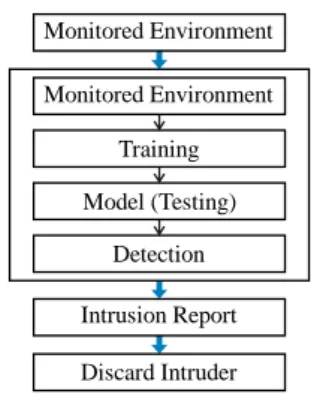
Although different anomaly approaches exists, as shown in Figure 3 parameter wise train a model prior to detection.
1. Parameterization: Pre processing data into a pre-established formats such that it is acceptable or in accordance with the targeted systems behavior.
2. Training stage: A model is built on the basis of normal (or abnormal) behavior of the system. It can be both manual and automatic.
3. Detection stage: It is compared with the pre defined observed traffic activities with available data. If the deviation found exceeds (or is less than when in the case of abnormality models) from a pre defined threshold then an alarm will be triggered.
Monitored Environment Training Model (Testing)
Detection Intrusion Report Discard Intruder Monitored Environment
Figure 3. Methodology of Anomaly Detection
4.3. OABBS Algorithm for A-HIDS
The proposed algorithm for anomaly based host intrusion detection system (A-HIDS) which is based on a novel optimization algorithm based on stinging behavior of bee. The proposed algorithm is used to find the malicious node and discard the malicious node. The proposed algorithm mimics the guard duty of honey bee for monitoring and stinging behavior of honey bee for find and discard malicious node. Let ‘X’ be the population of ‘I’ individuals packets (indiv1, indiv2, indiv3,…indivn). The proposed algorithm consist of three main steps of monitoring the host, finding malicious node, and discard malicious node which is described in the Figure 4.
In the monitoring phase, Initialize the ‘Xn’ population and ‘Dn’ generated detectors randomly whereby ‘n’ is the number of packet. The ‘Dn’ detectors monitoring the host and incoming ‘n’ packets (n=1, 2, 3,…wb) and ‘T’ is the total number of detectors. The detector finds the malicious node based on the malicious node. The formula for ‘threshold value’ and m is the number of generated detectors.
Threshold value =∑mi=0fitness of detector
m (6)
In finding the malicious node phase, let ‘maxthershold’ is the maximum threshold value and ‘threshold’ is the initial threshold value. If initial threshold value of the packet is greater than maximum threshold value then it will find the malicious node through that value. The threshold value is set or increased based on the anomaly behavior. Furthermore, comparing the normal behavior and anomaly behavior from host ‘H(n)’ whereby ‘H(n)’ is the number of host. If all the condition is true (i.e found anomaly) then it will generate alarm ‘Aj’ to neighbor node ‘N(n)’ whereby ‘Aj’ is the number of alarm generated and ‘N(n)’ is the number of neighbor node.
In discarding the malicious node phase, based on the alarm to the neighbor node will find the malicious node ‘A(n)’ whereby ‘A(n)’ is the number of anomaly node. After finding the anomaly node, check the anomaly behavior is continued based on the threshold value. If it is reached the threshold value then recruit nearest neighbor node to the anomaly node and store new intrusion in the records. The nearest neighbor node will locate and mark anomaly node then discard the anomaly node from the network.
BEGIN
‘X’ be the population of ‘I’ individuals
X={indiv1, indiv2, indiv3,…indivn}
1. Initialize the population ‘Xn’ randomly for threshold=0, maxthershold, Aj, H(n), N(n), A(n), m, n=1, 2, 3,…wb
2. Initialize randomly generated detectors Dn 3. Set T=Total number of detectors
Threshold value =∑mi=0fitness of detector
m (7)
4. Repeat the step 7 until threshold < maxthershold 5. IF
4.1 Compare ((H(n)=normal)V(H(n)=anomaly))
4.2 If it is anomaly then produce a alarm Aj to neighbor node N(n)
4.3 Calculate threshold value by (1) based on Aj for Dn
6. END IF 7. WHILE
7.2 Check threshold value by step 2.
7.3 If the threshold value is satisfied by step 2, then 7.4 Assign Dn=new_intrusion
7.5 Recruit nearest N(n) for Anomaly node A(n) by (1) 7.6 Locate and mark the A(n)
7.7 Discard A(n)
7.8 Repeat until it continued by step 2 8. END WHILE
END
Figure 4. Optimization Algorithm Based on Bee Stinging (OABBS) for A-HIDS
4.4. Flowchart for A-Hids
Initialize the entire node and it is in monitored environment by checking the threshold value of incoming packet and comparing the normal and anomaly behavior.
If the entire condition is satisfied then it will generate the alarm otherwise it will allow packet to the host. If the threshold value of the packet is reached the maximum threshold value then recruit other nearest neighbor node by generating continuous alarm and also store it as a new intrusion. The neighbor nodes are located and mark the anomaly node. Finally discard the anomaly node form the network. This process is continued until the disturbance is stopped which is described in the Figure 5.
Initialization
Randomly Generated Detectors Monitored environment
Match with records
No
Yes Generate alarm
Allow packet
Activation threshold reached?
Yes Add to final detector set Intimate to neighbor node
Locate and mark node Discard malicious node
No
Figure 5. Flowchart of Optimization Algorithm Based on Bee Stinging (OABBS) for A-HIDS
5. EXPERIMENTAL RESULTS
In this section, to discuss our approach to evaluate the effectiveness of the proposed algorithm in detecting malicious activities in web server log files. Moreover, we examine the capability of the features that are extracted from log files to capture the properties of attributes that have been collected in Enhanced Custom Log file (ECL) files.
The proposed OABBS algorithm, three different algorithms including Real-valued Negative Selection (RNS), Artificial Bee Colony (ABC) and Support Vector Machine (SVM) algorithm are chosen to learn the dataset which is generated from the ECL log files.
Both SVM and ABC have been employed in network based IDSs. The reason that they are chosen is that, they proved to have high ability in detecting intrusion in the network based systems. Consider that, due to the independency of the detector system’s modules from the analysis and detection module, it is possible to change the algorithms employed in this part or use the combination of that algorithms as a new one.
In this section different kind of metrics are measured to evaluate the ability of the algorithms to learn the properties of the features of the data and also detecting the malicious activities. The results are presented for each algorithm in analysis and detection module.
Generally, four situations can be assumed corresponding the relation between the result of an analysis for a sample event and its actual nature in an IDS. These situations include: false positive (FP), if the analyzed event is not an attack, but it is classified as a malicious activity; true positive (TP), if the analyzed event is correctly classified as intrusion; false negative (FN), if the analyzed event is malicious, but it is classified as a normal activity in the system; and true negative (TN), if the analyzed event is correctly classified as a normal activity.
6. PERFORMANCE ANALYSIS
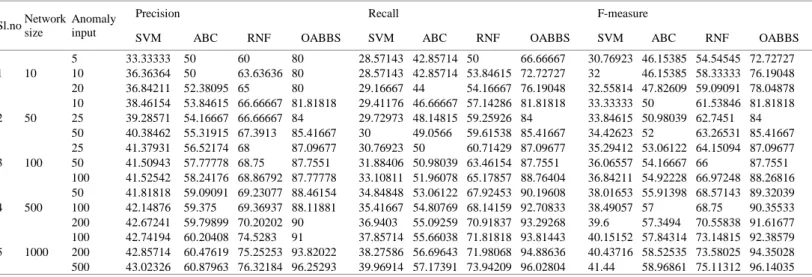
The performance of proposed system can be done using Precision, Recall, F-measure, Standard Accuracy Rate (SAR) and Fitness Value (FV). Precision, Recall, F-measure, SAR and FV of Optimization Algorithm Based on Bee Stinging (OABBS) compared with Real-valued Negative Selection (RNS), Artificial Bee Colony (ABC) and Support Vector Machine (SVM) and the comparison results are described in Table 2 and Table 3.
Precision (P) is the proportion of the predicted positive cases that were correct, as calculated using the Equation (6). Recall or Sensitivity or True Positive Rate (TPR) is the proportion of positive cases that were correctly identified, as calculated using the Equation (7). The F-Measure computes some average of the information retrieval precision and recall metrics. An arithmetic mean does not capture the fact that a (50%, 50%) system is often considered better than an (80%, 20%) system, as calculated using the Equation (8). Accuracy (AC) is directly proportion to the total number of predictions. It is determined using the Equation (9). Fitness value (FV) is required to determine the quality of certain classified as positive instances between the good and bad individuals, as calculated using the Equation (10).
Precision= TP/( TP + FP ) (8)
Recall= TP/( TP + FN ) F-measure=2 (Precision × Recall
Precision + Recall)
Standard Accuracy Rate= (TP+TN)/(TP+FP+TN+FN) Fitness Value= TP
TP+FN × TN
TN+FP (9)
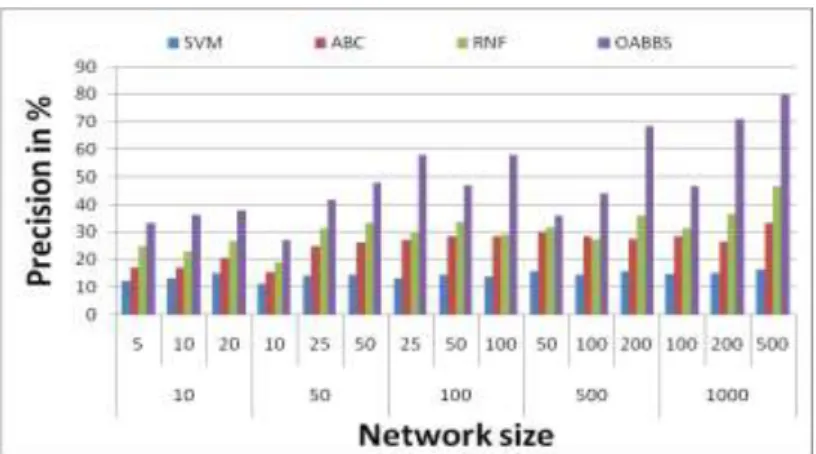
The precision graph represents the discussed measures for each of four algorithms where when ‘n’ number of attacks occurs every time the IDS alarm the user for attack. It is shown that the number of precision percentage in the proposed work (OABBS) increases compare to SVM, ABC, and RNF since it guarantees alerting the user at the correct time of attack. The proposed OABBS algorithm has the highest values for precision while producing the least false alarm. The algorithm performs more effectively in detecting malicious attack when compared to other algorithms which is described in the Figure 6.
Table 1. The alarm measures for each learning algorithms.
Table 2. The results of the efficiency measures for each four learning algorithms.
Table 3. The results of the efficiency measures for each four learning algorithms. Sl.no Network
size
Anomaly input
SAR FV
SVM ABC RNF OABBS SVM ABC RNF OABBS 1 10
5 35.71429 41.66667 50 62.5 12.2449 17.14286 25 33.33333 10 37.03704 41.66667 50 66.66667 13.18681 17.14286 23.07692 36.36364 20 40.81633 45.45455 52.63158 68.96552 15.16667 20.84211 27.08333 38.09524 2 50
10 33.33333 41.66667 50 71.42857 11.31222 15.55556 19.04762 27.27273 25 38.57143 50 56.81818 75.75758 14.41441 25.12077 31.37255 42 50 38.46154 51.02041 58.13953 78.125 14.5 26.16352 33.31448 48.04688 3 100
25 36.23188 52.08333 56.81818 81.39535 13.33333 27.27273 30.35714 58.06452 50 38.09524 53.19149 59.52381 80.64516 14.54361 28.45417 33.71394 47.25275 100 37.31343 53.47594 58.13953 82.64463 14.07095 28.73126 29.33036 58.2514 4 500
50 40 54.94505 60.24096 81.96721 15.94761 30.3207 31.69811 36.07843 100 38.02281 53.76344 58.82353 84.03361 14.58333 28.74062 27.49573 44.33877 200 39.84064 53.0504 63.29114 87.7193 15.94432 27.71739 36.05017 68.51181 5 1000
100 38.75969 53.76344 63.29114 86.95652 15.07869 28.52594 31.42045 46.90722 200 39.10615 52.63158 65.14658 90.90909 15.34134 26.53102 36.71014 71.16477 500 40.58442 57.93103 69.86301 93.71429 16.49411 33.6071 46.83876 80.18836
The recall graph represents the discussed measures for each of four algorithms where when ‘n’ number of attacks occurs. The SVM and RFN are performing quite the same and they can excel the ABC algorithm in detecting attacks correctly and not producing incorrect alarms. The proposed OABBS algorithm has the highest Sl.no Network
size
Anomaly input
ABC RNF SVM OABBS
TP FP TN FN TP FP TN FN TP FP TN FN TP FP TN FN
1 10 5 2 4 3 5 3 3 2 4 3 2 2 3 4 1 1 2
10 4 7 6 10 6 6 4 8 7 4 3 6 8 2 2 3
20 7 12 13 17 11 10 9 14 13 7 7 11 16 4 4 5
2 50 10 5 8 5 12 7 6 3 8 8 4 2 6 9 2 1 2
25 11 17 16 26 13 11 12 14 16 8 9 11 21 4 4 4 50 21 31 29 49 26 21 24 27 31 15 19 21 41 7 9 7 3 100 25 12 17 13 27 13 10 12 13 17 8 8 11 27 4 8 4 50 22 31 26 47 26 19 24 25 33 15 17 19 43 6 7 6 100 49 69 51 99 53 38 47 49 73 33 27 39 79 11 21 10 4 500 50 23 32 27 43 26 18 24 23 36 16 14 17 46 6 4 5
100 51 70 49 93 57 39 43 47 77 34 23 36 89 12 11 7 200 99 133 101 169 119 80 81 97 139 59 61 57 153 17 47 11 5 1000 100 53 71 47 87 59 39 41 47 79 27 21 31 91 9 9 6
200 111 148 99 179 127 83 73 97 149 49 51 58 167 11 33 9 500 259 343 241 389 263 169 241 197 332 103 178 117 411 16 81 17
Sl.no Network size
Anomaly input
Precision Recall F-measure
SVM ABC RNF OABBS SVM ABC RNF OABBS SVM ABC RNF OABBS
1 10
5 33.33333 50 60 80 28.57143 42.85714 50 66.66667 30.76923 46.15385 54.54545 72.72727 10 36.36364 50 63.63636 80 28.57143 42.85714 53.84615 72.72727 32 46.15385 58.33333 76.19048 20 36.84211 52.38095 65 80 29.16667 44 54.16667 76.19048 32.55814 47.82609 59.09091 78.04878 2 50
10 38.46154 53.84615 66.66667 81.81818 29.41176 46.66667 57.14286 81.81818 33.33333 50 61.53846 81.81818 25 39.28571 54.16667 66.66667 84 29.72973 48.14815 59.25926 84 33.84615 50.98039 62.7451 84 50 40.38462 55.31915 67.3913 85.41667 30 49.0566 59.61538 85.41667 34.42623 52 63.26531 85.41667 3 100
25 41.37931 56.52174 68 87.09677 30.76923 50 60.71429 87.09677 35.29412 53.06122 64.15094 87.09677 50 41.50943 57.77778 68.75 87.7551 31.88406 50.98039 63.46154 87.7551 36.06557 54.16667 66 87.7551 100 41.52542 58.24176 68.86792 87.77778 33.10811 51.96078 65.17857 88.76404 36.84211 54.92228 66.97248 88.26816 4 500
50 41.81818 59.09091 69.23077 88.46154 34.84848 53.06122 67.92453 90.19608 38.01653 55.91398 68.57143 89.32039 100 42.14876 59.375 69.36937 88.11881 35.41667 54.80769 68.14159 92.70833 38.49057 57 68.75 90.35533 200 42.67241 59.79899 70.20202 90 36.9403 55.09259 70.91837 93.29268 39.6 57.3494 70.55838 91.61677 5 1000
100 42.74194 60.20408 74.5283 91 37.85714 55.66038 71.81818 93.81443 40.15152 57.84314 73.14815 92.38579 200 42.85714 60.47619 75.25253 93.82022 38.27586 56.69643 71.98068 94.88636 40.43716 58.52535 73.58025 94.35028 500 43.02326 60.87963 76.32184 96.25293 39.96914 57.17391 73.94209 96.02804 41.44 58.96861 75.11312 96.14035
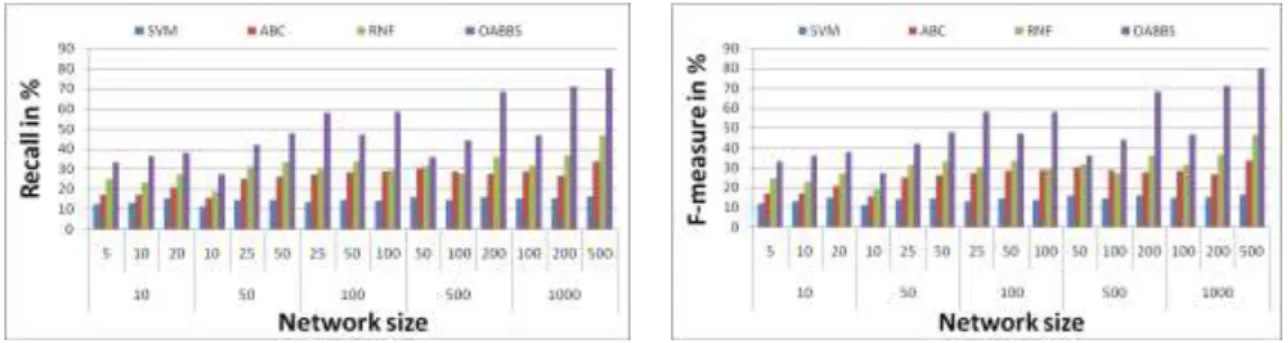
values for recall while producing the least false alarm. It is shown that the number of recall percentage in the proposed OABBS algorithm has highest value in compare to SVM, ABC, and RNF. The algorithm performs more effectively in detecting malicious attack when compared to other algorithms which is described in the Figure 7.
Figure 7. Recall of OABBS on Comparison with SVM, ABC and RNF
Figure 8. F-measure of OABBS on Comparison with SVM, ABC and RNF
However, the Figure 8 shows that the false alarm rate generated by the ABC algorithm is slightly smaller compared to that of RFN. Moreover, the recall and the precision, and hence the F-measure corresponding to ABC exceed that of RFN. As a result, that the proposed OABBS algorithm is performing more effectively in detecting malicious activities compared to other three algorithms which is described in the Figure 8.
In additions, the proposed OABBS algorithm has the highest values for Standard Accuracy Rate (SAR) while producing the least false alarm. As a result, that the proposed OABBS algorithm is performing more effectively in detecting malicious activities compared to other three algorithms which is described in the Figure 9.
As suggested by this Figure 10, the SVM and RFN are performing quite the same and they can excel the ABC algorithm in detecting attacks correctly and not producing incorrect alarms. As a result, that the proposed OABBS algorithm is performing more effectively for fitness value in detecting malicious activities compared to other three algorithms.
Figure 9. SAR of OABBS on Comparison with SVM, ABC and RNF
Figure 10. FV of OABBS on Comparison with SVM, ABC and RNF
7. DISCUSSION
In this section we summarize the obtained results from the evaluation mechanism presented in previous sections. As discussed earlier, the execution time of the RNF is too higher than that of the ABC algorithm and SVM. Furthermore, we can see that the ABC is the fastest algorithm in building the normal model and detecting anomalies. Also, the proposed OABBS algorithm has a mediocre execution time.
The errors of the predicted values for the ABC algorithms are the highest among all three algorithms, indicating how ABC is performing poorly in predicting the values for sample data. RNF is performing more accurately in predicting the values corresponding to data samples. Finally, the SVM, with a slight difference from MLP, is performing quite powerfully in predicting the values for data samples.
On the other hand, from the efficiency point of view, the proposed OABBS algorithm is performing more powerfully in detecting anomalous behaviors with generating fewer mistaken alarms compared to other three learning algorithms. As the results of Table 2 suggest, the ability of the ABC and RNF are quite the same. Furthermore, we can conclude that the SVM algorithm is performing poorly in detecting attacks, although it is the fastest algorithm.
To sum up, from both the cost (execution time) and the efficiency points of view, the proposed OABBS algorithm can be selected as the best choice for the analysis and detection module among the other three algorithms discussed in this paper.
8. CONCLUSION
The proposed systems introduce a novel optimization algorithm based on the stinging behavior of honey bee to Anomaly based Host Intrusion Detection System (A-HIDS). The performance of the proposed Anomaly based Host Intrusion Detection System (A-HIDS) using novel optimization algorithm based stinging behavior of bee has been compared Real-valued Negative Selection (RNS), Artificial Bee Colony (ABC) and Support Vector Machine (SVM). The experimental result showed that the proposed method can outperform than exiting system and is suitable for the host intrusion detection
REFERENCES
[1] A. Lazarevic, V. Kumar and J. Srivastava. Intrusion detection: A survey, Managing Cyber Threats. Massive Computing. vol.5, pp.19-78, 2005.
[2] P. Garc__a-Teodoro, J. D__az-Verdejo, G. Marci_a-Fern_andez and E. V_azquez. Anomaly-based network intrusion detection: Techniques, systems and challenges, Computers & Security. vol.28, pp.18-28, 2009.
[3] Patcha A., Park J. M., An overview of anomaly detection techniques: Existing solutions and latest technological trends; Computer Networks; 51(12); 2007; p. 3448-3470.
[4] Chandola V., Banerjee A., Kumar V. Anomaly detection: A survey. ACM Computing Surveys (CSUR). 41(3); 2009; p. 15.
[5] Manish Dixit, Sanjay Silakari. “An Exhaustive survey on Nature Inspired Optimization Algorithm”. International Journal of Digital Contents and Applications. Vol.1, No.1 (2014), pp.9-20.
[6] P. Lucic and D.Teodorovic,“Bee system: Modeling Combinatorial Optimization Transportation Engineering Problems by Swarm Intelligence” Preprints of the TRISTAN IV Triennial Symposium on Transportation Analysis, Sao Miguel, Azores Islands, pp. 441-445, 2001.
[7] D. Teodorovic, and M. Dell'Orco, “Bee Colony Optimization-A Cooperative Learning Approach to Complex Transportation Problems,” Advanced OR and AI Methods in Transportation, pp. 51-60, 2005.
[8] S. Nakrani, and C. Tovey, “On Honey Bees and Dynamic Allocation in an Internet Server Colony,” Proceedings of 2nd International Workshop on the Mathematics and Algorithms of Social Insects, Atlanta, Georgia, USA, 2004. [9] C.S. Chong, M.Y.H. Low, A.I. Sivakumar, and K.L. Gay, “A Bee Colony Optimization Algorithm to Job Shop
Scheduling,” Proceedings of the 37th Winter Simulation, Monterey, California, pp. 1954-1961, 2006.
[10] H.F. Wedde, M. Farooq, and Y. Zhang, “BeeHive: An Efficient Fault-Tolerant Routing Algorithm Inspired by Honey Bee Behavior,” Ant Colony, Optimization and Swarm Intelligence, Eds. M. Dorigo, LNCS 3172, Springer Berlin, pp. 83-94, 2004.
[11] H. Drias, S. Sadeg, and S. Yahi, “Cooperative Bees Swarm for Solving the Maximum Weighted Satisfiability Problem”, IWAAN International Work Conference on Artificial and Natural Neural Networks, Barcelona, Spain, 318-325, 2006.
[12] D. Karaboga, “An Idea Based on Honey Bee Swarm for Numerical Optimization,” Technical Report-TR06, Erciyes University, Computer Engineering Department, Turkey, 2005.
[13] X.S. Yang, “Engineering Optimizations via Nature-Inspired Virtual Bee Algorithms,” IWINAC 2005, LNCS 3562, Yang, J. M. and J.R. Alvarez, Springer-Verlag, Berlin Heidelberg, pp. 317-323, 2005.
[14] D.T. Pham, E. Kog, A. Ghanbarzadeh, S. Otri, S. Rahim, and M. Zaidi, “The Bees Algorithm-A Novel Tool for Complex Optimisation Problems,” IPROMS 2006 Proceeding 2nd International Virtual Conference on Intelligent Production Machines and Systems, Oxford, Elsevier, 2006.
[15] H.A. Abbass, “A Single Queen Single Worker Honey-Bees Approach to 3-SAT,” (GECCO2001) the Genetic and Evolutionary Computation Conference, San Francisco, USA, 2001.
[16] M. Fathian, B. Amiri, and A. Maroosi, “Application of Honey-Bee Mating Optimization Algorithm on Clustering,” Applied Mathematics and Computation, 190(2), pp.1502-1513, 2007.
[17] D. Karaboga, B. Basturk, “On the Performance of artificial bee colony (ABC) algorithm”, Applied Soft Computing 8 (2008), Elsevier, pp. 687-697.
[18] Laiq Khan, IkramUllah, “Virtual Bees Algorithm Based Design of Damping Control System for TCSC”, Australian Journal of Basic and Applied Sciences, 4(1): 1-18, 2010
[19] FahimehAghazadeh, Mohammad Reza Meybodi, “Learning Bees Algorithm for optimization”, International Conference on Information and Intelligent Computing, IPCSIT vol.18, 2011.
[20] Konrad Diwold, Daniel Himmelbach, “Bonding as a Swarm: Applying Bee Nest-Stie Selection Behavior to Protein Docking”, GECCO’11, ACM 978-1-4503-0557-0/11/07, 2011.
[21] Magdalene Marinaki, YannisMarinakis, Constantin Zopounidis, “Honey Bees Mating optimization Algorithm for financial classification problem”, Applied Soft Computing 10 (2010), Elsevier, pp. 806-812.
[22] P. Victer Paul, N. Moganarangan, S. Sampath Kumar, R. Raju, T. Vengattaraman, P. Dhavachelvan, “Performance analyses over population seeding techniques of the permutation-coded genetic algorithm: An empirical study based on traveling salesman problems”, Applied Soft Computing, Elsevier, Volume 32, July 2015, pp. 383-402.
[23] M. Shanmugam, M.S. SaleemBasha, P. Victer Paul, P. Dhavachelvan and R. Baskaran, "Performance Assessment over Heuristic Population Seeding Techniques of Genetic Algorithm: Benchmark Analyses on Traveling Salesman Problems", International Journal of Applied Engineering Research (IJAER), Research India Publications, Volume 8, Number 10 (2013) pp. 1171-1184, ISSN 0973-4562.
[24] N. Moganarangan, R. Raju, R. Ramachandiran, P. Victer Paul, P. Dhavachelvan, V.S.K. Venkatachalapathy, “Efficient Crossover Operator for Genetic Algorithm with ODV based Population Seeding Technique”, International Journal of Applied Engineering Research (IJAER), Volume 9, Number 17 (2014), pp. 3885-3898. ISSN 0973-4562. [25] N. Pazhaniraja V. Priyadharshini P. Divya D. Preethi P. Victer Paul, "Bio Inspired Algorithm Based Web Service
Optimization-A Survey", International Journal of Applied Engineering Research (IJAER), Volume 10, Number 5 (2015), pp. 13231 -13242. ISSN 0973-4562.
[26] G.Kiruthiga, S.Krishnapriya, V. Karpagambigai, N.Pazhaniraja, P.VicterPaul,"SurveyOn Swarm Intelligence Based Optimization Algorithm", International Journal of Applied Engineering Research (IJAER), Volume 10, Number 7 (2015), pp. 18445-18457. ISSN 0973-4562.