Journal of Financial Economics 71 (2004) 205–238
Why are foreign firms listed in the
U.S. worth more?
$
Craig Doidge
a, G. Andrew Karolyi
b, Ren
e M. Stulz
!
b,*
a
Rotman School of Management, University of Toronto, Toronto, Ontario, Canada b
Fisher College of Business, Ohio State University, Columbus, OH 43210, USA Received 27 September 2001; accepted 24 October 2002
Abstract
At the end of 1997, foreign companies with shares cross-listed in the U.S. had Tobin’sq
ratios that were 16.5% higher than the q ratios of non-cross-listed firms from the same country. The valuation difference is statistically significant and reaches 37% for those companies that list on major U.S. exchanges, even after controlling for a number of firm and country characteristics. We suggest that a U.S. listing reduces the extent to which controlling shareholders can engage in expropriation and thereby increases the firm’s ability to take advantage of growth opportunities. We show that growth opportunities are more highly valued for firms that choose to cross-list in the U.S., particularly those from countries with poorer investor rights.
r2003 Elsevier B.V. All rights reserved.
$
We thank George Benston, David Brown, John Coffee, Steve Cosslett, Simeon Djankov, Eugene Fama, Gaston Gelos, Alan Hess, Cheol Eun, Mark Flannery, Ken Garbade, Charles Himmelberg, David Hirshleifer, Prem Jain, Jon Karpoff, Dong Lee, Craig Lewis, Karl Lins, Lubomir Litov, Rodolfo Martell, Ron Masulis, Jianping Mei, Darius Miller, Andy Naranjo, Vince Reinhart, Mark Roe, Sergei Sarkissian, Jim Shapiro, Andrei Shleifer, Bill Schwert, Michael Weisbach, Ingrid Werner, two anonymous referees, seminar participants at Emory University, the Federal Reserve Bank of New York, Harvard University, Indiana University, the Ohio State University, the University of British Columbia, the University of California at Los Angeles, the University of Chicago, the University of Florida, the University of Kentucky, the University of Minnesota, the University of Rochester, the University of Utah, the University of Washington, Rice University, and Vanderbilt University, and attendees at the Georgia Tech International Finance Conference, the World Bank Conference on Market Liberalization, the Stanford Law School Conference on International Cross-listings, and the Western Finance Association for helpful comments. Robin Greenwood from Harvard made excellent suggestions for the model included in this paper.
*Corresponding author. Tel.: +1-614-292-1970; fax: +1-614-292-2359. E-mail address:[email protected] (R.M. Stulz).
0304-405X/$ - see front matterr2003 Elsevier B.V. All rights reserved. doi:10.1016/S0304-405X(03)00183-1
JEL classification:F30; G15; G32
Keywords:International cross-listings; Valuation; Controlling shareholders; Governance
1. Introduction
Why is it that fewer than one in 10 large public companies from outside the U.S. choose to cross-list their shares on U.S. markets? Surveys of managers typically find that they perceive many benefits from listing in the U.S. In particular, they mention that it lowers their cost of capital, gives them access to foreign capital markets, increases their ability to raise equity, increases their shareholder base, makes their stock more liquid, and adds visibility, exposure, and prestige
(Mittoo, 1992; Fanto and Karmel, 1997). At the same time, the direct costs
associated with listing seem small in comparison to the benefits. These costs include the Securities and Exchange Commission (SEC) reporting and com-pliance requirements, as well as the legal costs and investment banking fees associated with the listing. In a number of cases, the direct initial costs have
even been picked up by the depositary banks.1 Given this apparent imbalance
between benefits and costs, why is it that we do not see more companies listing in the U.S.? How do firms that list in the U.S. benefit from listing? Are firms that cross-list worth more than firms that do not? And, do the managers and controlling shareholders of firms that do not list somehow fail to benefit from listing when other shareholders might?
To address these questions, we first compare the value of foreign firms listed in the U.S. to the value of foreign firms that are not listed in the U.S. Using the Worldscope database universe of firms, we find that firms listed in the U.S.
have a Tobin’s q ratio that is 16.5% higher than the q ratio of firms from the
same country that do not list in the U.S. We also examine the excess value of listed firms relative to other firms, which we call the ‘‘cross-listing premium.’’ The cross-listing premium depends on the type of listing a firm chooses. It reaches as high as 37% for companies that list on major U.S. exchanges, although it is much smaller for over-the-counter listings and private placements. The premium persists after controlling for a number of country-level factors and firm-specific characteristics.
Though considerable attention has been devoted to explaining the corporate
diversification discount (Lang and Stulz, 1994; Berger and Ofek, 1995), none has
been paid to the cross-listing premium for exchange-listed firms, which is about twice the size of the diversification discount. We provide a theory of why firms cross-listed in the U.S. are worth more and why not all firms choose to list in the U.S. This theory begins with the premise that since most large foreign companies are typically
controlled by large shareholders (La Porta et al., 1999), companies will choose to cross-list in the U.S. only if their controlling shareholders benefit from doing so. With our theory, controlling shareholders choose to concentrate their efforts on either expropriating as much of the firm’s resources as possible from minority shareholders or on increasing those resources by committing to limit their expropriation activities so that the firm can raise capital at a lower cost to exploit growth opportunities. Controlling shareholders that find it optimal to commit to limiting their expropriation are those of firms with valuable growth opportunities that cannot be financed internally or with riskless debt. The growth opportunities can only be financed if the external capital markets provide funds at a sufficiently low cost, but this will not occur if outside investors expect the controlling
shareholders to expropriate the firm’s cash flow without restraints.2 As a result,
controlling shareholders of firms with valuable growth opportunities take steps to commit to limiting their expropriation from minority shareholders and such firms have lower agency costs. If a firm does not have growth opportunities to finance, however, there is no reason for its controlling shareholders to commit to limiting their expropriation from minority shareholders because they have no need to access external capital markets.
We argue that cross-listing helps controlling shareholders commit to limit their expropriation from minority shareholders and increases the ability of firms to take advantage of growth opportunities. Since cross-listing is of greater benefit to firms with growth opportunities, we predict that cross-listing firms have higher growth opportunities than their peers that do not cross-list. Moreover, the growth opportunities of these cross-listed firms are likely to be more valuable not only because the firms are better able to take advantage of them, but also because a smaller fraction of firm resources is expropriated by controlling shareholders in firms that find it optimal to list. We find evidence consistent with these predictions.
The paper proceeds as follows. We first review the benefits and costs of cross-listing discussed in the literature. In Section 3, we present a simple model of our theory and use it to develop testable hypotheses. We present our data and sample in Section 4. In Section 5, we show that there is a cross-listing premium. We provide tests of our theory in Section 6. Conclusions follow in Section 7.
2. The benefits and costs of U.S. listing for foreign firms
Much of the existing literature on international cross-listings argues that the benefits stem from a lower cost of capital as the firm makes its shares more accessible to nonresident investors who would otherwise find it less advantageous to hold the shares because of barriers to international investment (Karolyi and Stulz, 2002).
2Stulz (1990) shows that agency costs of managerial discretion are negatively related to growth opportunities. The arguments in that paper can be extended to controlling shareholders.La Porta et al. (2002)show that equity is worth less in countries with lower investor protection because equity is priced to reflect the large private benefits the controlling shareholder can extract from the firm in such countries.
Empirical support for this global risk-sharing hypothesis relies on event-study tests that show that the announcement of a U.S. listing is accompanied by a significant abnormal return that is higher for firms from emerging markets and for listings on
the major exchanges.3For instance,Miller (1999)finds an abnormal return of 1.15%
on the announcement of a U.S. listing, but this abnormal return is 1.54% for a listing for a firm from an emerging marketand 2.63% for an exchange listing. There is a stock price run-up prior to a U.S. listing announcement, but the common stock of
firms that list underperforms after the listing. For instance,Foerster and Karolyi
(1999) document excess returns of 0.15% per week during the year preceding the
listing and0.14% per week during the year following the listing. These changes in
share values over the two years that surround a U.S. listing announcement make it difficult to infer from stock returns the magnitude of the net benefit to a U.S. listing, but there is little doubt that firms that list do benefit.
The hypothesis that firms list to achieve a lower cost of capital based on risk sharing with nonresident investors faces a number of difficulties. Consider, for example, the fact that cross-listing firms from countries that are substantially integrated with the U.S. market also have been shown to benefit, or the fact that listings have grown in number and have continued to generate positive announce-ment effects even as international capital markets have become more integrated. This hypothesis also suggests that if investment barriers are high enough, almost all firms from a country should cross-list, so it cannot explain why not all firms choose to do
so.Lee (2003) shows that the abnormal return on announcement of a cross-listing
does not fall as the number of cross-listings from a country increases, which he interprets as evidence against the global risk-sharing hypothesis. As a result of these difficulties, studies have proposed a number of other potential benefits and costs: 1. Risk premium reduction. If U.S. investors face obstacles in investing in a foreign
firm and if a U.S. listing for that firm reduces these obstacles, the risk of the firm becomes shared more widely following the listing provided that the cross-listing leads to an expansion of the firm’s shareholder base (Foerster and Karolyi, 1999). This greater risk-sharing reduces the risk premium investors require to hold the shares of the firm.
2. Access to more developed capital markets. By listing in the U.S., firms can issue securities in the U.S. Since the U.S. capital markets are deep and liquid, foreign
firms can raise funds atlower costthan athome.Lins etal. (2003)show that firms
that list in the U.S. become less credit-constrained in that their new investment depends less on their cash flow after the U.S. listing than before. With this benefit, firms that expect to have to raise funds would be more likely to list in the U.S. and firms that do not anticipate the need to raise funds would have no reason to list. 3. Information disclosure. U.S. capital markets typically require more disclosure than
the listing firms’ home capital markets. Models byCantale (1996),Fuerst(1998),
andMoel (1999)assume information asymmetry or information incompleteness
3SeeSwitzer (1986),Alexander etal. (1988),Foerster and Karolyi (1993, 1999),Jayaranam etal. (1993), andMiller (1999). See the survey byKarolyi (1998)for dozens of related references.
and establish a signaling equilibrium in which firms that list on markets with high disclosure standards establish that they are high-value firms.
4. Bonding and monitoring. Coffee (1999, 2002), Stulz (1999), and Reese
and Weisbach (2002) argue that a U.S. listing enhances the protection of the
firm’s investors and, consequently, reduces the agency costs of controlling shareholders. Compared to the rest of the world, investors are extremely well protected in the U.S. Foreign firms can obtain some of the benefits of the apparatus that protects investors in the U.S. by listing in the U.S. The extent to which they gain these benefits is high when they list on an exchange and lower for over-the-counter (OTC) listings or Rule 144a private placement issues. In particular, firms that list shares on a U.S. exchange are subject to many of the
same U.S. laws and regulations as U.S. firms.4In addition, firms that list in the
U.S. are also subjected to greater scrutiny and monitoring from the press and from the investment community, which further increases the protection of minority shareholders.
Which, then, are the most important benefits for listing firms? The argument that listing permits access to the deep and liquid U.S. markets applies probably better to the 1980s than to the 1990s and would apply to all firms that have to raise funds. Hence, this argument suggests that firms that list have growth opportunities, and it could explain the burst of listings in the 1990s if there were more firms with valuable growth opportunities. However, with this argument, the relevant listing costs are the same as with the risk-sharing argument, so that one would expect all firms to be highly likely to list. Further, the argument makes it hard to understand why firms list on OTC markets or by means of private placements, where there is less liquidity.
The higher disclosure standards of the U.S. are an important determinant of the listing decision for both the disclosure benefit and the bonding and monitor-ing benefit. The critical issue is where the cost of disclosure comes from. If we consider only the bonding and monitoring benefits, the cost of disclosure is borne by controlling shareholders and can be high if better disclosure makes it harder for them to expropriate cash flows. For the benefits associated with meeting higher disclosure standards, the costs are more diffuse and seem small.
The bonding and monitoring benefit exists because those who control corpora-tions pursue their own interests. Foreign firms are generally controlled by large shareholders. If it is costless for these large shareholders to expropriate from other investors in the firm, they will do so. By listing in the U.S., the large shareholders’ costs of expropriation increase, so that they expropriate from other investors less. The gain to controlling shareholders from taking an action that commits them to less expropriation from other investors is that they reduce the cost of outside capital, since the providers of that capital are less likely to see
4An appendix that provides references and more details on the criteria and scope of different types of listings is available from the authors upon request.
their investment expropriated. If a firm has no need of outside capital, the controlling shareholders do not benefit from committing to expropriate from other investors less. The controlling shareholders instead find themselves in a situation where they cannot expropriate from outside investors as much as otherwise and, therefore, receive fewer benefits of control than if they had not made such a commitment. Consequently, listing in the U.S. is expensive for controlling shareholders of firms with poor growth opportunities, but beneficial for controlling shareholders of firms with sufficiently valuable growth opportunities.
The bonding and monitoring benefit of listing exists even in perfectly integrated capital markets. The key for this benefit to exist is that investors in a firm become better protected if the firm lists in the U.S. The extent to which investors are better protected differs according to the home country of the firm since investor protection varies widely across countries. The bonding and monitoring benefit of listing will lead to more cross-listings when more firms have valuable growth opportunities. One can certainly argue that emerging market firms faced better growth opportunities in the 1990s than in the 1980s following the debt crisis early in the decade. Importantly, however, firms do not have to raise equity in the
U.S. to gain from the bonding and monitoring benefit.Reese and Weisbach (2002)
show that firms raise more equity at home following a U.S. listing precisely because minority shareholders are better protected. One would also expect that the greater disclosure required following a U.S. listing and the increased monitoring decrease firms’ costof debt.
But the extent to which investors in foreign firms listed in the U.S. benefit from U.S. laws and regulations is limited. First, the extent to which these laws and regulations apply depends on the type of listing a firm chooses. Their relevance is minimal for firms that use a Rule 144a offering or choose an OTC listing, although they apply extensively to firms that choose an exchange listing and even more so to firms with an exchange listing that elect to raise capital in the U.S. Second, shareholders of a foreign firm listed in the U.S. may face substantial obstacles in recovering damages awarded to them by a U.S. court if the firm’s assets in the U.S. are small relative to the damages (Siegel, 2003). Third, corporate governance in the U.S. depends on each state’s corporate law, but firms that list in the U.S. typically do not reincorporate in a U.S. state.
3. A simple model of the cross-listing decision and the cross-listing premium
A firm lists in the U.S. if its controlling shareholders find it advantageous to limit their expropriation from minority shareholders. In this section, we model the tradeoff that controlling shareholders face when deciding whether to list in the U.S. and we derive predictions about the cross-sectional variation in the cross-listing premium that we investigate in our empirical analysis. To model the tradeoff, we assume that the controlling shareholder has an exogenously determined cash flow or
equity ownership of k in the firm.5 As a benefit of controlling the firm, the
controlling shareholder diverts a sharef of the firm’s cash flowC to himself before
distributing the rest as dividends. Cash flows are normalized so that they correspond
to present values. Following La Porta, Lopez-de-Silanes, Shleifer, and Vishny
(LLSV, 2002), we assume that diversion has a deadweight cost decreasing in the level of investor protection and increasing in the fraction of cash flow diverted since one would expect that it is harder to hide large amounts of diversion relative to cash flow.
We denote by p the quality of investor protection that applies to the minority
shareholders of the firm if itdoes notlistin the U.S., where higher values of p
indicate better shareholder protection. To simplify the analysis, we assume that the
cost of diversion has a simple functional form that is quadratic in f and linearly
increasing in p: Itis given by 1
2bf2pC; where b is a constant. With this cost of
diversion function, the controlling shareholder receiveskðCfC1
2bf2pCÞ þfC: A number of mechanisms are available to controlling shareholders to bond themselves to lower consumption of private benefits without cross-listing the firm’s shares. In particular, they can work to develop a reputation for not extracting large personal benefits from control, they can use debt so that they are subject to monitoring from creditors, they can commit to a high disclosure policy, and they can
add outsiders to the board.6 These mechanisms are costly and may be ineffective
when investor rights are poorly protected. By listing in the U.S., the firm increases the quality of investor protection that applies to its minority shareholders and to its other providers of capital, thereby committing its controlling shareholders to limit their consumption of private benefits of control. For now, we assume that the degree
of investor protection increases topU:S:when the firm lists in the U.S. (regardless of
the type of listing), wherepU:S:>p:By listing in the U.S., the firm is able to finance
future growth opportunities worthz:For simplicity, we assume that if the firm does
not list, it cannot take advantage of these growth opportunities. The distribution of growth opportunities across firms is the same in each country and is given by a
uniform distribution over the intervalð0;zmaxÞ:This distributional assumption makes
it possible for us to make comparisons of firm values for different values of the
thresholdz:Without such an assumption, a number of results in our model would
5
Shleifer and Wolfenzon (2002)develop a model in which a controlling shareholder who derives private benefits from control chooses the fraction of cash flow rights he owns as the firm goes public. In their model, this fraction is negatively related to investor protection.Doidge (2001)shows that ownership concentration often falls with listing, which is consistent with this prediction. Making ownership of cash flow rights by the controlling shareholder endogenous would substantially complicate our analysis. The negative relation between ownership and investor protection would attenuate the impact of the effects we discuss since it would reduce the relation between the consumption of private benefits and investor protection, but it would also make listing more valuable for controlling shareholders because it would enable them to reduce their cash flow ownership because of the reduction in the agency costs of controlling shareholders brought about by the listing. Our results would still hold as long as the controlling shareholder’s private benefits from control are negatively related to the quality of investor protection, which is the case in the Shleifer and Wolfenzon model.
6Gomes (2000)models the reputation mechanism and draws empirical predictions from his model. His model implies that reputation is only valuable to firms whose financing requirements outstrip their ability to finance projects either internally, with bank debt, or with riskless debt.
not hold because it could be possible for the expected value of z; given that the
thresholdzis met, to be lower in a country wherezis higher. However, we would
still predict a cross-listing premium. The expected growth opportunity of firms
known to havez>z;wherezis a minimum threshold value ofz;is increasing with
z: Under our assumptions, the controlling shareholder favors cross-listing if the
present value of not listing and diverting optimally with quality of investor
protection p is less than the present value of listing and diverting optimally with
quality of investor protectionpU:S::To simplify the notation, we normalizeCandz
by assets in place.
The controlling shareholder chooses f by solving the following maximization
problem:
Maxf kðCfC21bf2pCÞ þfC: ð1Þ
The first-order condition is given by
kCbfpkCþC¼0; ð2Þ
which, upon rearranging terms, gives the optimal fraction of cash flows to divert,
f ¼1k
bpk : ð3Þ
This result is similar to the earlier results ofLLSV (2002),Shleifer and Wolfenzon
(2002), and others. It shows that higher cash-flow ownership by the controlling shareholder leads to greater incentives to distribute dividends in a nondistortionary way and hence to a lower level of optimal consumption of private benefits from
control for a givenp:Further, the optimal level of diversion is lower in countries with
better investor protection.
We can now examine this first-order condition to derive several testable implications of the model. If we substitute (3) into the original maximization problem (1) and rearrange, we get the total gain of the controlling shareholder,
kCþ1 2
ð1kÞ2
bpk C: ð4Þ
The first term represents the dividends received by the controlling shareholder. The second term corresponds to the net private benefits of control if the firm does
not list in the U.S., which we denote byvðpÞC where vðpÞ is a decreasing convex
function ofp:
If the firm lists in the U.S., the cash flowing to the controlling shareholder is
kðCþzÞ þ1 2
ð1kÞ2
bpU:S:k
ðCþzÞ ¼kðCþzÞ þvðpU:S:ÞðCþzÞ: ð5Þ
The controlling shareholder wants the firm to list its shares in the U.S. if (5) exceeds (4). This requires that
kzþvðpU:S:Þz>½vðpÞ vðpU:S:ÞC: ð6Þ
The left-hand side of this equation is the net benefit to the controlling shareholder from the growth opportunities the firm can exploit if it lists in the U.S. For given
pU:S:;the left-hand side increases with z: The right-hand side is the loss of private
benefits of control on the cash flowCfrom listing in the U.S. The larger thep;the
smaller is the net benefit of control for a given cash flow C; since vðpÞ falls as p
increases.
Eq. (6) implies that for givenpandpU:S:;there is az such that the firm lists if its
growth opportunities exceedzand does notlistifzoz;z is the threshold level of
future growth opportunities needed to justify the decision to list shares in the U.S. and itsatisfies z¼½vðpÞ vðpU:S:Þ kþvðpU:S:Þ C¼ ðpU:S:pÞð1kÞ 2 2bppU:S:k2þpð1kÞ2 C: ð7Þ
Now, if we differentiatez with respect top;we get
@z @p ¼ ð1kÞ2C 2bppU:S:k2þpð1kÞ2 ½2bpU:S:k 2þ ð1kÞ2ð pU:S:pÞð1kÞ2C ½2bppU:S:k2þpð1kÞ22 o0: ð8Þ
The first term in (8) is nonpositive and the second term is positive, which gives our firsthypothesis.
H1: Everything else equal, for a given level of investor protection after listing,pU:S:;
listed firms from a country with weaker investor protection are expected to have better growth opportunities than listed firms from a country with stronger investor protection, and the proportion of firms from a country that list in the U.S. increases with the country’s protection of investor rights.
We now examine the implications of this model for valuation, using Tobin’sqas
our valuation measure. The firm is valued from the perspective of a minority outside shareholder who does not receive any private benefits of control, and the firm’s value depends on whether its shares are listed or not:
q¼ CfC
1 2bf
2pC if the firm is not listed in the U:S:
CþzfU:S:ðCþzÞ 12bfU2:S:pU:S:ðCþzÞ if the firm is listed in the U:S:
(
ð9Þ
wherefU:S:is the fraction of cash flows diverted by the controlling shareholder once
the firm is cross-listed in the U.S. It follows from Eq. (3) that fU:S:of: If we
substitute the expression for the optimal fraction of diverted cash flows from (3), we get
q¼
C vðpÞð1þkÞ
kð1kÞ
C if the firm is not listed in the U:S:
Cþz vðpU:S:Þð1þkÞ
kð1kÞ
ðCþzÞ if the firm is listed in the U:S:
8 > > > < > > > : ð10Þ
As in LLSV (2002), other things being equal, firms in countries with better
investor protection should have a higher Tobin’sqand firms with better investment
opportunities should also have a higher Tobin’sq. The firstresultarises from the
valuation expression for domestic firms because controlling shareholders of domestic firms will expropriate less from minority shareholders if there is higher-quality shareholder protection, and the second result stems from the valuation expression for firms that list in the U.S.
The cross-listing premium,f;equals
f¼zþ 1þk
kð1kÞ½vðpÞCvðpU:S:ÞðCþzÞ: ð11Þ
Since the minority shareholders get a fraction ofz;the premium must be positive and
increases withz:
H2: Other things being equal, (a) for givenp andpU.S., firms that list in the U.S.
have higher Tobin’sqvaluations than those that do not list in the U.S.; and (b)
for givenpandpU:S:;the cross-listing premium increases withz:
The model can also be used to address how the firm’s home country investor protection affects the size of the premium. There are two components of the
premium: the gain due to growth opportunities and the gain due to a reduction inf:
The reduction inf is an increasing function ofpU:S::Suppose that all firms that list
have similar investor protection once they list. In this case, the loss of private benefits
for a givenzis greater for firms from countries with poorer investment protection.
With our assumption,vðpU:S:Þis constant. Therefore, the impact on the premium of
an increase inpis @f @p ¼ 1þk kð1kÞ @vðpÞ @p Co0 as @vðpÞ @p o0: ð12Þ
This result implies that the premium increases aspfalls and leads to a third testable
hypothesis.
H3: Other things being equal, a firm’s cross-listing premium is inversely related to the quality of investor protection that applies to the firm in its home country. From (6), we know that listed firms from countries with weak investor protection are expected to have better growth opportunities than listed firms from other
countries. Therefore,zis expected to be higher for listed firms from countries with
weak investor protection, which implies a higher expected premium for firms from these countries. This is because controlling shareholders from countries with poorer shareholder protection give up more when they commit to take on elements of the U.S. shareholder protection apparatus than controlling shareholders from countries with shareholder protection closer to the U.S. standards.
In our model, a dollar of growth opportunities has the same value as a dollar of cash flow. Therefore, if firms that are not listed were to have some growth opportunities, the value of a dollar of growth opportunities for minority
shareholders would be the same as the value of a dollar of cash flow for these firms, given (8) above. It immediately follows that a dollar of growth opportunities for a non-listed firm is worth less than a dollar of growth opportunities for
cross-listed firms. In addition, whenpU:S:is the same regardless of the country of origin of
a firm, the difference between the value of a dollar of growth opportunities if the firm does not list and a dollar of growth opportunities if the firm does list is expected to
fall withp:This reasoning leads to the following hypothesis.
H4: Firm value increases more with growth opportunities for firms that list in the U.S. than firms that do not and this differential increase in firm value is higher for firms from countries with poorer investor protection.
So far, we have assumed that the quality of investor protection for listed firms is
the same for all firms,pU.S.. As discussed earlier, however, notall U.S. listings are
equal. Investor protection increases the most through a listing on an exchange with a simultaneous equity issue and increases the least with a Rule 144a private placement or an OTC listing. This means that the quality of investor protection of the listed firm is higher for firms listing on an exchange and lower for other types of listings,
even for firms from the same home country with level of shareholder protectionp.
The quality of investor protection obtained by a firm through a listing in the U.S. may also depend on characteristics of the country the firm comes from and on the nature of the firm’s activities. For instance, one would expect firms with significant assets in the U.S. to achieve a higher quality of investor protection when they list in the U.S. because it is easier to enforce U.S. legal decisions against those firms. Eq. (8) shows that the growth opportunities threshold decreases as the investor protection gain falls. Consequently, the growth opportunities that justify listing on an exchange are higher than for a Rule 144a private placement or OTC listing. Therefore, we predict that firms listing on an exchange have higher growth opportunities than those using a Rule 144a private placement or OTC listing. Further, if a firm lists on an exchange, the controlling shareholder sees more of a reduction in private benefits. From this argument, we obtain our final hypothesis
H5: Other things being equal, the greater the increase in investor protection through the type of U.S. listing, the higher is the cross-listing premium. Firms that list shares on a U.S. exchange and firms that issue equity in the U.S. will have a higher cross-listing premium than those that list in the U.S. using a Rule 144a private placement or an OTC listing.
The next several sections evaluate hypotheses H1–H5 empirically.
4. Data
To conduct our study, we need data for firm values as well as country characteristics related to investor protection, capital market accessibility, accounting standards, and aggregate market liquidity. We use data on firms from Worldscope
for 1997. The Worldscope database covers over 24,000 public companies in more than 50 developed and emerging markets, representing more than 96% of the market value of the world’s publicly traded companies. We use measures of shareholder
rights and legal enforcement of LLSV (1998) to control for the degree to which
investors are protected in a country. Their measures are available for countries that have at least five publicly traded firms for which ownership data are available. They exclude countries from the former Soviet bloc. We include all firms in the Worldscope universe in 1997 for the countries for which their measures are available. This gives us 11,757 firms from 40 countries. Of these firms, 1,167 are cross-listed in the U.S. Listing information was obtained from the Bank of New York’s 1996
Global Offerings of Depositary Receipts:A Transaction Guideand was supplemented and cross-checked with data obtained from the NYSE, Nasdaq, OTCBB, and the September 2000 edition of the National Quotation Bureau’s Pink Sheets. Those firms that changed listing location in the U.S. (for example, from Rule 144a private placement to exchange listing) or those that subsequently raised capital are assigned to the class of listing according to their status as of December 31, 1997. There are more cross-listed firms than those contained in the Worldscope universe, but we could not obtain valuation data for these firms.
The valuation measure we use is Tobin’s q, computed as follows. For the
numerator, we take the book value of total assets, subtract the book value of equity, and add the market value of equity. For the denominator, we use the book value of total assets. All variables are in local currency, although it makes no difference if we use local currency or U.S. dollars since the numerator and denominator are denominated in the same currency. After eliminating the firms for which data are not
available to computeq;we are left with 955 cross-listed firms and 7,725 that are not.
Ourq estimate does not attempt to use replacement cost in the denominator and
does not use the market value of debt in the numerator. It is difficult to avoid these simplifications in a dataset that spans 40 countries. It is also difficult to determine ex
ante how an imperfectly measuredqwill affectour analysis. If rapidly growing firms
are most likely to cross-list, they are also the most likely to have recently acquired assets and will tend to have a relatively high book value of assets. This will lead to a
lower marginalqmeasure and is, therefore, likely to bias our tests against finding a
cross-listing premium.7
Since we investigate how country characteristics affect the cross-listing premium,
we have to compare estimates ofqacross countries. Firms listed on U.S. exchanges
have to provide accounting information that follows U.S. Generally Accepted Accounting Principles (GAAP). However, Worldscope provides firm data using local GAAP even when U.S. GAAP is available. Though attempts are made by Worldscope to make the data consistent across countries, such an effort has obvious
limitations. Differences in accounting practices across countries can increase q in
some countries relative to other countries. Many countries allow firms to hide reserves, so that their assets are understated. At the same time, some countries capitalize R&D, while others do not. The capitalization of R&D increases the
denominator ofq and consequently decreases q:Because of the concern about the possible biases introduced by differences in accounting practices, we also estimate the cross-listing premium within countries.
To make firms across countries more comparable, we eliminate those in the financial sector and require them to have total assets in excess of $100 million. This leaves 5,272 firms, 778 of which are cross-listed. A difficulty with Worldscope is that the database became more comprehensive rapidly during the 1990s. This makes it difficult for us to use historical data without reducing our sample size sharply. As a compromise, we require firms to have three years of sales data so that we can compute a reasonably stable measure of two-year sales growth. After imposing this requirement, we have 4,790 firms, including 4,078 that are not listed in the U.S. We also perform the empirical analysis using all firms with assets of $10 million or more. The key results are not affected, but some coefficients that are unrelated to our
hypotheses, and some of thet-statistics of the coefficients that are important to our
analysis are much larger. Japan has a large number of firms compared to other countries. We therefore repeat the analysis without Japan and the key results are unaffected.
We use three country-level variables obtained from LLSV (1998). They are
dummy variables associated with a country’s legal origins, an index of anti-director
rights, and an index of judicial efficiency.LLSV (1998)assign each country to one of
four legal traditions: common law, French civil law, German civil law, and Scandinavian civil law. Their anti-director rights index aggregates six different shareholder rights: (1) the right of shareholders to mail their proxy, (2) the right of shareholders not to have to deposit shares ahead of the shareholder meeting, (3) cumulative voting or proportional representation of minority shareholders on the board of directors, (4) an oppressed minorities mechanism in place, (5) the right of shareholders who represent less than 10% of share capital to call an extraordinary meeting, and (6) preemptive rights that can only be waived by a shareholder’s vote. The index is constructed by giving one point for each right, so that it can take a value from 0 to 6. The next variable is an index of judicial efficiency. This index produces a rating of the ‘‘efficiency and integrity of the legal environment as it affects business, particularly foreign firms.’’ It takes values from 0 to 10 and judicial efficiency improves with the score. The index is produced by Business International
Corporation andLLSV (1998)use the average from 1980 to 1983.
We use a number of additional country variables in our study. First, as in LLSV, we employ a 1991 index of accounting standards produced by the Center for
International Financial Analysis and Research.8The index rates companies’ annual
reports in 1990 for their inclusion or exclusion of 90 items. The 1991 accounting index is not available for three of our countries: Ireland, Pakistan, and Indonesia. In the results reported in the paper, we use the 1993 scores for Ireland and Pakistan, and we assign to Indonesia the median score for Thailand, Malaysia, the Philippines, and Singapore, but none of our results are affected if we exclude these three countries
8See Chapter 1, Volume 1 ofInternational Accounting and Auditing Trends(2nd Edition, 1991), Center for International Financial Analysis and Research, Princeton, New Jersey.
outright. Second, we use an estimate of the liquidity of markets across countries. For that purpose, we use the ratio of the dollar value of shares traded divided by the average market capitalization in 1997. Our sources for liquidity and GNP are the
IFC Emerging Stock Markets Factbookfrom 1998 and 1999. To getGNP in dollars, we use the World Bank’s ‘‘Atlas method’’ based on the average exchange rate for the year. Third, the Milken Institute has developed a capital access index that attempts to capture the structural characteristics of the corporate finance, capital markets,
and financial institutions systems of each country.9 More specifically, itmeasures
capital access according to the depth, breadth, and liquidity of markets—it is an equally weighted index of variables, divided into three categories: quantitative, risk, and qualitative. The score ranges from 0 to 7, where a higher score indicates better capital access. The index examines market factors regulating the entry and exit, origin, and destination of capital flows. Finally, we use GNP in 1997. The appendix details all country-level variables used.
5. The cross-listing premium
Table 1first reports the number of firms for each countryðNÞ;the mean of total
assets, and the average Tobin’sqof firms without a U.S. listing. The number of firms
in each country varies widely. We have a minimum of three non-cross-listed firms in Peru and Venezuela, buta maximum of 1,258 firms in Japan. There is considerable
variation inq across countries, from a minimum of 0.61 in Peru to a maximum of
2.78 in Turkey. Though medians are not reported, the range of medianq’s is more
limited.
The nextfour columns ofTable 1show the number of firms with a U.S. listing,
their average total assets, their average q; and finally the average difference in q
between the cross-listed and non-cross-listed firms, DðqÞ: The proportion of firms
that are listed in the U.S. varies widely across countries. Greece and Pakistan have no firms listed in the U.S. that meet our data requirements, but Mexico, South Africa, and Venezuela have more firms in our sample with a U.S. listing than firms without. Japan and the U.K. each have more than 100 firms listed in the U.S.
In terms of total assets (in U.S. dollars), cross-listed firms are larger than non-cross-listed firms. For the whole sample, the mean of the total assets of listed firms is almost six times larger than the mean of the total assets of non-cross-listed firms. Since there are fixed costs associated with cross-listing in the U.S. for a foreign firm, one would expect the firms that list to be larger.
Hypothesis H2(a) states that cross-listed firms have higher q’s than
non-cross-listed firms. We can use the results ofTable 1to test this hypothesis by examining the
average cross-listing premium. We compute this premium as follows. First, for each
country, the difference between the averageq of listed firms and the average q of
9SeeThink Locally - Act Globally:Domestic Market Restructuring and Sustainable Global Eonomic Growthby Glenn Yago, Thomas Hall, and Michael Harrington (Milken Institute Policy Brief, March 8, 2000).
AR
TI
CL
E
IN
P
RE
S
S
Bank of New York. Information on firms from Canada and Israel that list their shares directly on the NYSE or Nasdaq is obtained from the exchanges’ web sites. The National Quotation Bureau’s Pink Sheets are used to identify Canadian firms that are directly listed on the OTC market. The first two panels compare firms that do not cross-list versus firms that cross-list. The last three panels summarize the data on cross-listed firms based on whether the firms choose to cross-list their shares under Rule 144a, over-the-counter as OTC Bulletin Board or Pink Sheet issues, or on the NYSE or Nasdaq. Data for Total Assets (in billions of U.S. dollars) and Tobin’sq;computed as ((Total AssetsBook Equity)+Market Value of Equity)/Total Assets (all variables are in local currency) is from Worldscope. Financial firms, firms with total assets less than $100 million, and firms with missing data are discarded. For firms that are cross-listed,DðqÞ
is the difference between the meanqfor cross-listed firms and the meanqfor firms that are not cross-listed.Nis the number of firms.
Not cross-listed Cross-listed Rule 144a OTC Exchange-listed
N Total assets q N Total assets q D(q) N Total assets q D(q) N Total assets q D(q) N Total assets q D(q) Argentina 13 0.83 1.15 8 3.58 1.39 0.234 1 1.42 0.99 0.162 2 2.68 1.41 0.258 5 4.38 1.46 0.304 Australia 54 0.56 1.58 35 3.10 1.50 0.083 1 2.32 2.29 0.708 24 2.32 1.52 0.061 10 5.04 1.37 0.215 Austria 33 0.57 1.04 9 2.54 1.41 0.370 0 9 2.54 1.41 0.370 0 Belgium 26 2.81 1.59 2 9.64 1.34 0.254 0 1 8.45 1.24 0.349 1 10.83 1.43 0.158 Brazil 83 2.18 0.80 20 9.01 0.71 0.098 2 4.28 0.84 0.039 15 10.43 0.65 0.156 3 5.08 0.90 0.097 Canada 133 1.32 1.42 66 2.51 1.89 0.471 0 11 2.29 1.94 0.521 55 2.55 1.88 0.461 Chile 34 0.75 0.98 17 2.58 1.40 0.418 1 1.66 1.96 0.982 1 1.66 1.96 0.982 15 2.70 1.32 0.343 Colombia 10 0.79 0.73 1 0.90 0.87 0.134 1 0.90 0.87 0.134 0 0 Denmark 49 0.61 1.77 2 5.63 1.87 0.097 0 0 2 5.63 1.87 0.097 Finland 39 0.90 1.53 6 4.20 1.41 0.121 3 1.41 1.24 0.286 2 6.67 1.08 0.444 1 7.65 2.54 1.017 France 197 2.33 1.44 28 14.75 1.62 0.186 3 17.71 1.05 0.388 14 10.92 1.64 0.198 11 18.82 1.77 0.328 Germany 251 1.15 1.36 23 20.70 1.88 0.519 4 2.32 2.10 0.742 14 20.98 1.47 0.111 5 34.63 2.84 1.486 Greece 24 0.54 1.48 0 0 0 0 Hong Kong 143 0.66 1.18 44 1.88 1.23 0.059 0 43 1.92 1.23 0.054 1 0.20 1.49 0.316 India 76 0.49 1.73 47 0.92 1.12 0.607 47 0.92 1.12 0.607 0 0 Indonesia 43 0.45 1.07 2 2.11 2.51 1.439 0 0 2 2.11 2.51 1.439 Ireland 7 0.79 1.45 2 4.90 1.37 0.080 0 0 2 4.90 1.37 0.080 Israel 4 2.25 1.12 2 2.37 1.25 0.130 0 0 2 2.37 1.25 0.130 Doidge et al. / Journal of Financial Economics 71 (2004) 205 – 238 219
AR
TI
CL
E
IN
P
RE
S
S
N Total assets q N Total assets q D(q) N Total assets q D(q) N Total assets q D(q) N Total assets q D(q) Italy 49 4.35 1.38 13 16.67 1.54 0.160 3 3.11 2.62 1.248 5 4.59 1.11 0.264 5 36.88 1.31 0.068 Japan 1,258 1.82 1.02 110 13.73 1.28 0.263 0 89 9.20 1.26 0.242 21 32.93 1.37 0.354 Korea 178 0.80 0.89 13 6.76 0.92 0.029 10 4.76 0.90 0.006 0 3 13.43 1.00 0.105 Malaysia 152 0.62 1.11 10 2.34 1.16 0.052 0 10 2.34 1.16 0.052 0 Mexico 21 1.08 1.23 25 2.52 1.21 0.022 4 2.18 0.90 0.337 7 2.39 1.63 0.392 14 2.67 1.09 0.140 Netherlands 58 0.73 1.87 21 9.41 2.39 0.520 2 1.63 1.93 0.061 7 3.27 1.69 0.183 12 14.29 2.88 1.007 New Zealand 24 0.63 1.30 3 2.89 2.05 0.746 0 1 4.84 0.98 0.321 2 1.91 2.58 1.279 Norway 37 0.49 1.44 8 3.65 1.77 0.331 1 2.34 0.83 0.607 3 2.72 2.43 0.988 4 4.68 1.51 0.072 Pakistan 9 0.36 1.55 0 0 0 0 Peru 3 0.59 0.61 3 1.09 1.07 0.457 0 1 0.26 0.97 0.362 2 1.48 1.12 0.505 Philippines 27 0.44 0.93 9 2.09 1.16 0.232 5 1.62 1.22 0.286 3 1.95 1.05 0.123 1 4.87 1.22 0.286 Portugal 25 0.59 1.23 5 4.19 2.52 1.290 3 0.92 3.00 1.774 0 2 9.10 1.79 0.565 Singapore 84 0.46 1.02 7 3.93 1.85 0.827 0 6 4.48 1.61 0.590 1 0.63 3.27 2.249 South Africa 14 1.00 1.36 14 1.89 1.19 0.166 1 1.26 0.88 0.479 10 1.58 1.17 0.190 3 3.27 1.38 0.025 Spain 56 1.96 1.51 2 28.83 1.36 0.154 0 0 2 28.83 1.36 0.154 Sweden 53 1.10 1.69 10 7.66 1.27 0.427 0 4 4.35 1.09 0.605 6 9.87 1.39 0.308 Switzerland 73 1.04 1.19 7 21.08 2.05 0.863 0 6 23.96 2.08 1 3.83 1.90 0.713 Taiwan 141 0.59 1.89 21 1.39 2.03 0.142 20 1.30 1.90 0.009 0 1 3.23 4.68 2.789 Thailand 73 0.53 1.10 7 0.85 1.33 0.238 2 1.67 1.01 0.084 5 0.52 1.46 0.368 0 Turkey 21 0.59 2.78 2 0.29 2.73 0.050 2 0.29 2.73 0.050 0 0 UK 500 0.88 1.69 102 7.24 1.98 0.290 0 50 3.94 1.63 0.062 52 10.41 2.31 0.621 Venezuela 3 1.46 0.89 6 0.39 0.83 0.055 0 4 0.44 0.76 0.128 2 0.29 0.98 0.093 Mean 1.05 1.33 6.06 1.54 0.221 2.70 1.52 0.149 5.25 1.39 0.105 9.04 1.79 0.486 Totals 4,078 712 116 347 249 C. Doidge et al. / Journal of Financial Economics 71 (2004) 205 – 238non-cross-listed firms is computed. Second, this difference is averaged across the countries in our sample. The average across countries of the individual cross-listing
premiums is 0.221 with at-statistic of 3.26. The t-statistics are not reported in the
table; they are computed under the assumption that country observations are independent observations. The average across countries of the median cross-listing
premiums (not reported) is 0.201 with at-statistic of 3.68. Based on the results of
Table 1, we cannot reject hypothesis H2(a). Both the mean and median cross-listing premiums are positive for 26 countries. Two of the countries in the table have no cross-listed firms, which leaves 12 countries with a negative cross-listing premium.
The averageqof cross-listed firms exceeds the averageqof non-cross-listed firms by
16.5%.
The next four columns of the table report results for listings with Rule 144a private placements. These listings are capital-raising issues in which the securities are privately placed to qualified institutional buyers and trade OTC among such buyers with very limited liquidity. They do not require compliance with U.S. GAAP or SEC disclosure rules. There are only 116 such listings from 20 countries in our sample. The U.K. and many other countries have none. The countries with the largest number of such listings are India, which has 47, and Taiwan, which has 20. With the exception of France and Thailand, the total assets of the firms using a Rule 144a listing are lower on average than the total assets of the firms having a U.S. listing, although, for several other countries, total assets are the same because the cross-listings consist only of Rule 144a, such as Colombia, India, and Turkey. The average cross-listing premium is positive in 11 countries and the median premium (not reported) is positive in 12 countries. The average cross-listing premium for Rule 144a private placement listings is 0.149, which is lower than the overall cross-listing premium. In contrast, the median cross-listing premium for Rule 144a listings (not reported) is 0.255, which is greater than the overall cross-listing premium.
The t-statistics for the averages of mean and median Rule 144a cross-listing
premiums are 1.05 and 2.39, respectively.
The next four columns show results for firms with an OTC listing. These are often referred to as Level I ADRs for non-Canadian listings. They trade OTC as Pink Sheet issues with limited liquidity and require only minimal SEC disclosure and no GAAP compliance. These firms are exemptfrom filing Form 20-F under Rule 12g3-2(b), which allows home country accounting statements with adequate English translation, if necessary. This is the most popular type of listing; almost half of the sample of cross-listed firms has an OTC listing and 28 countries have firms with such a listing. Typically, firms with an OTC listing have more assets than firms with a Rule 144a listing. Fifteen countries have a positive average OTC cross-listing premium and 22 countries have a positive median OTC cross-listing premium (not reported). The average cross-listing premium for OTC listings is 0.105
and the median is 0.127; the associatedt-statistics for the average and median OTC
cross-listing premiums are 1.40 and 2.34, respectively.
Finally, the last four columns show results for exchange-listed firms. These listings comprise ordinary listings (mostly Canadian firms and New York Registered Shares for Dutch firms) and Level II and III ADRs. As the most prestigious and costly type
of listing, these require full SEC disclosure with Form 20-F and compliance with the exchange’s own listing rules. Thirty-two countries have firms with exchange listings.
Exceptfor Brazil, Hong Kong, New Zealand, Singapore, and Switzerland, and
Venezuela these firms are on average larger than the other firms from their home country that are also listed in the U.S. The cross-listing premium is positive on average in 25 countries. The median cross-listing premium (not reported) is positive
in 26 countries. The average cross-listing premium is 0.486 (t-statistic across
countries of 3.85), which corresponds to an average cross-listing premium of 36.5%. This average cross-listing premium is 226% of the average cross-listing premium for Rule 144a listings and 362% of the premium for OTC listings. We do not report the
median premium, butitis even larger at0.519 (t-statistic across countries of 4.52),
which amounts to a median premium of 45.9%.
Table 1does not make it possible to evaluate the significance of the cross-listing
premium for each country. To evaluate this significance, we estimate within-country
regressions of q on the firm’s sales growth, the firm’s industry q, and a dummy
variable that takes a value of one for firms with a U.S. listing. Using
heteroskedasticity-consistent t-statistics, we find four countries with a significant
negative dummy variable, but ten countries with a significant positive coefficient
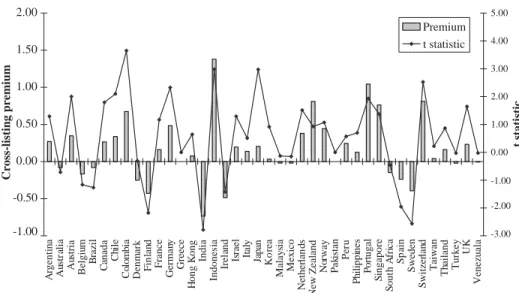
(both evaluated at the 10% significance level).Fig. 1shows the distributions of the
coefficients and their t-statistics. It is important to remember that the statistical
precision of the premium depends on the number of listing firms. Contrast, for example, the Japanese cross-listing premium of 0.20, which is modest but is precisely
estimated with at-statistic of 2.97, and that of New Zealand, with a cross-listing
premium of 0.81 and an associatedt-statistic of 0.92.
The next step in our analysis is to determine whether the cross-listing premium can
be explained by firm-specific and country-level variables. Tables 2 and 3 reporta
series of regression results of Tobin’sq on a dummy variable representing a
cross-listing of any type. Following LLSV (2002), we estimate regressions using a country random-effects model. The random effects model acknowledges possible dependence of errors within countries and explicitly allows both within- and between-country
variation in sales growth, industry q’s, and other variables used to estimate their
effecton q: Essentially, the standard errors are adjusted to reflect the
cross-correlation between observations due to common country components.10
Specification (1) ofTable 2projects theq of all firms in our sample on a dummy
variable, ‘‘Cross-list,’’ that takes a value of one if a firm is listed in the U.S. We see
that the dummy variable has a positive coefficient of 0.20 with at-statistic of 5.91.
TheR2 of this regression is low, which is not surprising since the only explanatory
variable is whether a firm is listed in the U.S. It could be that firms that list simply have better investment opportunities, but if this were the case, controlling for growth
10The inferences on the coefficients that test our hypotheses do not depend on the use of such a random effect specification, but the significance of other coefficients depends on the choice of regression specification. In fact, we support the use of random effects using a Lagrange multiplier test for several of our specifications which rejects the null hypothesis that the residuals are independent within countries. We will identify such instances in our discussion of results, but some of these alternative specifications will not be presented in tables.
opportunities in the regression should make the premium disappear. InTable 2, we use two proxies for growth opportunities: sales growth over the last two years and
the medianqof the global industry to which a firm belongs. Specification (2) shows
that the premium is significantly positive when we use these proxies for growth opportunities. Controlling for growth opportunities reduces the premium and its
significance, butincreases theR2 substantially.11
In specifications (3)–(12), we add country characteristics as independent variables to specification (2). The premium is significant in every regression. Except for the liquidity ratio, the country characteristics are generally not significant with the
0.00 0.50 1.00 1.50 2.00 A rgent in a Au str alia Au stria Belg iu m B razil C anada Ch ile Co lo m b ia Den m ark Fin la nd France German y Greece H ong K ong Indi a Indones ia Irel an d Is rael Ital y Ja p an Ko rea Malay si a Mexico Nether lan d s New Zealand No rway Pak istan Per u P h il ippi nes P o rt ugal S ingapore S out h A fri ca Sp ain Sweden Switzer lan d
Taiwan Thailand Turkey
UK Venezuala 0.00 1.00 2.00 3.00 4.00 5.00 Premium t statistic -0.50 -1.00 Cross-listing premium t statistic -2.00 -3.00 -1.00
Fig. 1. A comparison of the cross-listing premium across countries. This figure presents results from within-country regressions that estimate the valuation impact of cross-listing in the U.S. Information on ADRs comes from Bank of New York. Information on firms from Canada and Israel that list their shares directly on the NYSE or Nasdaq is obtained from the exchanges’ web sites. The National Quotation Bureau’s Pink Sheets are used to identify Canadian firms that are directly listed on the OTC market. Financial firms, firms with total assets less than $100 million, and firms with missing data are discarded. The dependentvariable in each regression is Tobin’s q, computed as ((Total AssetsBook Equity)+Market Value of Equity)/Total Assets (all variables are in local currency) on December 31, 1997. Cross-list is a dummy variable that equals one if a firm cross-lists its shares in the U.S. and zero otherwise. Sales growth (computed from inflation-adjusted sales in local currency) is the firm’s two-year sales growth rate and global industryqis the median global industryq:Two cross-listed firms are deleted because they have extremely high sales growth rates due to acquisitions. For each country, the premium is estimated by regressing Tobin’sqon a constant, on the cross-list dummy variable, on sales growth, and on global industryq:Thet-statistics are computed with heteroskedasticity-consistent standard errors.
11Including the industryqmakes the intercepts of the regressions negative. In this analysis, we excluded two firms based on very large outlier values for sales growth. These firms are Eidos, plc, a U.K. firm listed on Nasdaq, and Hurricane Hydrocarbons, a Canadian firm listed on the NYSE. We tracked down the SEC Form 20-F filings and uncovered that their 1,577% and 2,733% growth in sales in 1996, respectively, were both due to major acquisitions.
AR
TI
CL
E
IN
P
RE
S
S
This table presents results from random effects regressions that estimate the valuation impact of cross-listing in the U.S. Information on ADRs comes from Bank of New York. Information on firms from Canada and Israel that list their shares directly on the NYSE or Nasdaq is obtained from the exchanges’ web sites. The National Quotation Bureau’s Pink Sheets are used to identify Canadian firms that are directly listed on the OTC market. Financial firms, firms with total assets less than $100 million, and firms with missing data are discarded. The dependent variable in each regression is Tobin’sq;computed as ((Total AssetsBook Equity)+Market Value of Equity)/Total Assets (all variables are in local currency) on December 31, 1997. Cross-list is a dummy variable that equals one if a firm cross-lists its shares in the U.S. and zero otherwise. Sales growth (computed from inflation-adjusted sales in local currency) is the firm’s two-year sales growth rate, and global industryqis the median global industryq:Two cross-listed firms are deleted because they have extremely high sales growth rates due to acquisitions. French law, German law, Scandinavian law, Anti-director, Accounting standards, and Judicial efficiency are from LLSV (1998). Liquidity ratio is from the IFC Emerging Stock Markets Factbook 1998; it is the dollar value of shares traded divided by the average market capitalization in 1997. The Capital Access Index, developed by the Milken Institute, identifies quantitative and qualitative measures of the ability of an entrepreneur to raise capital. Firms from 40 different countries are represented in the sample; 710 firms are cross-listed in the U.S. and 4,078 firms do not cross-list their shares in the U.S. (t-statistics are in parentheses.)
(1) (2) (3) (4) (5) (6) (7) (8) (9) (10) (11) (12) Constant 1.33 0.14 0.15 0.09 0.44 0.24 0.40 0.48 0.62 0.76 0.63 0.51 (22.73) (1.33) (1.11) (0.55) (1.21) (0.98) (3.18) (0.90) (1.41) (1.02) (1.83) (0.88) Cross-list0.20 0.16 0.16 0.16 0.16 0.16 0.16 0.16 0.16 0.16 0.16 0.16 (5.91) (4.87) (4.88) (4.88) (4.89) (4.88) (4.95) (4.89) (4.91) (4.91) (4.97) (4.91) French law 0.00 0.01 0.07 (0.00) (0.08) (0.36) German law 0.07 0.54 0.05 (0.37) (3.12) (0.23) Scandinavian Law 0.22 0.07 0.26 (1.03) (0.43) (1.05) Anti-director 0.02 0.00 0.03 (0.36) (0.05) (0.64) Accounting standards 0.00 0.00 0.00 0.00 0.01 (0.85) (0.49) (0.24) (0.33) (0.68) Judicial efficiency 0.01 0.04 0.02 0.01 0.00 (0.44) (1.51) (0.39) (0.44) (0.10) Liquidity ratio 0.41 0.68 0.42 (3.56) (5.23) (3.33) Capital access 0.08 0.13 0.04 (0.65) (0.63) (0.21) Sales growth 0.19 0.19 0.19 0.19 0.19 0.19 0.19 0.19 0.19 0.19 0.19 (6.95) (6.94) (6.95) (6.95) (6.95) (6.95) (6.95) (6.92) (6.93) (6.94) (6.94) Global industryq 1.35 1.35 1.35 1.35 1.35 1.35 1.35 1.35 1.35 1.35 1.35 (16.29) (16.28) (16.29) (16.27) (16.28) (16.29) (16.27) (16.26) (16.26) (16.27) (16.27) OverallR2 0.01 0.08 0.09 0.08 0.09 0.08 0.09 0.09 0.14 0.11 0.10 0.09 C. Doidge et al. / Journal of Financial Economics 71 (2004) 205 – 238
AR
TI
CL
E
IN
P
RE
S
S
in the U.S. using random effects, two-stage least squares (2SLS), and the Heckman two-stage estimator. Information on ADRs comes from Bank of New York. Information on firms from Canada and Israel that list their shares directly on the NYSE or Nasdaq is obtained from the exchanges’ web sites. The National Quotation Bureau’s Pink Sheets are used to identify Canadian firms that are directly listed on the OTC market. Financial firms, firms with total assets less than $100 million, and firms with missing data are discarded. The dependent variable in each regression is Tobin’s q; computed as ((Total AssetsBook Equity)+Market Value of Equity)/Total Assets (all variables are in local currency) on December 31, 1997. Cross-list is a dummy variable that equals one if a firm cross-lists its shares in the U.S. and zero otherwise. GNP is in billions of U.S. dollars and Sales is in thousands of U.S. dollars. Sales growth (computed from inflation-adjusted sales in local currency) is the firm’s two-year sales growth rate and global industryqis the median global industryq:Two cross-listed firms are deleted because they have extremely high sales growth rates due to acquisitions. French law, German law, Scandinavian law, Anti-director, Accounting standards, and Judicial efficiency are from LLSV (1998). Liquidity ratio is from the IFC Emerging Stock Markets Factbook 1998; it is the dollar value of shares traded divided by the average market capitalization in 1997. Firms from 40 different countries are represented in the sample; 710 firms are cross-listed in the U.S. and 4,078 firms do not cross-list their shares in the U.S. Lambda is the inverse Mills ratio in the Heckman model. logLis the value of the log likelihood function and Pseudo-R2 is a goodness-of-fit measure for Probit models based on the difference between unrestricted and restricted likelihood
functions (McFadden, 1974).R2denotes an overallR2measure for the random effects models and an adjustedR2for the other models. (t-statistics are in
parentheses.)
Probit model Basic specification (3) Full specification (4)
(1) (2) Random effects 2SLS Heckman Random effects 2SLS Heckman Constant 3.54 4.42 0.14 0.39 0.35 0.62 1.61 1.55 (9.81) (13.27) (1.33) (4.09) (3.61) (1.83) (11.49) (11.04) Cross-list0.16 0.44 0.30 0.16 0.50 0.34 (4.87) (5.52) (3.95) (4.97) (6.20) (4.50) Lambda 0.06 0.08 (1.28) (1.77) French law 0.72 (7.59) German law 1.04 (10.39) Scandinavian law 0.70 (5.37) Doidge et al. / Journal of Financial Economics 71 (2004) 205 – 238 225
AR
TI
CL
E
IN
P
RE
S
S
Anti-director 0.23 0.00 0.01 0.02 (8.66) (0.05) (1.01) (1.48) Accounting standards 0.03 0.01 0.00 0.01 0.01 (7.06) (3.50) (0.33) (8.08) (8.01) Judicial efficiency 0.02 0.04 0.01 0.00 0.00 (0.86) (1.87) (0.44) (0.29) (0.08) Liquidity ratio 0.15 0.05 0.42 0.34 0.34 (1.98) (0.77) (3.33) (10.97) (10.93) Log GNP 0.15 0.31 (5.15) (14.87) Log(Sales) 0.43 0.43 (20.31) (20.31) Sales growth 0.19 0.23 0.24 0.19 0.21 0.21 (6.95) (8.01) (8.03) (6.94) (7.16) (7.19) Global Industryq 1.35 1.50 1.48 1.35 1.44 1.42 (16.29) (17.11) (16.82) (16.27) (16.65) (16.38) LogL 1609 1635 PseudoR2 0.20 0.19 R2 0.08 0.08 0.08 0.10 0.12 0.12(1) (2) Random effects 2SLS Heckman Random effects 2SLS Heckman
C. Doidge et al. / Journal of Financial Economics 71 (2004) 205 – 238
random effects model, but are significant with ordinary least squares (OLS, not reported). In particular, with the OLS model, when we do not control for other country characteristics, firms with French civil law and Germanic civil law have
lowerq’s, while firms with Scandinavian law have higherq’s. Tobin’sqincreases with
the index of accounting standards and increases with the liquidity of the domestic
stock market. Finally, firms have higherq’s in countries with easier access to capital.
It is noteworthy that the index of anti-director rights is not significantly positively
related toq;as found inLLSV (2002). While the period of analysis is similar, it is
important to remember that our sample is much larger than their 539 firms in 27 countries. Moreover, their specifications control for cash flow rights, which ours do not.
Itfollows fromTable 2that (a) there is a cross-listing premium, (b) it is robust to
controlling for a firm’s growth opportunities, and (c) it is robust to controlling for investor protection proxies, capital market development across countries, and other country factors. We need to be cautious, however, about the interpretation of the cross-listing premium. With our theory, firms are more likely to list if they have
better growth opportunities. This means that firms with a higherqare more likely to
list. Our equation allows firm q to be explained by country characteristics, firm
characteristics, and whether a firm is listed or not. The error in our regression is, therefore, likely to be correlated with whether a firm is listed or not. This creates a bias in our estimate of the coefficient of the listing dummy variable. Our next experiment attempts to account for this selectivity bias.
To take into account self-selection, we have to specify a model of the choice of listing. In our theory, the decision to list depends on firm as well as country characteristics. It is straightforward to make the listing decision depend on country characteristics, but some issues arise when taking into account firm characteristics. First, while it is reasonable to assume that country characteristics change slowly, such an assumption is less reasonable for firm characteristics. The firm characteristics we have in our data set are for 1997. Firms likely make their listing decision based on firm characteristics at the time of listing. Worldscope does not have information for many of our firms at the time of listing. Second, an important
issue in self-selection models, such as two-stage least squares and the Heckman
(1979) approach, is the choice of instruments in the selection (listing decision)
equation and the observation (valuation) equation. A number of authors suggest that exogenous characteristics that affect the selection be used, especially if they are
less likely to affect the specific firm’s value (Greene, 1997, Section 20.4.4;Willis and
Rosen, 1979). Obviously, firm characteristics such as growth opportunities will necessarily be closely related to firm value and adding such characteristics could make the selection equation and the valuation equation alternate ways of estimating the same relation. As a result, we do not include a number of possible firm characteristics in the selection equation. We do, however, include the log of sales as a proxy for firm size, since larger firms are more likely to list.
To examine the effect of listing onq;we define the measure ofq as
qi¼aþ
%
B0
%
where
%
Xiis a setof exogenous variables,CLiis a dummy variable that equals one for
a firm that cross-lists in the U.S.,fa;
%
B;dgis a vector of parameters to be estimated,
andei is an error term. The estimated parameterd measures the relation between
listing andq:Since the firms that list are not random and their decision is related to
q;CLiandeiare correlated and OLS estimates ofdwill be biased. FollowingGreene
(1997, Chapter 20), we assume that the listing decision is given by
CLi ¼
%
g0
%
ZiþZi ðlisting decision equationÞ;
CLi¼1 ifCLi >0;
CLi¼0 ifCLip0; ð14Þ
whereCLi is an unobserved latent variable,
%
Zi is a set of variables that affect the
decision to list, andZi is an error term. The correlation between CLi andei will be
nonzero if the exogenous variables in the listing decision equation (14),
%
Zi;affectq;
butare notin Eq. (13), or if the error terms,ei andZi;are correlated.
We can estimate (13)–(14) as a simultaneous equation system or usingHeckman’s
(1979)two-step estimator, which is the approach we choose. Assuming thateiandZi
are bivariate normally distributed with means zero, standard deviations se andsZ
(normalized to one), and correlationr;we have the expectedqof the listing firm as
Eðqi jCLi¼1Þ ¼aþ % B0 % Xiþdþrseli1ð % g0ZiÞ; ð15aÞ where li1ð % g0 %
ZiÞ is the ‘‘inverse Mills’ ratio’’ and is computed as fð
% g0 % ZiÞ=Fð % g0 % ZiÞ;
wherefðÞand FðÞare the density function and cumulative distribution functions
for the standard normal, respectively. The expected value of the firm that chooses notto listis similarly
Eðqi jCLi¼0Þ ¼aþ % B0 % Xiþrseli2ð % g0ZiÞ; ð15bÞ where li2ð % g0 % ZiÞ is computed as fð % g0 % ZiÞ=½1Fð % g0 %
ZiÞ: The difference in q for the
cross-listed and non-cross-listed firm is given by
Eðqi jCLi¼1Þ Eðqi jCLi¼0Þ ¼dþrsefð % g0ZiÞ=½Fð % g0ZiÞð1Fð % g0ZiÞÞ;ð15cÞ which shows how the estimated premium for listing will be biased upward if the
correlation of the error terms,r;is positive, as is hypothesized for cross-listed firms.
The first step of theHeckman (1979)procedure is to obtain estimates of
%
gin Eq. (14)
using a probit model. These consistent estimates can then be used to compute values
forli1andli2:The second step estimates Eq. (13) using OLS, but with an additional
term,li;computed asli1ð
%
g0ZiÞCLiþli2ð
%
g0ZiÞð1CLiÞ;to correct for self-selection,
qi¼aþ
%
B0
%
XiþdCLiþdlliþni ðcorrected valuation equationÞ; ð16Þ
where dl is a new parameter associated with rsei that captures the sign of the
correlation between the error terms in Eqs. (13) and (14).12
Table 3presents our results evaluating the effect of selection bias on the
cross-listing premium. The table is divided into three sections, including the probit model
12An appendix is available from the authors on the estimation procedure and the computation of the standard errors from the Heckman covariance matrix (see also,Greene, 1997, Chapter 20;Maddala, 1983, Chapters 8 and 9).