/ c
ESO 2003
Astrophysics
&
Revisiting the solid HDO/H
2
O abundances
?
E. Dartois
1, W.-F. Thi
2,3, T. R. Geballe
4, D. Debo
ffl
e
1, L. d’Hendecourt
1, and E. van Dishoeck
31 “Astrochimie Exp´erimentale”, IAS-CNRS, Bˆat. 121, Universit´e Paris Sud, 91405 Orsay Cedex, France 2 University College London, Gower Street, London, UK
3 Sterrewacht Leiden, University of Leiden, The Netherlands 4 Gemini Observatory, 670 North A’ohoku Place, Hilo, HI 96720
Received 1 May 2002/Accepted 25 October 2002
Abstract.We revisit the reported detection and upper limits on HDO in ice mantles present in the molecular cloud environ-ments of the massive young protostars Gl 2136 and W33 A, using independent VLT-ISAAC and UKIRT-CGS4 spectroscopic observations. We also present VLT and UKIRT spectra of RAFGL 7009 near the HDO absorption wavelength and reanalyze the ISO-SWS spectral data for NGC 7538 IRS9, Orion-BN and S140. We demonstrate that the previously reported detections of HDO in W33 A and NGC 7538 IRS9 are incorrect. We present an in-depth analysis that shows that, besides the sensitivity limits, detection of low levels of HDO is difficult in amorphous ice mantles when features from solid methanol, a common grain mantle constituent, are present. We discuss the specific problems arising in the ISO data in this wavelength range for NGC 7538 IRS9. Using VLT-ISAAC observations, we also investigate the HDO/H2O ratio toward the intermediate mass stars
IRAS 05329–0728 and IRAS 08448–4343. Our derived upper limits for the D/H ratio in water ice range from HDO/H2O<1%
to 0.2% in the different sources, and we discuss these limits in comparison with values derived in other environments.
Key words. astrochemistry – ISM: abundances, lines and bands – individual objects: Gl 2136, W33 A, RAFGL7009, IRAS 05380–0728, IRAS 08448–4343
1. Introduction
The deuterium to hydrogen atom exchange in chemical reac-tions is a sensitive function of the energy available, and thus of the physical conditions in which molecules form in low tem-peratures interstellar environments.
A high deuterium enhancement compared to the intrinsic cosmological D/H ratio of (1.5–3)×10−5 (Pettini & Bowen 2001) and local ISM value of ∼1.6×10⁻⁵ (Linsky 1995) is
now widely observed in the gas phase for specific molecules (e.g. HDCO, D2CO: Turner et al. 1990; Ceccarelli et al. 1998;
Loinard et al. 2001; Ceccarelli et al. 2001; DCO+: Caselli et al. 2002; NH2D, NHD2, ND3: Roueffet al. 2000; Shah & Wooten
2001; van der Tak et al. (2002), Lis et al. (2002), Deuterated CH3OH: Parise et al. 2002) in many astronomical lines of sights and is specifically high in dark clouds. The D/H ratios
Send offprint requests to: E. Dartois,
e-mail:[email protected]
? Based on observations collected at the European Southern
Observatory, Paranal, Chile (ESO Programme 164.I-0605(A)), UKIRT, Mauna Kea, Hawaii, and ISO satellite. The United Kingdom Infrared Telescope is operated by the Joint Astronomy Centre on be-half of the UK Particle Physics and Astronomy Research Council. TRG’s research is supported by the Gemini Observatory, which is op-erated by the Association of Universities for Research in Astronomy, Inc., on behalf of the international Gemini partnership of Argentina, Australia, Brazil, Canada, Chile, the UK, and the USA.
values can be 10−2or higher, values that cannot be explained by
“classical” pure gas phase models. In hot cores the HDO/H2O
ratio derived from gas phase observations present substantially lower values of a few×10−4(Gensheimer et al. 1996).
Two main proposed explanations for high deuterium en-hancements are (i) gas phase low temperature exchange re-actions favored when C and O are significantly depleted on grains (e.g. Roberts et al. 2002; Tin´e et al. 2000; Roberts & Millar 2000), (ii) gas-grain interactions favoring longer resi-dence timescales on grain mantles of deuterium bearing species as compared to hydrogenated ones as well as the larger atomic D/H ratio in the gas phase (Tielens 1983). These two mecha-nisms are early stage chemistry, taking place a long time before any enhancement is observed in the gas in a protostellar hot core phase. The first scenario could be followed by accretion on grain mantles in the densest regions of the clouds, preventing the observer from easily distinguishing between this scenario and the enrichment by grain surface reactions alone.
In the solar system, the HDO/H2O ratio has been measured
in comets, giving insight into the pristine water ice deuterium enhancement. Values an order of magnitude higher than the cosmic abundance (e.g. HDO/H2O≈3×10−4for Hale-Bopp,
The link between the D/H ratio in interstellar material sur-rounding the class 0 to class I protostars and the observed deuterium enhancement in our own solar system may provide great insight into our understanding of the subsequent evolution through the formation and incorporation of interstellar matter in the protosolar nebula and circumstellar disks (Aikawa & Herbst 1999; Mousis et al. 2000). Therefore, the measurement of D/H in interstellar ice mantles provides an important con-straint in cosmochemical models considering planetary system formation.
The most abundant molecule observed in the relatively volatile ice mantles covering refractory grains in astronomical sources is H2O ice. It is known (e.g. Jones & Williams 1984)
that the formation of a water ice mantle requires surface reac-tions because gas phase chemistry is not capable of synthesiz-ing sufficient water molecules. Deuterium enrichment in water ice should therefore reflect the specificity of its formation and differ from enrichment of molecular species primarily formed in the gas phase like DCO+.
It is therefore natural to search for its deuterated counterpart HDO in the solid phase. Recently, detections of the OD stretch-ing mode of solid HDO were claimed by Teixeira et al. (1999; hereafter T99) using ISO-SWS medium resolution observa-tions, in the absorption spectra of two massive young stellar objects. The values of HDO/H2O they reported are 8×10⁻⁴for
W33 A and a surprisingly high value of 10−2toward NGC 7538
IRS9. The latter measurement is especially remarkable because comets, which appear to have much lower values of HDO/H2O,
are thought to result from the agglomeration of icy interstellar grains.
In this paper we reexamine the search for the stretching mode of HDO in molecular clouds. In Sect. 2 we present laboratory studies of HDO on simulated grain mantles to de-termine its absorbance and thus its abundance under diff er-ent conditions. In the next section we compare these results to new ground-based observations of GL 2136, W33 A, and RAFGL 7009 at the wavelength of the stretching mode. In Sect. 4 we compare these spectra with the previously reported ISO SWS spectra and our laboratory spectra, and re-reduce and analyze the SWS spectrum of NGC 7538 IRS9. We then de-rive upper limits to the amount of HDO towards the sources that we and T99 have observed. In Sect. 6 we report an addi-tional search for HDO toward less massive embedded sources. Finally, in Sect. 7 we discuss possible types of lines of sight in which to search for HDO. In the subsequent section, a possi-ble scenario for deuterium enrichment in molecular clouds is presented.
2. HDO laboratory experiments
Two sets of experiments have been conducted in the labora-tory to provide a basis for the interpretation of the observa-tional data. The first experiment was an in situ photolysis of a CH3D:O2 (1:1) ice mixture deposited at 10 K on a cold
CsI window. The ice film is exposed to UV photons of 1200 and 1600 Å. This efficiently dissociates the O2 molecule as
well as the CH and CD bonds of the deuterated methane. The H and D atoms are mobile in the ice matrix and recombine
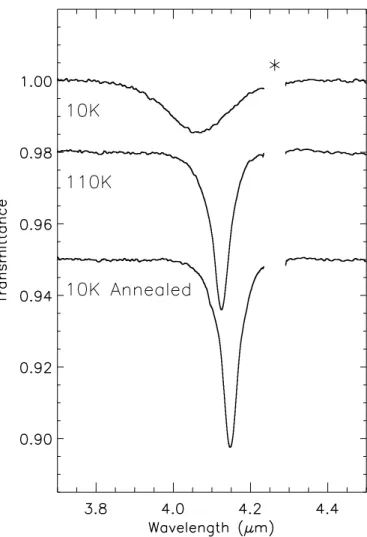
Fig. 1.Laboratory spectra of the water-d1(HDO) OD stretching mode. The HDO molecule, embedded in a water ice matrix, was produced in-situ by deuterium-hydrogen substitution using UV photolysis of an H2O:HD ice mixture deposited at 10 K. Few percents of HDO as
com-pared to the bulk H2O were produced. The sample was then warmed
up to 110 K during an hour to crystallize the water ice and then cooled down again to 10 K. These conditions mimics the possible states in which the HDO molecule can be found in astronomical environments, and the corresponding line shapes for its characteristic OD stretching mode absorption. The∗shows a region in the spectra due to the in-tense CO2stretching mode contamination, which has been removed
here for clarity.
easily to form OH and OD bonds. The next recombination step mainly produces water ice. To first order there is one OD bond for three OH bonds produced. By comparing the OD absorption arising at about 4.07 µm to the 3.1 µm OH stretch, we determine the integrated absorbance values for the OD stretching mode. This estimate was already presented in a previous analysis by Dartois et al. (2000, Sect. 5.2), who obtained an integrated absorbance of AOD ≈ 3.6±0.6(3σ)×
10−17 cm molecule−1. The integrated absorbance of the OH
stretch isAOH ≈1.0×10⁻¹⁶ cm molecule−1(half of theAH2O,
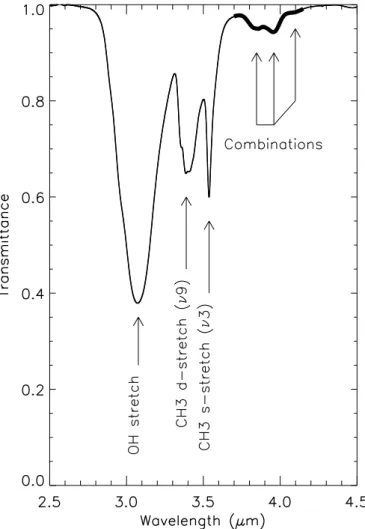
Fig. 2.Spectrum of solid methanol in the amorphous state, deposited at 10 K. The various modes involved are labeled. The thicker line outlines the methanol absorptions arising in the ground-based observ-ing range presented in this paper. Two of these combinations modes have already been reported in W33 A and RAFGL 7009 (Dartois et al. 1999).
consistent with both our value and that of Ikawa & Maeda (1968). These independent measurements agree within 20%, in good agreement for an absolute integrated absorption coeffi -cient.
The second experiment, more relevant for direct com-parison with astronomical spectra, was the irradiation of an H2O:HD ice mixture condensed at 10 K, followed by
evapora-tion of the majority of the HD molecules by slightly warming up the sample. We irradiated the ice mixture to produce a few percent of HDO in the water ice matrix. This experiment pro-duces the molecular environment and interactions experienced by an HDO molecule embedded in a matrix dominated by the H2O ice as expected in interstellar grain mantles. Following the
measurement of the position and width of the OD stretch, the mixture was warmed up to 110 K for an hour, to produce a crystalline ice, after which the spectrum in the vicinity of the OD stretch was re-measured. A subsequent cooling to 10 K al-lowed the expected position and width of an absorption to be measured for the case of ice being condensed at high temper-atures and then cooled. The resultant spectra, which cover the
most likely types of OD absorptions in interstellar ice mantles, are shown in Fig. 1.
Finally, since it is well known that methanol is an abun-dant constituent of ice mantles in massive protostellar ob-jects (Dartois et al. 1999), and has strong spectroscopic signa-tures near the HDO stretch, we also measured the spectrum of pure CH3OH ice at 10 K. This spectrum is shown in Fig. 2.
The region between 3.7 and 4.15 µm is that observed with the UKIRT and VLT spectrometers. In this region three ab-sorption bands from methanol ice, centered at approximately 3.85 µm, 3.95 µm, and 4.1µm, are present. The comparison hereafter are performed directly with laboratory optical depth spectra, normalized to the better known 3.83µm and 3.95µm modes, whose absolute intensities can be found in Hudgins et al. (1993). The determination of the integrated value falls in the same range as the one mentioned in Dartois et al. (1999). We also believe that the blending of the combination modes prevents us from giving a reliable value for the isolated mode, given that we should be able to extract the exact profile of this quite weak shoulder mode, and that this approach is therefore more realistic.
3. Observations
We observed the massive protostar lines of sight GL 2136, W33 A and RAFGL 7009. The molecular environment of these objects display strong water ice absorption modes, presenting the most favorable cases for a tentative HDO detection or the evaluation of a stringent upper limit in these ice mantles. The upper wavelength limit of the observations (4.15µm) is set by the presence of the strong telluric CO2absorption, whose depth
above this wavelength strongly perturbs the analysis of broad features. The range was observed with two independent tele-scopes (VLT and UKIRT) in order to test if the observed fea-tures, or the absence of feafea-tures, are real, since the spectra are at the border of theLband atmospheric window.
In our VLT Large program, we also observed the inter-mediate mass stars IRAS 05380–0728 and IRAS 08448–4343 lines of sight. The quality of the measured spectra allows us to search for HDO in the water ice mantle surrounding these protostars. The ice mantles observed in these sources could present different deuterium enrichments due to different chem-istry timescales involved, as for example due the lower density. For these sources we however do not have any independent ob-servation with UKIRT.
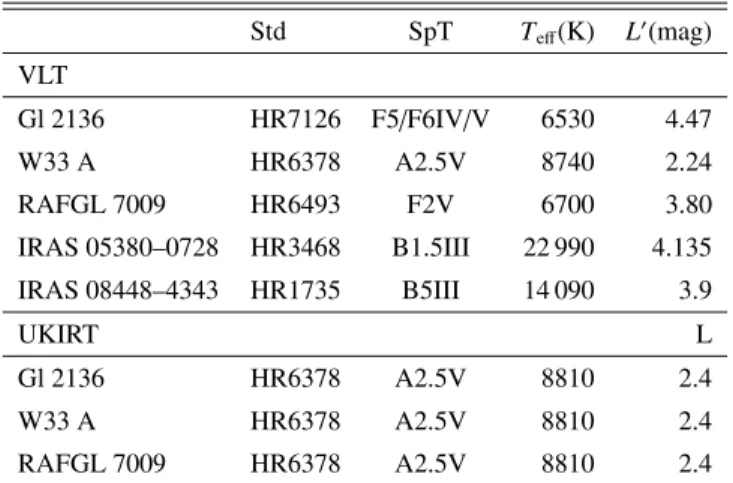
Table 1.Standard stars adopted parameters.
Std SpT Teff(K) L0(mag)
VLT
Gl 2136 HR7126 F5/F6IV/V 6530 4.47
W33 A HR6378 A2.5V 8740 2.24
RAFGL 7009 HR6493 F2V 6700 3.80
IRAS 05380–0728 HR3468 B1.5III 22 990 4.135
IRAS 08448–4343 HR1735 B5III 14 090 3.9
UKIRT L
Gl 2136 HR6378 A2.5V 8810 2.4
W33 A HR6378 A2.5V 8810 2.4
RAFGL 7009 HR6378 A2.5V 8810 2.4
distortion correction. Standard stars are summarized in Table 1. The data were reduced using home made but standard extrac-tion and ratioing procedures. Since we are looking for broad absorption bands, the reduced medium resolution spectra were binned to yield resolutions comparable to that of the low res-olution spectrum of W33 A. The wavelength scales were cali-brated using telluric absorptions observed in the standard stars. UKIRT observations of Gl 2136, W33 A, and RAFGL 7009 were made on the night of UT 18 August 2001, using the fa-cility grating spectrometer CGS4 (Mountain et al. 1990) at a resolving power of roughly 750. Observations were made in stare/nod mode with nodding being done along the slit. Wavelength calibration was achieved by observing an argon arc lamp in second order. The A2.5V star HR 6378 was observed at an airmass within five percent of that of each of the above objects, for the purpose of flux calibration and in order to fa-cilitate accurate removal of telluric features by division. The full CGS4 spectra cover 3.55–4.19µm. At 4.15–4.19µm, the transmission of the Earth’s atmosphere is too low for these data to be useful, and the spectral region 3.55–3.70µm is not of im-portance for this paper. Therefore the spectra shown cover the region 3.70–4.15µm.
Several hydrogen absorption lines are present in each of the calibration stars and atomic lines are present in spectra of the cooler ones. Because of this, the reduced VLT spectra contain narrow residual emissions (at 3.741, 3.749, 3.819, 3.906, 4.021 and 4.05µm), but their presence does not affect the detectivity of the broad features we are seeking. In the UKIRT spectra, these features were removed by interpolation across the lines in the ratioed spectra of GL 2136 and RAFGL 7009, and by interpolating the spectrum of the calibration star across these lines prior to ratioing in the case of W33 A which is known to emit in the hydrogen recombination lines (McGregor et al. 1984).
Theabsoluteflux levels of the reduced spectra from the two
telescopes agree with one another to 10–20%. The differences are probably caused by time-variable seeing and inaccurate es-timates of absolute fluxes for some of the calibration stars. The relative scale differences are of course much less than this.
4. Analysis
4.1. RAFGL 7009, W33 A and Gl 2136
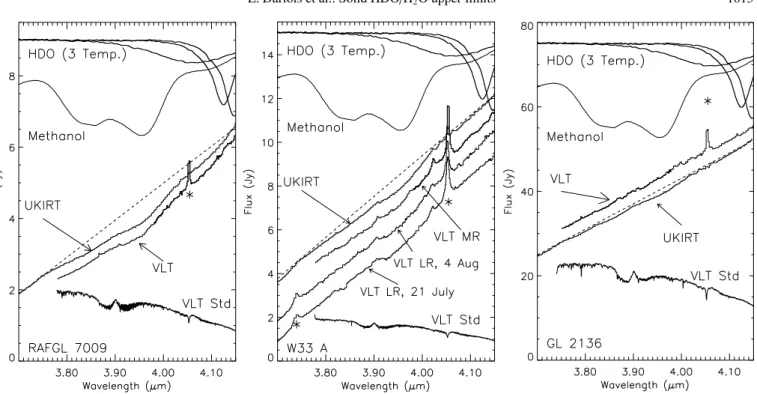
A comprehensive combined view of the laboratory and astro-nomical spectra is presented in Fig. 3.
RAFGL 7009 as well as W33 A display two relatively strong absorptions at about 3.84 and 3.96 µm, as well as a fainter one around 4.1µm, better seen in the RAFGL source by the two independent observations. The first two features were previously identified with solid methanol combination modes (Allamandola et al. 1992; Dartois et al. 1999). Above the astronomical spectra, the transmittance expected for arbi-trary amounts of HDO in its three expected physical states in grain mantles are displayed. We also present a close-up of the methanol spectrum, a species already known to be responsible for the 3.84 and 3.96µm combination modes in the spectra.
The laboratory spectra demonstrate that the 4.1µm band of methanol in the amorphous state, which is the weakest of the three methanol bands, and the only one that is previously un-reported in dark clouds, is essentially coincident with the band detected by T99 and identified by them as HDO. The labora-tory spectra suggest that in astrophysical situations this band is likely to be several times weaker than the adjacent methanol bands at 3.84µm and 3.96µm. As shown in Fig. 4, the rel-ative strengths of the three absorption bands observed toward W33 A and RAFGL 7009 are similar to those in the labora-tory spectra. This is also the case in the ISO/SWS spectrum of W33 A of T99. We note that for GL 2136, T99 do not de-tect either the two stronger bands of methanol or the 4.1µm band whereas we clearly detect weak 3.84 and 3.96µm ab-sorptions (Fig. 5), but not the 4.1µm band. This suggests that, in the wavelength regions in common to both data sets, our present VLT data are less noisy and more stable for the contin-uum determination than the ISO data. The estimated methanol column density toward GL 2136, based on an A value of 3.2×10⁻¹⁸cm molec−1for the combination modes (Hudgins
et al. 1993) is of 6±2×1017cm−2.
Clearly, in a mixture of amorphous methanol ice and HDO ice, it is difficult to demonstrate the presence of HDO unless HDO is abundant enough for the 4.1µm band to be stronger than (or be at least comparable in strength to) the adjacent methanol bands. This is definitely not the case for W33 A and RAFGL 7009. We therefore conclude that the 4.1µm absorp-tion in W33 A, previously previously attributed to HDO ice by T99, is actually due to methanol, and is probably a combination of theν2OH bend and the COν8stretch (see Fig. 4). We also
identify the 4.1µm band in RAFGL 7009 as due to methanol.
4.2. NGC 7538 IRS9
Fig. 3.Ground-based spectra recorded with the VLT-ISAAC and UKIRT-CGS4 spectrometers for RAFGL 7009 (left), W33 A (middle) and GL 2136 (right). From top to bottom, for each panel: the OD stretching mode absorption line shapes in 3 different states of HDO (amorphous, crystalline 110 K and annealed crystalline 10 K), the methanol combination modes already presented in Fig. 2 and arbitrarily enhanced for clar-ity, the independent UKIRT and VLT spectra for the individual sources, a local continuum (dashed line) to outline the astronomical absorption profiles, and the VLT standard spectrum in arbitrary units to give an impression on the atmospheric transmission and standard features before rebinning. The Gl 2136 VLT spectrum is not as good as the UKIRT one, due to the choice for the standard. The F5 star chosen shows intrinsic stellar features. The∗indicates known features present in the standard stars.
Paranal at−24◦400 and NGC 7538 IRS9 is at a declination ofδ ≈ +61◦280). However, we have re-reduced the ISO data previously reduced and presented by T99, together with other ISO spectra of NGC 7538 IRS9, using the latest responsivity curves. In particular, care was taken to separate the “upward” and “downward” scans of the short wavelength spectrometer to check for the relative response of the two scanning directions. The SWS01 and SWS06 data of NGC 7538 IRS9 recorded dur-ing the ISO revolution 98 are not sensitive enough to add sub-stantial elements to our discussion and are not shown here.
The spectroscopic data taken during revolution 568 of the ISO satellite are shown in Fig. 6 for both scanning directions. We do not attempt to stitch the individual spectra recorded in the “1E” (hereλ <4.08µm) and “2A” (λ >4.08µm) individual bands at this stage of the reduction. Note that there is a gap between these bands either in flux or responsivity.
The down scan normally follows the up scan so that it should be less affected by systematic errors such as memory or transient effects. Furthermore, recent improvements of the re-sponsivity curves used for the calibration of the spectra reveal a quite important change in the 4–4.2µm range (Vandenbussche et al. 2001). The Relative Spectral Response Function (RSRF) of the ISO-SWS has a variation in this wavelength range which could introduce an artificial feature in the HDO absorption re-gion. Care must be taken to test this when reducing the data, which explains our use of separate up and down scans.
Figure 6 shows that the feature claimed by Teixeira et al. is an instrumental response or calibration problem, as it is only seen in the up scan. If the data from both scans are simply added, and a mean calculated, the feature is present in the com-bined spectrum. The up-down comparison allows us to reject its validity, since we can then estimate independently the rela-tive strengths of systematic errors and Gaussian noise.
In a second step, we stitched the spectra in the 1E and 2A region together by applying a gain factor of about 10%, a typi-cal correction factor for the ISO absolute typi-calibration, with 5% and 7% absolute errors expected for the 1E and 2A bands re-spectively (de Graauw et al. 1998). The individual spectra are shown in Fig. 7, upper panel. To further demonstrate the reli-ability of the features in this range, transmittance spectra are extracted using the local continua in dotted line (see Fig. 7).
5. Implications for upper limits
Fig. 4. Extracted transmittances for W33 A (upper panel) and RAFGL 7009 (lower panel) for the VLT and UKIRT data, using the dotted line continuum of Fig. 3, as compared to a pure methanol ice spectrum recorded at 10 K in the laboratory. The 4.1µm faint absorp-tion feature, attributable to a CH3OH combination mode, demonstrate
the confusion limit in the attribution of an OD absorption in these sources lines of sight.
Toward GL 2136 and NGC 7538 IRS9 the amounts of methanol are much lower and with sufficiently high signal-to-noise spectra more sensitive estimates can be made. However, for lower D/H ratios, uncertainties in the measured values of
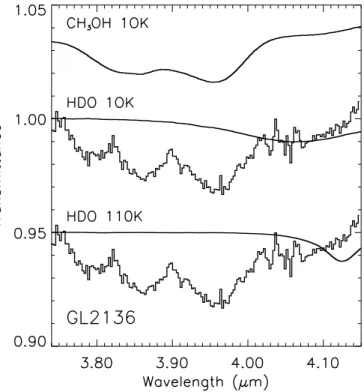
Fig. 5.Extracted transmittance of the Gl 2136 UKIRT spectrum, using the continuum displayed in Fig. 3. The methanol contribution to the absorption is the upper curve. The maximum possible contributions arising from the HDO molecule under the amorphous and crystalline states are superimposed. We use the corresponding column densities limits in our discussion.
the ratio or upper limits would be dominated by uncertainties in the contribution of the methanol absorption.
For NGC 7538 IRS9, we estimate the HDO column density using the profile of amorphous HDO, with a width (FWHM) of about 120 cm−1 (≈0.18µm) located at 2462 cm−1(4.062µm) and a maximum optical depth of 0.02. It leads toNHDO=4.8–
6.7×1016 cm−2, an upper limit 15% to 40% lower than the Teixeira et al. detection. Using NH2O = 5.9×10
18 cm−2 as
in Teixeira et al., we derive an upper limit HDO/H2O < 8.1–
11.4×10⁻³.
The Gl 2136 upper limit is more strict since no HDO is detected at an optical depth of 0.01 (Fig. 5). Furthermore the water ice is mainly crystalline toward this line of sight (e.g. Dartois et al. 2002), putting a more stringent constraint on the HDO content of the ice. Indeed, since the OD stretching mode of the HDO molecule considerably narrows when the structure of the ice changes, the contrast between the continuum and the line is then amplified, rendering the detection easier. We use the crystalline 110 K HDO profile shown in Fig. 1, with a width (FWHM) of about 40 cm−1 (≈0.07µm) located at 2424 cm−1
(4.125µm) and a maximum optical depth of 0.01. It leads to an upper limit of NHDO ≤ 0.01×40/(3.6−5)×10−17 = 8–
11×1015cm−2, similar to the Teixeira et al. limit. UsingN H2O=
5×1018 cm−2as in T99, we derive an upper limit on the D/H
ratio in water ice of HDO/H2O <1.6–2.2×10⁻³. This upper
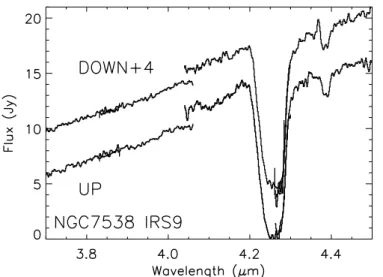
Fig. 6.ISO medium resolution spectrum (SWS06) of NGC 7538 IRS9 recorded on June 6, 1997. The data were reduced using the interactive analysis tool, taking care to separate the up and down scans, shifted here for clarity. The discrepancy between the fluxes around 4.05µm is not corrected at this stage of the reduction to show the problem en-countered in the subsequent analysis. Note that the individual scans have particularly different responses around 4.1µm, the region of in-terest when studying the solid HDO absorption.
upper limit, as we assumed here that H2O is entirely crystalline.
Based on recent calculations (Dartois et al. 2002), the fraction of crystalline to total water ice is, for this source, greater than or equal to 50%, which implies the strict upper limit is twice the above values, or roughly 0.004.
We note that T99 have obtained an upper limit for GL 2136 that is similar to ours. However, they did not detect the 3.84µm and 3.96µm methanol bands, which we have detected quite clearly. Therefore, we suspect that their limit is too optimistic and believe that our approach, using the laboratory spectra of HDO and CH3OH to help estimate the maximum amount of
HDO that could be concealed, in the noise, is a more realistic technique.
6. HDO toward intermediate mass objects
The possibility to use 8 meters class telescopes allows now to search for weak spectroscopic features in less luminous ob-jects such as the intermediate mass ones. We therefore also evaluate a D/H upper limit in two of these objects present-ing a strong amorphous water ice absorption with the VLT-ISAAC spectrometer: IRAS 05380–0728 and IRAS 08448– 4343. These objects have total luminosities of ∼250 L and ∼1600 L respectively (Reipurth & Bally 1986; Wouterloot & Brand 1999), corresponding to future A stars, whereas the massive objects were closer to late O early B protostars. Note that in the IRAS 08448–4343 source an absorption arising from solid methanol at 3.54µm is detected (Thi et al. 2002).
The maximum HDO absorptions possibly hidden in the spectra are displayed in Fig. 8. We used the amorphous HDO profile to set this limit as the broad H2O ice feature is clearly
dominated by the amorphous state. The corresponding upper
Fig. 7.Upper panel: same as Fig. 6 except that we applied a gain cor-recting factor to the 2A band of about 10%. A local continuum is fitted for each scanning direction in order to extract the residual presented below. Lower panel: extracted transmittance for both scanning direc-tions of the ISO NGC 7538 IRS9 spectra, shifted for clarity. A labora-tory solid methanol spectrum is displayed to show its contribution in the ISO spectra.
limit on D/H in H2O is∼1%. It will be difficult to obtain much
lower estimates.
7. Where to search for HDO?
A more systematic search, especially in lines of sight where strong gas phase deuterium enrichments are observed in H2CO
and NH3should be done. The difficulty is to find objects which
possess simultaneously this gas phase enrichment together with a strong ice absorption band seen against a relatively strong protostellar infrared emitting source.
Fig. 8.Intermediate mass embedded protostars spectra recorded with the VLT-ISAAC spectrometer. The region where the OD stretching vibration should appear is highlighted and the maximum possible OD absorption presented.
than H2O, as these species have quite similar vapor pressures
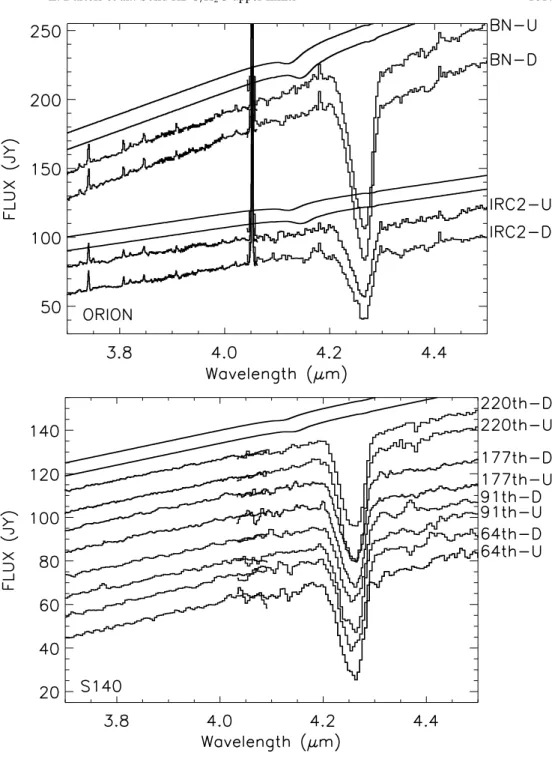
and because HDO is a minor fraction embedded in water ice. Whatever the crystalline state of the water ice, the observed D/H ratio therefore reflects the initial incorporated deuterium enrichment during the ice formation era and is valid over a wide temperature range. Good candidates in that respect are the lines of sight to S140 IRS and the BN object, since they have few or no methanol features and crystalline water ice profiles (Brooke et al. 1996; Dartois et al. 2001).
We reduced the ISO spectra available in the ISO database for these sources using the upward/downward scan separa-tion (see Fig. 9). We also display a contribusepara-tion from the OD stretching mode expected if HDO/H2O = 0.01, in the
crystalline 10 K and crystalline 110 K cases, multiplied by a straight line continuum. We assumed here H2O column
densi-ties of 4×10¹⁸and 2.2×1018cm−2for BN and S140,
respec-tively. In the BN object, we can firmly reject such an abundance ratio, and estimate that the D/H limit is below or at the lower limit of the gas phase HDO/H2O of 0.004–0.01 given by Pardo
et al. 2001 in the Orion region. The solid HDO limit toward BN
is worth improving by deeper integration. With flux levels and H2O column densities within a factor of two, the upper limits
derived using ISO data on the IRc2 and for S140 are of the same order. We stress that only in a very few selected lines of sight it is possible to measure a solid HDO/H2O below 5×10⁻³.
8. Discussion
8.1. Deuterium budget
In the infrared wavelength range, every solid absorption ob-served implies the molecule is very abundant, as one is barely sensitive to species whose abundances compared to H2are less
than 10−6.
HDO/H2O cosmic abundance in massive star environments and molecular clouds
In the environments of massive stars the H2O ice can account
for as much as about 10−4of all the hydrogen. In these
environ-ments, a D/H ratio in the ice of 10% (as observed in some gas phase species in low mass star environments) would imply that 10% of the overall deuterium reservoir is locked up in a sin-gle species, a high number which would mean a very efficient transfer mechanism.
In molecular clouds, it is well known that the H2O ice
ab-sorption correlates with the extinction above a given extinction threshold, with a slope varying from cloud to cloud. The results of Murakawa et al. (2000) for the Taurus Dark Cloud give: [H2O]Ice≈6.4×10⁻⁵forAV ATh.
If we transfer all the available deuterium on H2O, then the
D/H upper limit set by the deuterium cosmic abundance we obtain is:
[(D/H)H2O]Ice<
1.5×10⁻⁵
0.5×6.4×10−5 ≈0.48.
This comparison tells us that the D/H ratio in water ice should definitely be less than 0.5, as we assumed here all the available deuterium is locked into this molecule.
Absolute versus relative D/H ratios
The D/H ratios determined in the millimeter domain concern molecules whose absolute abundances, as compared to H2,
are less than 10−8. By contrast, when dealing with solid state species such as solid H2O, CH3OH, CH4, the hydrogenated
species abundances are in the 10−4–10−5 range, as discussed above. Hence, the evaluation of the fraction of the available cosmic deuterium (D/H ∼ 1.5×10⁻⁵) needed to account for
deuterium enrichments is a critical issue if one assumes that the gas phase high enrichment simply reflects pure solid state ex-change chemistry and not reactions involving high D/H present in the gas phase and simply convert via surface chemistry.
Our derived upper limits suggest that at most 1% of the deuterium reservoir in intermediate and high mass stars envi-ronments can be involved in the H2O ice, the major mantle
Fig. 9.ISO SWS01 and 06 spectra of bright embedded sources (upper panel: Orion sources, lower panel: S140) presenting crystallinity in their observed water ice mantles, displayed in the spectral region where the OD stretching should ap-pear. Spectra are labeled with their name or the revolution in which they were observed. The SWS06 spectra are rebinned by a factor of 4 and the final resolutions varies from about 500 to 1500. Up and Down scans are labeled “U” and “D”. The curves above the sources spectra are a local continuum mul-tiplied by the OD stretching mode absorption, normalized to represent 1% of the main water ice column density along each line of sight.
densities clouds and probed either with field stars or proto-star infrared sources (such as Elias 16: Whittet et al. 1998, or Elias 29: Boogert et al. 2000), a 10HDO/H2O ratio would have
been already reported, as the quality of observed spectra allows to draw percent upper limits.
The upper limits in ice mantles presented in this paper therefore suggest that another mechanism than pure solid state chemistry may be active to produce the very high deuterium en-richment observed in the gas phase in specific species around low mass YSOs.
An observational effort must be conducted to find and ob-serve sources which possess a high deuterium gas phase en-richment but also enough infrared signal to probe the D/H di-rectly in absorption in ices for comparison. More significant
conclusions could be drawn if the upper limits or the detec-tion could be lowered down, but, as shown for solid state methanol, owing to other solid state absorptions, combination modes and/or overtones, a 10−3limit might be the very best one can safely achieve for the solid phase.
8.2. Water surface formation
A recent experimental study of the formation of H2O on a
plat-inum surface follows the various paths for ice formation reac-tion from gas phase H, D and O atoms (Biener et al. 2002). The formation of solid H2O proceeds in this experiments via
addition. The reaction of this OH radical with H has two com-peting results: either H is abstracted to form an H2 molecule
which leaves the surface, either a water molecule is synthe-sized. Since the former path is endothermic and has a large barrier, the latter path, which is highly exothermic, is favored under interstellar conditions. It should be noticed that the for-mation of H2O releases enough energy for a significant fraction
of water molecules to overcome the adsorption barrier and en-rich the gas phase in water molecules. However, most of the time the grain will act as an heat sink, allowing the molecules to thermalize rapidly with the surface, therefore building up the ice mantle.
The HDO formation proceeds in a similar way except that owing to the mass of deuterium compared to H, the scanning time of the surface of a grain should be longer. No direct reac-tion exchange in this experiment has been seen in the reacreac-tion D+H2O, because it is endothermic. Therefore the only
forma-tion path of HDO in this context is probably via the D+OH reaction, which is slower than the H +OH reaction. In con-trast, deuterium exchange is, as already mentioned, favored at low temperature in gas phase reactions as in the D+HCO+→ DCO++H, because deuterium has a lower zero point energy than the hydrogen atom.The path described in this experiment
differs from that used by Tielens (1983). The difference can be
ascribed to the use in our discussion of more recent experimen-tal data.
Experiments on formation of solid H2O and HDO on
inter-stellar silicates analogs is warranted, as well as chemical mod-eling that will include the result of recent experimental find-ings. It is however clear from the formation path of solid H2O
sketched above that, if valid in the interstellar case, and before to reach the conditions of the Roberts & Millar (2000) models at which start the deuteration due entirely to the high gas phase D/H enhancement, grains have already acquired most of their water ice mantles and the resultant HDO/H2O ratio should be
even lower than the (already rather low) D/H gas phase ratio encountered during their formation, but wheigted by the higher deuterium residence timescale on grains. Furthermore it should not vary significantly during the lifetime of the bulk of the ice mantle, unless the deuterium exchanges taking place on the sur-faces in the d-enriched gas phase epoch can replace progres-sively the entire bulk of the ice mantles.
8.3. A possible scenario for deuterium enrichment?
Recent modeling of the processes taking place in the solar nebula are compatible with the deuterium enrichment with respect to the protosolar D/H ratio either measured in LL3 meteorites and comets (Mousis et al. 2002; Eberhardt et al. 1995; Bockel´ee-Morvan et al. 1998; Meier et al. 1998) or es-timated from solar system outer planets HD measurements (Feuchtgruber et al. 1999), below the 10−3 limit. These
val-ues are much lower than the dark cloud valval-ues for other species (≤a few 10−2).
The H2O ice measured in the sources discussed in this
paper is probably formed prior to the onset of the infrared radiation that allows us to probe the mantle composition,
i.e. accreted in a more quiescent phase than that probed now. This is clear, since using background stars to probe molecular clouds, one can generally derive a correlation between the ob-served ice column density and the extinction along the line of sight. In parallel, a number of recent gas phase models stud-ies indicate that the presence of grains and therefore freeze out of species can favor deuterium enrichment reactions indirectly (Roberts et al. 2002; Tin´e et al. 2000). Observations of high abundances of H2D+support the scenario in which deuteration
proceed efficiently when other molecules are frozen out onto grains (Stark et al. 1999).
We describe hereafter a possible scenario to explain the fact that the deuterium enrichment in water ice does not reach the high value of 10−2, but that some gas phase species can reach a D/H∼10% value. During the time sequence leading to the cloud condensation, we propose the following phases:
phase “A”: atoms interact with grain surfaces and initiate
the depletion of heavy atoms such as C and O and species such as gas phase CO, eventually forming hydrides such as H2O
and CH4. The ice mantles already exhibit at that stage carbon
monoxide and water ices, the latter species without a specific high deuterium enrichment.
phase “B”: the depletion level, achieved by the presence
of grains, is sufficient to inhibit the destruction of gas phase species implied in major deuterium exchange reactions. The volatile HD molecule and D atoms mainly reside in the gas. The gas phase is progressively deuterium enriched. One of the possible dominant and exothermic isotopic exchange reaction involves the HD molecule, and the H+3 ion:
H+3+HDH2D++H2.
The resultant reactive H2D+ can therefore redistribute the
deuteration on other species such as CO leading to DCO+, NH3
to NH2D+, and H2CO to HDCO.
phase “C”: some but not all of the enriched molecules
freeze out in grain mantles. They however do not constitute the bulk of the ice in abundance. The observed relative (D/H) ratio in the solid phase is then lower than the actual one in the gas phase as we integrate ices which condensed during the phase “A” (low enrichment) until the phase “C” (high enrich-ment) ice mantles along the lines of sight.
This scenario, would allow to understand why the observed deuterium enrichment in the gas phase is higher around low mass YSOs than around massive ones. Indeed, the clouds around lower mass objects probably stay a longer time in the “B” phase, allowing longer timescale exchange reactions in the gas phase to take place.
To activate the deuterium enrichment, and based on our proposed scenario, grains should therefore play a role, but would not necessarily be representative of the deuterium en-richment measured in the gas phase.
9. Conclusions
We have obtained ground-based spectra near 4µm of several embedded sources including one of two sources toward which the detection of the vibrational stretch of solid HDO was re-cently claimed, and have reanalyzed the ISO/SWS spectra of the second one. We also have obtained new laboratory spec-tra of HDO ice and methanol ice, the latter one also displaying absorption bands near 4µm. Our conclusions are as follows:
– The ubiquitous presence of solid methanol toward some of the lines of sight hampers the astronomical detection of amorphous HDO in many lines of sight.
– The search for solid HDO is best performed in lines of sight where water ice has evolved from the low temperature ice mantles formation in the parental cloud to the crystalline phase, due to overall warming of the ices. Indeed, much smaller columns of HDO can be detected along such lines of sight due to the better contrast of that absorption line in this physical state.
– The absorption feature in W33 A at 4.1 µm identified by Texeira et al. (1999) as due to solid HDO, is due mostly or entirely to amorphous methanol. The claimed detec-tion of solid HDO absorpdetec-tion by Teixeira et al. (1999) in NGC 7538 IRS9 is probably caused by detector instabili-ties, and is not confirmed by our reanalysis of the data tak-ing into account the most recent calibration files. A high signal-to-noise ratio ground-based spectrum should be ob-tained to test this reanalysis.
– The solid HDO/H2O upper limits are a few×10−3 for
GL 2136 and∼10−2 for the other high mass and
interme-diate mass protostars. These upper limits are significantly lower than the observed D/H ratios in some gas phase species around low mass protostars but also lower than ex-pected from the high density results of pure solid state sur-face reactions models like the Tielens (1983) one.
– The high enrichments (∼10–100%) observed in low frac-tional abundance gas phase species in the circumstellar environment of low mass protostars favors a scenario im-plying gas phase exchange reactions assisted indirectly however by the active depletion of gas phase heavy species on grains at high densities. The fractionation would result in higher D/H than the ones encountered in the high mass star environments due to a slower disruption for the low mass star parental cloud, and therefore the ability to de-velop longer timescale gas phase fractionation reactions.
– An alternative scenario involves deuteration assisted by grain surfaces, but the original fractionation originating in fact also from a high gas phase D/H ratio. This gas phase D/H develops when the hydrogen is molecular and the bulk of the ice mantles has already formed. The grains would not deuterate by nature their molecular content but rather act as seeds to transfer a high D/H ratio already present in the gas phase. The high deuteration should in that case only affect the grain mantles last layers composition. Absolute total abundances determination of the species both in the gas and solid phase are therefore crucial to draw some con-clusions and not only gas phase D/H ratios.
Acknowledgements. We wish to thank the VLT team operating the ISAAC facility on UT1 for helpful comments on site during observa-tions. WFT thanks PPARC for a postdoctoral grant. The work of EvD is supported by the Netherlands Organization for Scientific Research (NWO) grant 614.41.003 and a Spinoza grant. We also thank the staffof the Joint Astronomy Centre for its support of the UKIRT ob-servations. TRG’s research is supported by the Gemini Observatory, which is operated by the Association of Universities for Research in Astronomy, Inc., on behalf of the international Gemini parthership of Argentina, Australia, Brazil, Canada, Chile, the UK and the USA. The presented laboratory work is financially supported by the CNRS-PCMI.
References
Aikawa, Y., & Herbst, E. 1999, ApJ, 526, 314
Allamandola, L. J., Sandford, S. A., Tielens, A. G. G. M., & Herbst, T. M. 1992, ApJ, 399, 134
Bergin, E. A., Neufeld, D. A., & Melnick, G. J. 1999, ApJ, 510, L145 Biener, J., Lang, E., Lutterloh, C., & K¨uppers, J. 2002, J. Chem. Phys.,
116, 3063
Blake, G. A., Qi, C., Hogerheijde, M. R., Gurwell, M. A., & Muhleman, D. O. 1999, Nature, 398, 213
Bockelee-Morvan, D., Gautier, D., Lis, D. C. et al. 1998, Icarus, 133, 147
Boogert, A. C. A., Tielens, A. G. G. M., Ceccarelli, C., et al. 2000, A&A, 360, 683
Brooke, T. Y., Sellgren, K., & Smith, R. G. 1996, ApJ, 459, 209 Caselli, P., Walmsley, C. M., Zucconi, A., et al. 2002, ApJ, 565, 344 Ceccarelli, C., Castets, A., Loinard, L., Caux, E., & Tielens,
A. G. G. M. 1998, A&A, 338, L43
Ceccarelli, C., Loinard, L., Castets, A., et al. 2001, A&A, 372, 998 Dartois, E., d’Hendecourt, L., Thi, W., et al. 2002, A&A, 394, 1057 Dartois, E., & d’Hendecourt, L. 2001, A&A, 365, 144
Dartois, E., Gerin, M., & d’Hendecourt, L. 2000, A&A, 361, 1095 Dartois, E., Schutte, W., Geballe, T. R., et al. 1999, A&A, 342, L32 Deloule, E., Doukhan, J.-P., & Robert, F. 1997, Lunar and Planetary
Institute Conf., 28, 291
Eberhardt, P., Reber, M., Krankowsky, D., & Hodges, R. R. 1995, A&A, 302, 301
Feuchtgruber, H., Lellouch, E., B´ezard, B., et al. 1999, A&A, 341, L17
Gensheimer, P. D., Mauersberger, R., & Wilson, T. L. 1996, A&A, 314, 281
de Graauw, T., Feuchtgruber, H., Roelfsema, P. R., et al. 1998, Proc. SPIE, 3354, 1204
McGregor, P. J., Persson, S. E., & Geballe, T. R. 1984, Astron. Soc. of the Pacific, 96, 315
d’Hendecourt, L., Jourdain de Muizon, M., Dartois, E., et al. 1996, A&A, 315, L365
d’Hendecourt, L. B., & Allamandola, L. J. 1986, A&AS, 64, 453 Herzberg, G. 1950, New York: van Nostrand Reinhold, 2nd ed. Hudgins, D. M., Sandford, S. A., Allamandola, L. J., & Tielens,
A. G. G. M. 1993, ApJS, 86, 713
Ikawa, A.-I., & Maeda, S. 1968, Spectrochim. Acta, 24A, 655 Jones, A., & Williams, D. A. 1984, MNRAS, 209, 955
Linsky, J. L., Diplas, A., Wood, B. E., et al. 1995, ApJ, 451, 335 Lis, D. C., Roueff, E., Gerin, M., et al. 2002, ApJ, 571, L55
Loinard, L., Castets, A., Ceccarelli, C., Caux, E., & Tielens, A. G. G. M. 2001, ApJ, 552, L163
Moorwood, A. 2000, From Extrasolar Planets to Cosmology: The VLT Opening Symp., Proc. of the ESO Symp. held at Antofagasta, Chile, 1–4 March 1999, ed. J. Bergeron, & A. Renzini (Berlin: Springer-Verlag), 12
Mountain, C. M., Robertson, D. J., Lee, T. J., & Wade, R. 1990, Instrumentation in astronomy VII, Society of Photo-Optical Instrumentation Engineers Proc., 1235, 25
Mousis, O., Gautier, D., Bockel´ee-Morvan, D., et al. 2000, Icarus, 148, 513
Murakawa, K., Tamura, M., & Nagata, T. 2000, ApJS, 128, 603 Pardo, J. R., Cernicharo, J., Herpin, F., et al. 2001, ApJ, 562, 799 Parise, B., Ceccarelli, C., Tielens, A. G. G. M., et al. 2002, A&A, 393,
L49
Pettini, M., & Bowen, D. V. 2001, ApJ, 560, 41 Reipurth, B., & Bally, J. 1986, Nature, 320, 336
Roberts, H., Fuller, G. A., Millar, T. J., Hatchell, J., & Buckle, J. V. 2002, A&A, 381, 1026
Roberts, H., & Millar, T. J. 2000, A&A, 361, 388
Roueff, E., Tin´e, S., Coudert, L. H., et al. 2000, A&A, 354, L63 Shah, R. Y., & Wootten, A. 2001, ApJ, 554, 933
Stark, R., van der Tak, F. F. S., & van Dishoeck, E. F. 1999, ApJ, 521, L67
van der Tak, F. F. S., Schilke, P., M¨uller, H. S. P., et al. 2002, A&A, 388, L53
Teixeira, T. C., Devlin, J. P., Buch, V., & Emerson, J. P. 1999, A&A, 347, L19
Thi, W.-F., et al. 2002, A&A, submitted Tielens, A. G. G. M. 1983, A&A, 119, 177
Tin´e, S., Roueff, E., Falgarone, E., Gerin, M., & Pineau des Forˆets, G. 2000, A&A, 356, 1039
Turner, B. E. 1990, ApJ, 362, L29
Vandenbussche, B., Morris, P. W., Valentijn, E. A., et al. 2001, The Calibration Legacy of the ISO Mission, E97
Whittet, D. C. B., Gerakines, P. A., Tielens, A. G. G. M., et al. 1998, ApJ, 498, L159