TREATMENT COSTS OF PEDIATRIC CANCER IN RWANDA
Claire C. Neal
A dissertation submitted to the faculty at the University of North Carolina at Chapel Hill in partial fulfillment of the requirements for the degree of Doctor of Public Health in the Department of Health Policy and Management in the Gillings School of Global Public Health.
Chapel Hill 2016
ABSTRACT
Claire C. Neal: Treatment Costs of Pediatric Cancer in Rwanda (Under the direction of Sandra Greene)
Problem: Worldwide, a child is diagnosed with cancer every three minutes.1 More than 80% of the approximately 200,000 children diagnosed each year live in low and middle income countries.2 All too often these children have little to no access to life-saving care: only 20% of children diagnosed have access to effective treatment and 90% of childhood cancer deaths now occur in low income countries where access to effective treatment is severely limited.2, 3
Rationale: Despite these disheartening statistics, childhood cancer can be highly curable when access to treatment is available. Dramatic improvements in childhood survival rates have been achieved in low income countries where a commitment to access to care has been made and long-term partnerships have been established.4 Unfortunately, questions around the affordability of cancer care persist.
Study Design: The project utilized a micro-costing approach to capture and calculate a cost for the overall cancer program at the Butaro Cancer Center of Excellence in Rwanda as well as a per patient cost for 2 common pediatric cancers: Hodgkin lymphoma and Wilms’ tumor. Costs were analyzed retrospectively from the Ministry of Health perspective for the fiscal year 2013-2014 and comprised fixed costs, including infrastructure, utilities, administrative costs and maintenance costs, as well as variable costs such as drug pricing, social support, staff salaries, and patient support costs.
ACKNOWLEDGEMENTS
This work would not have been possible without the extraordinary effort of many people to whom I am deeply grateful.
I would like to begin by thanking our research team: Dr. Lawrence N Shulman, Dr. Tharcisse Mpunga, Dr. Neo Tapela, Dr. Christian Rusangwa, Jean Claude Mugunga, Natalie Pritchett, Elisephan Ntakirutimana, Dr. Shyirambere Cyprien, Dr. Paul Park, and Ryan Borg.
Their effort, input, and insight was invaluable throughout the process. I am indebted to them for the long hours they dedicated to discussing potential methodologies, reviewing financials, explaining the Butaro Hospital System, and helping track down critical
information. I have been both honored and privileged to have Dr. Larry Shulman's support and mentorship throughout this study and over the last 7 years. This study simply would not have happened without him, and I will always be grateful for his steady guidance and inspirational example.
I would like to thank Stephanie Kennell-Heiling, Clemence Muhayiman, and Dr.
Shyirambere Cyprien for their work in creating the pediatric process maps; their input and attention to detail was essential. I would also like to acknowledge the Partners In Health teams in both Boston and Rwanda: Lauren Greenberg, Pacifique Ntirenganya, Theoneste Nkurunziza, Richard Musuhuke, and Dr. Danny A. Milner Jr. I am truly grateful for their patience in responding to my almost never-ending requests for more data.
Many thanks to my cohort for their support, friendship and humor. They have made the last few years a wonderful experience and I feel very lucky to have had the chance to get to know them.
I have also been very lucky to have an incredibly supportive and insightful
Sumit Gupta all provided extensive and thoughtful guidance throughout this process. I would like to add a special thank you to Kristin Reiter for truly going above and beyond in talking me down when I was overwhelmed and for introducing me to new methods and resources.
TABLE OF CONTENTS
LIST OF TABLES ... xi
LIST OF FIGURES ... xii
LIST OF ABBREVIATIONS ...xiii
CHAPTER ONE: INTRODUCTION ... 1
BACKGROUND ... 1
RATIONALE ... 3
RESEARCH QUESTION ... 5
CHAPTER TWO: LITERATURE REVIEW ... 6
METHODS ... 6
Variables and Inclusion/Exclusion Criteria ... 6
Search Strategy ... 7
Analysis Strategy ... 7
SUMMARY ... 8
Literature Reviews And Overviews ... 8
DISCUSSION ... 14
CHAPTER THREE: THE RWANDAN CONTEXT ... 17
HEALTH CARE IN RWANDA ... 17
Cancer Care in Rwanda ... 18
Childhood Cancer in Rwanda ... 20
CHAPTER FOUR: STUDY DESIGN AND METHODOLOGY ... 22
METHODOLOGY AIM #1: COST OF THE ONCOLOGY PROGRAM IN BUTARO ... 22
Variable Costs ... 25
METHODOLOGY AIM #2: COST OF TREATING A CHILD WITH WILMS’ TUMOR ... 27
Overhead ... 27
Chemotherapy and Supportive Care Medications: ... 28
CT Scans and Surgery... 28
Radiotherapy ... 28
Blood Products ... 29
Transportation Costs ... 29
Labor Costs ... 29
METHODOLOGY AIM #3: COST OF TREATING A CHILD WITH HODGKINS LYMPHOMA ... 29
Overhead ... 29
Chemotherapy and Supportive Care Medications ... 30
CT Scans and Radiotherapy ... 30
Blood Products ... 31
Transportation Costs ... 31
Labor Costs ... 31
CHAPTER FIVE: RESULTS ... 32
AIM #1: BUTARO CANCER CENTER OF EXCELLENCE ... 32
Fixed Costs ... 32
Variable Costs ... 34
Total Costs ... 36
AIM #2: WILMS TUMOR ... 37
Chemotherapy ... 37
Supportive Medicines ... 38
Blood Products ... 38
Imaging and Surgical Costs ... 39
Social Support Costs ... 39
Labor ... 39
Equipment and Supplies ... 41
Overhead ... 41
Total Costs ... 42
AIM #3: HODGKINS LYMPHOMA ... 43
Chemotherapy ... 43
Supportive Medicines ... 44
Blood Products ... 44
Transportation Stipends ... 44
Labor Costs ... 45
Equipment and Supplies ... 45
Overhead ... 46
Total Costs ... 47
CHAPTER SIX: FORECASTING FUTURE COSTS ... 49
SCENARIO ANALYSIS ... 49
COSTS PER PATIENT ... 51
CHAPTER SEVEN: DISCUSSION ... 53
SUMMARY OF KEY FINDINGS ... 53
LIMITATIONS ... 55
Perspective ... 55
Treatment Protocol ... 56
Methodology and Data Constraints ... 56
CONCLUSION ... 60
CHAPTER EIGHT: PLAN FOR CHANGE ... 61
CAPACITY BUILDING FOR CANCER CARE IN RWANDA ... 62
IMPROVED ACCESS TO RADIOTHERAPY SERVICES ... 62
DRUG PRICE NEGOTIATION ... 64
NEXT STEPS ... 64
LIST OF TABLES
Table 1: Literature Review Key Concepts ... 7
Table 2: Oncology Program Cost Categories and Significance ... 23
Table 3: Oncology Program Start-Up Costs ... 33
Table 4: Oncology Program Overhead Expenses ... 33
Table 5: Oncology Program Labor Costs ... 35
Table 6: Total Cost for the Butaro Cancer Center across All Categories ... 36
Table 7: Chemotherapy Costs for Wilms Tumor Patients ... 38
Table 8: Supportive Medication Costs for Wilms Tumor Patients ... 38
Table 9: Total Labor Cost for Wilms Tumor ... 40
Table 10: Annualized Cost per Wilms Tumor Patient ... 41
Table 11: Cost of Overhead per Patient for Wilms Tumor ... 42
Table 12: Total Cost of Treatment for Wilms Tumor by Category ... 42
Table 13: Chemotherapy Costs per HL Patient ... 44
Table 14: Supportive Medication Costs per HL Patient ... 44
Table 15: Cost of Labor per Patient for HL ... 45
Table 16: Total Annualized Per Patient Cost for Equipment and Supplies ... 46
Table 17: Overhead Costs per HL Patient ... 46
Table 18: Total Cost per HL Patient ... 47
Table 19: Scenario Analysis for the Oncology Program ... 51
LIST OF FIGURES
LIST OF ABBREVIATIONS
ABVD Adriamycine (= Doxorubicine), Bleomycine, Vinblastine, and Dacarbazine
ALL Acute Lymphoblastic Leukemia
BFM Berlin-Frankfurt-Munster
BL Burkitt Lymphoma
CHUK University Central Hospital of Kigali
DFCI Dana-Farber Cancer Institute
GDP gross domestic product
GFAOP French African Paediatric Oncology Group
HRQL health-related quality of life
IAEA International Atomic Energy Association
NCBT National Center for Blood Transfusion Division
NHL Non Hodgkin Lymphoma
PACT Programme of Action for Cancer Therapy
PIH Partners in Health
RAMA Rwanda’s Medical Insurance Agency
RBC red blood cell
RBF results based financing
RIW resource intensity weights
RMH Rwanda Military Hospital
CHAPTER ONE: INTRODUCTION BACKGROUND
Cancer is increasingly a problem in the developing world. Worldwide, a child is diagnosed with cancer every three minutes.1 Currently, more than 80% of the
approximately 200,000 children diagnosed each year live in low and middle income countries.2
All too often these children have little to no access to life-saving care. It is estimated that only 20% of children diagnosed worldwide have access to effective treatment.3 And in fact 90% of childhood cancer deaths now occur in low income countries where access to effective treatment is severely limited.2 In sub-Saharan Africa, cancer treatment has been shown to be unaffordable for all but the wealthiest of patients.5 As a result, as few as 5% of cancer patients receive chemotherapy.6 Even when a child has access to care and is able to begin a chemotherapy regimen, they are often forced to interrupt or abandon treatment due to problems with affordability over the entire treatment regimen, issues with consistent availability of the drugs, or costs associated with poverty such as the confounding costs of transportation and lost wages.7 These barriers to care can significantly impact survival rates.
low and middle income countries are being forced into poverty (or deeper into poverty) due to medical expenses.10 Treatment for non-communicable diseases, such as cancer, often result in dramatic shifts in spending patterns, with less money spent on food and education and a greater frequency of economic actions associated with distress, such as high risk borrowing and liquidation of assets.11 The odds of catastrophic household expenditures for hospitalization with cancer are 160% higher than for communicable diseases.11
Despite these disheartening statistics, childhood cancer can be highly curable when access to treatment is available. Treatment regimens have progressed tremendously for many childhood cancers over the last decades: survival rates in the United States have increased from approximately 10% fifty years ago to close to 80% today.4 Many pediatric cancers (and particularly those most often found in developing countries) are highly curable with readily available technology (chemotherapy, surgery, and radiotherapy) and drugs that are off patent. Further, simple and effective treatment regimens have been shown to be effective in low income countries. Regimens that are effective in high income countries are not necessarily the same treatment strategies needed in low income settings. Locally adapted protocols that minimize toxicity and length of stay in the hospital (and are
RATIONALE
Despite the heavy cancer burden in low-income and middle-income countries and the lack of existing infrastructure, only 5% of the world’s resources to fight cancer are spent in these countries. 15 Even more disheartening is the fact that in the poorest 25 countries, an estimated 90% of children with cancer will die. In countries like Canada and the United States, this statistic is almost flipped – only about 20% of children diagnosed with cancer will die and 80% will live.16 Why, then, do these staggering health inequities persist despite the growing burden in human and economic costs and the availability of well-established, relatively simple treatment options?
Four dominant myths about cancer care and control in the developing world have been proposed to explain the perpetuation of this divide.16 The Global Task Force for Expanded Access to Cancer Control proposes that cancer control has not been a priority, because “cancer care is largely believed to be:
1. unnecessary because cancer is not a problem in low income countries.
2. unattainable because low income countries do not have adequate infrastructure to handle treatment and care.
3. inappropriate because resources should only be focused on high burden diseases that have proven treatments and interventions.
4. expensive and unaffordable for most low income countries.”
Second, while cancer was once thought of as too complex to be treated in the
developing world, we now know that effective models exist and that quality cancer care can be delivered in even the most resource-poor settings. Cancer programs in low income countries are now making great strides in developing replicable models for delivering high quality cancer care despite few oncologists and low availability of advanced equipment and resources. These advances have largely been made by leveraging existing health systems and building capacity that supports multiple specific diseases. The argument against
providing cancer care is similar to those that were made in the past against the treatment of AIDS and TB in low-resource settings. The complexity, cost and infrastructure necessary to combat these diseases seemed insurmountable to many. We now know that these barriers can be overcome. Treatment for complex diseases can be adapted to local contexts; and high cost variables, such as drug prices, can be successfully negotiated. The example of AIDS medications are particularly instructive, as concerted advocacy efforts and bulk pricing were able to reduce medication costs by as much as 90% from the price when introduced in high income countries to the price for purchase in low income countries.16
Because of the efforts made by the cancer control community to overcome these myths, we are beginning to see a shifting tide in the policy realm with regard to the need, feasibility and appropriateness of cancer care in low resource settings. However, questions around the affordability of cancer care continue to pose problems. The field has made some strides in recognizing the costs of inaction, in terms of lost productivity, ties to poverty and burden on the health system.21 However, models for delivering care are still relatively new and the costs of high quality cancer care in low resource settings have not yet been well-defined. The purpose of the proposed study is to carefully enumerate the costs of a pediatric cancer treatment program in a low-resource setting. Identification of these costs will help inform policy makers and funders about the affordability of cancer treatment in developing countries and will provide information needed to advocate for greater investment in fighting this growing burden.
RESEARCH QUESTION
The lack of data on the costs of delivering cancer treatment in low income countries has become a barrier to the further development of such systems by both national
governments and external funders. This study will answer the question, “What is the financial cost of treating a child with cancer in Rwanda?”
Aim #1: What is the cost of the cancer program in Butaro?
CHAPTER TWO: LITERATURE REVIEW
The literature review focused on the question: what is known about the institutional costs of pediatric cancer treatment worldwide? This systematic review investigated
economic analyses of pediatric cancer programs and pediatric cancer treatments in countries of all income levels. While our specific interest is in the provision of cancer
treatment in low income countries, given the dearth of economic analysis in these countries, the review was not limited by setting.
METHODS
Variables and Inclusion/Exclusion Criteria
Cost Perspective: In investigating the cost of the delivery of care, the literature review will focus on articles related to costs of treatment at the health care provider, implementing agency and/or institutional level. This review will be focused on assessing knowledge specific to delivering cancer care treatment and will therefore not include studies focusing solely on the cost of cancer to the individual or their family. It will also not include studies specific only to the costs to society as a whole, in terms of lost productivity and/or mortality. The review will focus on the costs of providing cancer treatment holistically and therefore, will not include studies that compare only one small portion of treatment (for example the cost of providing one anti-nausea medicine vs. another option) as these analyses often assume all other costs are equal and focus solely on the cost of the product or intervention in question.
Search Strategy
The purpose of the literature review is to synthesize what is known about the cost of providing pediatric cancer care. Therefore, the search strategy was intended to be broad and inclusive in order to gather as much of the published literature in this area as possible. Searches were conducted on PubMed and Web of Science. All articles meeting the above inclusion and exclusion criteria and published between 1995 and 2014 were considered for review. All articles must have been published in English to be considered.
Table 1 outlines the key concepts included in the search strategy. Concepts
represented by columns indicate searches conducted using OR. Concepts identified by rows reflect AND strategies.
Table 1: Literature Review Key Concepts Key
Concepts Search Terms (each column reflects an OR in the search and each row reflects an AND) Childhood
cancer “childhood cancer” “Pediatric oncology” ALL, Hodgkin’s, Wilms, nephroblastoma and/or Burkitt
“neoplasms”
Cost “cost” “cost analysis” “economic” “economic
analysis” Cancer
Treatment
treatment “cancer drugs” Chemotherapy Surgery or Radiation
Analysis Strategy
The quality of the articles identified both through the online search strategy and the snowballing technique was assured by including only those articles that either appeared in peer-reviewed journal articles or those that were published from credible local or
international sources, such as local government and/or multi-lateral reports. RESULTS
The search methodology resulted in a total of 148 articles identified in PubMed and Web of Science as potentially relevant. Of the original 148 articles, I eliminated a
substantial number (138) for failing to meet the inclusion criteria after title and/or abstract review. I identified an additional 3 studies through snowballing, or reviewing relevant articles to identify journal articles that had been missed in the key word searches. After full article review, 13 articles met the inclusion criteria of the review. I recorded all study characteristics, outcomes and notes in a summary spreadsheet.
SUMMARY
Results from the literature review represented 4 overarching categories of analysis related to the cost of pediatric cancer care: literature reviews and overview narratives on the state of the research, studies investigating the financial cost of providing care, studies comparing costs for different treatment protocols for the same disease, and
cost-effectiveness studies. The vast majority of findings related to costing the treatment of Acute Lymphoblastic Leukemia (ALL); one study examined Non Hodgkin Lymphoma (NHL), one examined Hodgkin Lymphoma and one study examined Burkitt Lymphoma. All studies with one exception were conducted in either high or upper middle income economies as classified by the World Bank. Only one study represented cost analysis of cancer treatment in a low income country.
Literature Reviews And Overviews: Four of the identified studies conducted
agreement that there is a need for more research on the costs of pediatric cancer treatment.
In Beyond the Bench and the Bedside: Economic and Health Systems Dimensions of Global Childhood Cancer Outcomes, Denberg et al. advocate for greater analysis of the economic and health system dimensions of childhood cancer outcomes. The authors highlight the relationship between national income and health investments and childhood cancer survival rates emphasizing that “estimated 5-year survival rates for children with cancer are directly proportional to a range of economic and health system indicators, including gross national income per capita, the number of physicians per 1,000 population and, most significantly, the annual government expenditure on healthcare per capita”. The authors note that “cost-effectiveness ratios for the treatment of pediatric cancer are highly favorable in HICs” and posit that resource-adapted protocols hold much promise for being cost-effective in low and middle income countries as well. 22
In “Economic evaluation of treatments for cancer in childhood” Barr, Feeny and Furlong advocate for institutionalization of economic evaluation within clinical trials in pediatric oncology. The authors offer a framework for economic evaluations based on clinical effectiveness, utility assessment and quality- adjusted life years and analysis of societal costs and propose that researchers who design clinical trials for childhood cancer should be challenged to justify decisions not to include such measures 23.
In a systematic literature review of economic evaluations of Non-Hodgkin’s Lymphoma (NHL) using Pub Med and Cochrane databases in English and Dutch, the authors analyzed the available economic evaluations for their descriptive abilities. The authors developed a framework for judging each study based on 6 methodological indicators they deemed as high priority for the descriptive value of the study:
1. Acknowledgement of the study perspective 2. Inclusion of overhead costs
4. Valuation: costs based on resource consumption, not prices 5. Clear data analysis strategy including sensitivity analysis 6. Presentations of resource use and unit costs
The authors concluded that many therapies for NHL had yet to be economically evaluated. Those studies that were evaluated were often found either to include
methodological flaws (related to the 6 key indicators) or to be incomplete in the description of their methodology so that compliance could not be evaluated conclusively. 24
Similarly, a literature review specific to health-related quality of life (HRQL) and economic outcomes of children with acute lymphoblastic leukemia (ALL) found few cost-effectiveness studies and no published comprehensive economic evaluations. The authors found a significant body of published literature with regard to HRQL measures in children with cancer but little related to the economic costs of treatment: most costing studies the authors identified focused narrowly on a particular component of treatment. 25
Financial Analyses: Three studies investigated the financial cost of treatment in different contexts.
A retrospective analysis of tumor registry data for 138 patients in South Africa using costs determined by 2008 tariff levels determined that the total cost of diagnosing, staging and treating a child with Hodgkin Lymphoma and following up for 2 years post-therapy was ZAR $53,178.20 (or US $6,647.27) 26. The analysis was limited in that it relied on prices not resource utilization and excluded salaries, consumables and hospitalization charges – elements that are known to be major cost drivers of treatment.
reliance on hospital charges and the wide variability in treatment for ALL limits the utility of the results.
A similar analysis of treatment costs for pediatric ALL patients was conducted in China with 45 patients diagnosed between May 2005 and June 2006. Liu et al. found that the overall average cost of treatment per patient was US $11,022.07 with clinic costs accounting for approximately US $3,700 and hospital cost accounting for about US $7,300 28. Both studies of ALL patients noted the wide variability in individual treatment patterns and the resultant effect on cost. As these studies demonstrate even within the same disease, there are wide variations in cost, between both countries and individuals.
Treatment Cost Comparisons: Four of the articles represented cost comparisons between different treatment regimens. Tong et al. investigated the cost difference between several different protocols for patients treated for childhood ALL in the Netherlands. The authors analyzed patient-level data for 84 patients enrolled in 2 pediatric oncology centers in the Netherlands between April 2005 and October 2009. Costs were found to be
comparable between the first protocol (treatment with PEGasparaginase as first line drug followed by Erwinia asparaginase in case of allergy) and the second protocol (treatment with native E.coli asparaginase, followed by a switch to PEGasparaginase, and subsequently to Erwinia asparaginase in case of allergy). The authors concluded that the first protocol was preferable given that it is administered less frequently “resulting in a reduced burden for the patient and family” 29. However, the study was limited in that it did not investigate
differences in outcomes between the 2 protocols or costs borne by the patient and their family.
A second study investigated the difference in toxicity, supportive care and costs for two different Chemotherapy Protocols used in Russia to treat Childhood ALL. Von
calculated using prices in the German Rote Liste. Findings were limited in that the analysis utilized prices charged to patients instead of the cost of resource utilization; however, because the main outcome was a comparison, the authors concluded that the comparison was more important than determining the absolute value. The assessment was also limited in that it did not include the costs of disposable materials, solutions and outpatient
treatment and travel. Total costs of treatment and supportive care were found to be 1.73 times higher for the existing BFM 90 protocol, while costs of cytostatic drugs and toxicity during therapy were comparable 30. The authors concluded that the new MB91 protocol “appears to be an alternative to established protocols for countries with limited financial and clinical resources.”
The third study, Economic Evaluation of Treatment for Acute Lymphoblastic
Leukaemia in Childhood, investigated the difference in cost and health-related quality of life between 2 different widely-used treatment strategies: the Berlin-Frankfurt-Munster (BFM) and Dana-Farber Cancer Institute (DFCI) consortia’s treatment strategies. In order to assess Heath-Related Quality of Life, “parents of children treated at seven centres in Canada, Italy and the USA completed health-related quality of life (HRQL) assessments during four active treatment phases and at 2 years after treatment” 31. Costing data was provided by only one center. Hospital service utilization and costs were assessed only for patients in the Province of Ontario using resource intensity weights (RIW) collected from the Discharge Abstract Database of the Canadian Institute for Health Information and costs obtained from the Ontario Case Costing Initiative. Total treatment costs were found to be between US$40,559 to US$255,987 for the BFM treatment strategy and between
US$43,242 to US$262,541 for the DFCI strategy. The authors concluded that there was no significant difference in the mean total treatment costs or in health effects between
protocols.
Luo et al. compared the costs and event-free survival rates for 243 patients
“hospital beds; medications; therapy and procedures including nursing, lumbar puncture, intrathecal injection, bone marrow aspiration and parenteral injection; blood products; and others such as consultation, ultrasonography, electrocardiogram, radiological imaging, and pathology tests” 32. Event-Free Survival was determined from the initiation of treatment through the date of last follow-up or the first treatment failure (including abandonment, death or relapse). The study was undertaken to determine whether the development of the Economic Protocol (a less intensive regimen designed for patients who can’t afford the standard regimens) would produce lower costs and acceptable event-free survival rates. The cost of the Economic Protocol was shown to be the least expensive of the three regimens “with less intense chemotherapy, lower incidence of treatment-related complications and shorter duration of total hospital days”. The authors found that the Economic Regimen produced EFS rates that were about 10% lower than the other 2
protocols but also noted that a significant proportion of failure was due to abandonment due to inability to pay. The authors proposed that funding to support treatment for those who cannot afford even the Economic Protocol would likely result in higher event-free survival rates.
Cost-Effectiveness: Two economic analyses were identified that calculated the cost-effectiveness of pediatric cancer treatment. A Dutch study examined 50 children diagnosed with ALL from a single institution and determined costs per life year saved to be between US $1,962 and $2,655 33. The cost-effectiveness ratio was found to be well within acceptable ranges for cost-effectiveness. Costs were determined using in-house estimates for direct costs. Outcomes were assessed using the national 5-year event-free survival rates.
capita of a given country or region. A ratio of 3:1 is considered cost effective” 34. Children in Brazil with ALL achieved a 63% event-free survival rate at a cost of US $16,700 per patient, while 48% of the children in Malawi were cured with the BL protocol and a cost of less than US $50 per child. The results in Brazil represent only 6% of the threshold of being very cost effective. The results in Malawi represent less than 1% of the calculated US $14,243 threshold for very cost effective BL treatment. The authors highlight that it “is a common assumption that treating children with cancer in LMIC is not cost effective”35. The results of this research stand in stark contrast to that assumption. However, it is important to note that the authors’ calculations of cost-effectiveness of BL were based on a study quoting the cost of chemotherapy drugs for BL pediatric patients in Malawi as “inferior [to] 50 US dollars” 12. Therefore, these calculations are limited in that they do not include fixed costs or variable costs outside of chemotherapy and supportive care drugs, such as
infrastructure, healthcare worker salaries, and/or radiology/laboratory equipment. These costs can be substantial but will vary greatly with the health system. Many cancer programs are built to leverage existing infrastructure; however, these costs should be considered in future studies.
DISCUSSION
Methodologies for costing studies of pediatric cancer vary greatly depending on the various potential uses and purposes for conducting studies. In addition, the lack of readily available financial information and/or standardized financial information across systems led many researchers to choose the less rigorous but more accessible path of basing the
analysis on patient prices as opposed to resource consumption. Where cost information was available, costs varied widely between diseases, patients and protocols.
Most of the studies in the review analyzed the cost of providing treatment for ALL patients. These studies found costs ranging from a low of approximately $11,000 per
patient in middle income countries to a high of around $100,00 in high income countries. In
services and chemotherapy drug prices vary widely between countries and likely account for
the vast differences in the cost per patient seen in these studies. One study examined
treatment for Hodgkin Lymphoma in South Africa, an upper-middle income country as
classified by the World Bank. This study found the total cost of diagnosing, staging and
treating a child with Hodgkin Lymphoma to be $6,647.27.
The cost of providing treatment for childhood cancer in low income countries remains largely unknown. Vast differences in labor costs, treatment regimens, and chemotherapy and drug costs between cancer programs in high and low income countries lead to difficulty in understanding how costs may transfer to low resource settings. Only one article was found that captured the cost of providing care in a low income country: the
cost-effectiveness study comparing the cost-effectiveness of treating either acute lymphocytic leukemia (ALL) in Brazil or Burkitt Lymphoma (BL) in Malawi. Forty-eight percent of the children in Malawi were cured with the BL protocol at a cost of less than US $50 per child. However, because the analysis in Malawi was built on the costs of chemotherapy
medications alone and the original costing study did not include the costing methodology, comprehensive costing analyses are needed to understand the true costs of treating these diseases.
The literature review was successful in identifying the extent of knowledge on the cost of delivering cancer care to children. Nevertheless, the findings were limited by a publication bias. Clearly there is more that is known by those practicing in the field than what is published in the literature, as evidenced by expert opinion, commentaries and reviews. There are many factors that could contribute to lack of publications, particularly in low resource settings: cancer programs tend to be relatively new, data is often
existing unpublished, practical knowledge. Yet, in including only published studies, the literature review may be missing significant applied knowledge that would impact
implementation. Within the studies that were published, significant limitations were noted. The studies often involved small sample sizes with frequent broad estimates used for
missing financial data. In addition, many studies did not include costs such as labor or overhead in the analysis, impacting the potential utility of the findings. While these
limitations should be considered when assessing the practical application of this knowledge, they do provide enough consensus to point toward areas of necessary research.
A full accounting of the costs across childhood cancer diagnoses should be
CHAPTER THREE: THE RWANDAN CONTEXT HEALTH CARE IN RWANDA
Rwanda is a largely rural country with a population of 11 million people, almost 5 million of whom are under the age of 15. The country ranks 167th on the Human
Development Index. Rwanda has a per capita income of $644 US and a poverty rate of 44.9% with 24.1% of the population living in extreme poverty.36 The genocide in 1994 had a significant and lasting impact on the country and its healthcare infrastructure. Coming out of the genocide, Rwanda established Vision 2020, a government-led development program intended to “overcome poverty and foster unity and reconciliation.”37 Through the
implementation of this vision, Rwanda has made significant strides in improving the health and welfare of its people. Life expectancy has increased dramatically from 28 years in 1994 to 56 years in 2012. Over 77% of the population lived below the poverty line in 1994: by 2010, less than 45% were living in poverty.38 In addition, Rwanda is now on track to achieve the health-related Millennium Development Goals. The current implementation plan’s overarching goal is to accelerate “progress to middle income status and better quality of life for all Rwandans” by increasing the average annual economic growth to 11.5% and accelerating the “reduction of poverty to less than 30% of the population”.37 Expanding access to quality healthcare will continue to be a key focus of the plan moving forward.
employs Results Based Financing (RBF), a financing mechanism that provides payment based on achievement of measurable outcomes, such as number of children immunized or number of institutional deliveries. This approach has led to increases in curative care visits per person from 22 to 55 percent and in the number of institutional deliveries from 12 to 23 percent.41 This financing system is now being considered as a model for other countries. In addition, Rwanda established a new national insurance system in 2004. The minimum package of benefits through Mutuelle de Sante covers comprehensive preventative services and primary care, as well as all services and drugs provided by the health centers.
Members pay an annual fee of $6 USD per family member as well as a 10% service fee for each visit. Enrollment is voluntary and fees are adapted by income. The government covers the costs for the poorest 25% of the population. Enrollment in the program was as high as 91% in 2010 but in recent years has dropped to 73%.40
Cancer Care in Rwanda
The Butaro Hospital in the northern Burera district is home to the Cancer Center of Excellence at Butaro Hospital, the referral center for cancer care for both the district and the country. Opened in January 2011, the Butaro Hospital was established as part of the effort to rebuild the Burera district’s health system. This 160-bed district hospital provides four basic services: maternity, internal medicine, surgery and pediatrics as well as an
emergency department, outpatient ophthalmology and gynecology services, an ear nose and throat clinic and extensive laboratory capabilities. The creation of the hospital was the result of a collaboration between Partners In Health (PIH) and the government of Rwanda. Partners in Health is a US-based non-profit co-founded by Paul Farmer and committed to bringing the benefits of modern medical science to those most in need. The NGO began work to strengthen the public health system in the country at the request of the
using HIV/AIDS care as an entry point for addressing the major health problems of the rural poor.
In the beginning of the partnership, cancer was not a priority for either the
government or the local health care providers. However, successful treatment of a young pediatric cancer patient encouraged other people to seek treatment and practitioners soon saw a steady flow of patients with cancer seeking treatment.42 The Cancer Center of Excellence at Butaro Hospital was built to respond to this growing burden. Inaugurated in July of 2012, this 24 bed facility offers preventive care, pathology-based diagnosis, chemotherapy, referral for radiotherapy, follow-up, and palliative care, as well as
psychosocial and practical support such as mental health and social work services, food, transportation, and home visits. Imaging and surgery are provided at the national referral hospital in the capital, 3 hours away. All cancer care is provided free of charge regardless of the patient’s ability to pay. Between July 2013 and June 2014, 2,576 new oncology patients were seen at the Butaro Hospital Center with 1,290 representing newly enrolled patients.
Childhood Cancer in Rwanda
An analysis of cancer registries between 2007 and 2011 revealed 320 pediatric cases registered in Rwanda overall. (Rudakemwa et al., 2012) The Partners in Health Butaro Cancer Center - which provides the only source of free cancer care in the country - recorded only 102 cases of childhood cancer diagnosed between July 2012 and June 2013.43 Based on population levels, approximately 700 pediatric cancer cases are expected to be
diagnosed each year.45 This discrepancy could point to a significant level of cancer remaining undiagnosed in this population.
This study will determine the cost of treating childhood cancer in Rwanda at the Cancer Center of Excellence at Butaro Hospital. The analysis will determine the annual cost for the cancer center overall and then focus specifically on the per patient costs for treating 2 childhood cancers: Nephroblastoma (or Wilms’ Tumor) and Hodgkin Lymphoma, which were identified in the literature review as two of the most common diagnoses.
Nephroblastoma, or Wilms’ Tumor, is a common kidney cancer affecting children. Between July 2012 and June 2014, Wilms Tumor was the most common childhood malignancy seen at the Butaro Cancer Center, representing more than 20% of pediatric cancer diagnoses.46 35 cases of nephroblastoma were diagnosed at Butaro Hospital between July of 2013 and June of 2014. The majority of cases occur in children below the age of 5. Patients will often present as a malnourished child with a swollen abdomen and no acute pain or severe malaise. Diagnosis is primarily accomplished with ultrasound. In addition, chest x-rays can be conducted to detect metastases in the lungs. The treatment protocol for Wilms’ Tumor in Rwanda consists of 4-6 weeks of chemotherapy, surgery, and then 5 cycles of post-operative chemotherapy delivered in 3 week intervals.
post-treatment. While the results of the study are preliminary and more follow-up will be required, the initial relapse and loss to follow up rates are lower than those seen in other low and middle income country studies. These outcomes present a strong argument that effective cancer treatment is possible in low income countries.
CHAPTER FOUR: STUDY DESIGN AND METHODOLOGY METHODOLOGY AIM #1: COST OF THE ONCOLOGY PROGRAM IN BUTARO
Our first study aim was to determine the overall cost of the cancer program at the Butaro Cancer Center of Excellence, including both pediatric and adult diagnoses. We conducted a retrospective costing analysis from the Ministry of Health point of view utilizing secondary data from the administrative systems of the Cancer Center of Excellence at Butaro Hospital. Costs were assessed during the 2014 fiscal year - between July 1, 2013 and June 30, 2014. Each of the following sources provided data for the study:
1. Butaro Hospital Balance Sheet for the last complete fiscal year (July 2013-2014) 2. PIH Rwanda NCD FY14 Program Balance Sheet (July 2013-June 2014)
3. PIH Burera District Budget
4. PIH Procurement/Pharmacy Invoices
5. Program Data on patients diagnosed and treated between July 2013 and June 2014 in each category of disease
6. 2012 Rwandan National Reference for Rates and Hospital Centres
All costs paid in Rwandan Francs were converted to US Dollars using the January 2014 exchange rate of 680.45RWF to 1 USD.
The methodology distinguishes between 2 different cost categories:
Fixed Costs: Fixed costs are those costs that remain constant despite the number of patients treated. Examples of fixed costs within the Butaro Hospital budget include electricity and utilities, repairs and maintenance, program costs and
Variable Costs: Variable costs change with patient volume and will include chemotherapy drug costs, supportive medication costs, labor costs, laboratory tests and social support.
Table 2 summaries the oncology program cost categories and the significance of each category.
Table 2: Oncology Program Cost Categories and Significance Cost
Category
Description Line Items Included Significance
Fixed Costs costs necessary to run the program on a regular basis that remain constant despite the number of patients treated
o Overhead (building repairs and
maintenance,
electricity and utilities) o training
o vehicle purchases o equipment purchases
The annual operating costs help to inform the minimum annual financial burden to effectively support the program.
Variable Costs
recurrent costs necessary to run the program on a regular basis that change with patient volume
o chemotherapy drug costs
o supportive medication costs
o salaries
o pathology costs o Social support:
patient transport fees, food supply, and other social support
The annual variable costs help clarify the ongoing cost per patient served.
The costing model detailed below outlines a description of each cost category and the methodology for each cost category.
Fixed Costs
Overhead: The Butaro Cancer Center budget and the Butaro Hospital Budget were reviewed and cost category line items were divided into fixed and variable costs. The following fixed cost categories were identified for services shared with the hospital:
Fuel for Hospital Generator
Vehicle maintenance, fuel and repair Sewage, Electricity and Plumbing Equipment maintenance and repair Electricity
Communications Security
Landscaping
Taxes and bank fees Cleaning and laundry Cleaning Supplies
No waste disposal costs were reported and are therefore not included.
The following fixed cost categories were identified as directly attributable to the Cancer Program:
Office Supplies Training
Communication cards for oncology staff
For each shared service category, a percentage of the total was allocated to the cancer program on the basis of square footage, with the exception of “Equipment
Variable Costs
Chemotherapy Costs: All chemotherapy medications for the Oncology Program are procured and paid for by Partners in Health. All purchases and emergency orders for
chemotherapy medications and consumables related to the Oncology Program were totaled for the fiscal year 2013-2014.
Supportive Medication Costs: Supportive care is often necessary to mitigate the side-effects of cancer treatment such as anti-emetics and pain management drugs.
Supportive medications are procured and paid for from multiple sources. All supportive care medications and consumables were identified and calculated through the PIH procurement department. Non-chemotherapy related supportive medications and consumables (such as paracetamol) were calculated using the hospital pharmacy quarterly requisition sheet. We cross-referenced a list of the quarterly supportive meds and consumables (and quantities) ordered by the Butaro pharmacy for the last quarter with the annual price list from the pharmacy to develop an estimate for the total supportive meds and consumables ordered in the quarter which we then used to estimate costs over the full year and then allocated to the cancer program based on the proportion of beds.
Radiotherapy: Because there are no radiotherapy capabilities in-country, patients in need of radiotherapy are sent to Uganda. All costs related to treatment in Uganda,
including transport, medical bills and meals were totaled for the year.
Lab Tests, Imaging and Surgery: Services unavailable at the Butaro Cancer Center are conducted in the primary hospitals in Kigali. Services provided to the oncology program from the University Central Hospital of Kigali (CHUK) and the Rwanda Military Hospital (RMH) include lab tests (such as BHG, PSA and TSH), CT scans, and surgeries. Records were not available for 2014 costs; invoice totals from the 2015 calendar year were used to estimate the total cost to the program of these services.
to provide safe, effective and adequate Blood and Blood products to all patients in need by promoting voluntary non - remunerated blood donation across the country. Blood product orders placed in 2015 were used to determine a monthly average in order to estimate the total cost of blood products during the study period.
Social Support Costs: Social support is often necessary to ensure a patient’s ability to complete a full course of treatment. Patients may need transportation, food and shelter costs covered in order to be able to access treatment. Costs directly attributed to the Oncology Program were identified within the District Budget and NCD Budget. Relevant costs included assistance with burial costs, transportation to and from treatment, and new housing for cancer patients. All relevant social support costs from both the District and the NCD budgets were totaled for the year.
Labor Costs: All paid staff supporting the Oncology Program were identified
including: cashiers, anesthetists, an archivist, a stock manager, plumbers, data managers, drivers, lab techs, electricians, doctors, nurses, social workers, and a nutritionist. Each position’s annual salary was assessed, including allowances for transportation and
accommodation. Additional amounts for RAMA (Rwanda’s Medical Insurance Agency) and RSSB (Rwanda Social Security Board) were included.
Provision of care is significantly bolstered by doctors who either volunteer their time to the cancer program or are paid by their host institution. Because this labor is readily available free of charge to the cancer program from multiple sources, and we anticipate that the program will continue to have access to free labor regardless of the source, the cost for volunteer labor was not included in this analysis. However, the inclusion of volunteer costs is modeled in the scenario analysis.
and provide technical and diagnostic consultations. US-based volunteer laboratory technicians and pathologists also provide mentorship both in country and remotely. In 2014, a telepathology system was initiated allowing for increased diagnostic capacity, decreased turn-around time, and improved training. A diagnosis of cancer is determined through the pathology lab where samples are prepared and processed. During the time period of this study, no local pathologists were available for diagnosis. As a result, samples were either shipped to Boston for review at the Brigham and Young Medical Center or uploaded for remote pathology review using a telepathology system. Samples uploaded to the telepathology system were reviewed by one of 4 US-based volunteer pathologists. Each volunteer pathologist worked no more than 4 hours per week. During the time of the study, these services were donated free of charge to the program
Costs to the program for the development of pathology services were captured in the NCD Budget and included items such as shipment of samples to Boston, training and travel costs for pathology lab technicians, and customs and duties for reagents. Pathology
services were provided by the Brigham and Women’s Hospital free of charge to the program and are therefore not included in the analysis. Similar start-up support could be expected for future sites. However, the program has now moved to a system utilizing local
pathologists so future costs are predicted with the cost of local pathologists included. METHODOLOGY AIM #2: COST OF TREATING A CHILD WITH WILMS’ TUMOR
Overhead
Chemotherapy and Supportive Care Medications:
The treatment protocol outlined above require a number of both chemotherapy and supportive care drugs for each patient. All chemotherapy and supportive care drugs were enumerated following the established protocol for treatment of each disease in Rwanda. Based on practitioner advice as to the average size of a typical patient, the costing assumes a .6m2 body surface area for the patient. For each drug: the number of cycles, the dose per cycle and the total dose in mg per cycle was calculated according to the following equations:
# of vials required per cycle = (individual recommended dosage*body surface area)/# of mg in available vial size [answer is rounded up to the next whole number]
Price for a full course of treatment = # of vials required per cycle*# of cycles*price/vial
This methodology calculates drug usage as well as waste and leads to conservative
estimates, as prices can be significantly reduced by either procuring smaller additional vial sizes and/or treating more patients with the same disease on the same days.
CT Scans and Surgery
CT Scans and Surgery are conducted off-site at the primary hospital in Kigali. The national health insurance, Mutelle de Sante, covers 90% of all costs with the program covering the additional 10% for vulnerable patients. The 2012 Rwandan National Reference for Rates and Hospital Centres was used to determine the full cost of appropriate CT Scans and Surgery per patient.
Radiotherapy
Blood Products
All blood products are provided free of charge to local hospitals through the National Center for Blood Transfusion Division (NCBT). The cost given by the NCBT for each RBC unit is $88. Provider interviews were used to determine an average use of 5 RBC units (Red Blood Cell units available for transfusion) per patient over the treatment cycle.
Transportation Costs
The Butaro Cancer Center is located in a remote district of Rwanda, 3 hours from the capital. Transportation support is a critical component of the program. The median round trip cost of transport was combined with the average number of trips for a full course of treatment and follow-up to determine the full cost per patient of supporting transportation for treatment.
Labor Costs
We identified all relevant hospital staff involved in the treatment of pediatric cancer patients including doctors, nurses, social workers, cashiers, intake coordinators and
pharmacy staff. We then interviewed clinicians to determine the major activities performed in treating each type of cancer and created process maps to estimate the amount of time each type of provider spends on each activity with each patient. We adjusted staff salaries by the estimated total number of paid hours worked each year to determine a cost per hour for each provider. The cost per hour was allocated by provider to the relevant patient care activities in order to create a total staff cost per patient.
METHODOLOGY AIM #3: COST OF TREATING A CHILD WITH HODGKINS LYMPHOMA Overhead
Chemotherapy and Supportive Care Medications
The treatment protocol outlined above require a number of both chemotherapy and supportive care drugs for each patient. All chemotherapy and supportive care drugs were enumerated following the established protocol for treatment in Rwanda. Based on
practitioner advice as to the average size of a typical patient, the costing assumes a 1m2 body surface area and weight of 30kg for the patient. For each drug: the number of cycles, the dose per cycle and the total dose in mg per cycle was calculated according to the
following equations:
# of vials required per cycle = (individual recommended dosage*body surface area)/# of mg in available vial size [answer is rounded up to the next whole number]
Price for a full course of treatment = # of vials required per cycle*# of cycles*price/vial
This methodology calculates drug usage as well as waste and leads to conservative estimates, as prices can be significantly reduced by either procuring additional vial sizes and/or treating more patients with the same disease on the same days.
CT Scans and Radiotherapy
Blood Products
All blood products are provided free of charge to local hospitals through the National Center for Blood Transfusion Division (NCBT). The cost given by the NCBT for each RBC unit is $88. Provider interviews were used to determine an average use of 7 RBC units (Red Blood Cell units available for transfusion) per patient over the treatment cycle.
Transportation Costs
The Butaro Cancer Center is located in a remote district of Rwanda, 3 hours from the capital. As a result, transportation support is a critical component of the program. The median round trip cost of transport was used along with the average number of trips for a full course of treatment and follow-up to determine the full cost per patient of supporting transportation for treatment.
Labor Costs
We identified all relevant hospital staff involved in the treatment of pediatric cancer patients including doctors, nurses, social workers, cashiers, intake coordinators and
CHAPTER FIVE: RESULTS AIM #1: BUTARO CANCER CENTER OF EXCELLENCE
We conducted a retrospective costing analysis utilizing secondary data from the administrative systems of the Cancer Center of Excellence at Butaro Hospital. Costs were assessed between July 1, 2013 and June 30, 2014 from the Ministry of Health perspective. We determined the annual operating cost of the cancer program at the Butaro Cancer Center of Excellence to be $953,499. An additional $556,105 was assessed as start-up funds necessary to run the program within the existing infrastructure.
Fixed Costs
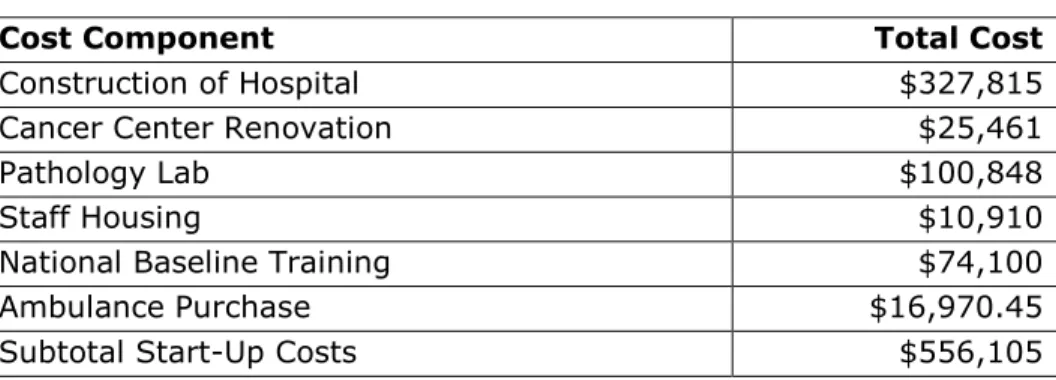
Start-Up Costs: All start-up costs for the program totaled $556,105 (Table 3). This included the cost of constructing and renovating the hospital to build the Cancer Center and an ambulance purchase as well as the equipment and supply purchases necessary to equip the pathology lab and ward. Equipment for the pathology lab included all equipment necessary to run the lab, such as microtomes, tissue processors and cameras and microscopes. Training costs included those related to the national Baseline Cancer Care Training. This initiative, supported by GlaxoSmithKline, trained nurses and doctors across the country to gain foundational knowledge on cancer, its epidemiology, and available treatments, as well as the main cancers and treatment priorities in Rwanda. As a train- the-trainer initiative, limited training costs are on-going; however, the bulk of the program cost was a one-time expense intended to foster a robust referral network and early
Table 3: Oncology Program Start-Up Costs
Cost Component Total Cost
Construction of Hospital $327,815
Cancer Center Renovation $25,461
Pathology Lab $100,848
Staff Housing $10,910
National Baseline Training $74,100
Ambulance Purchase $16,970.45
Subtotal Start-Up Costs $556,105
Overhead: Table 4 outlines the cost categories pertaining to overhead expenses during the 2013-2014 fiscal year. Services shared with the hospital were allocated to the cancer program on the basis of square footage. Administrative salaries for the hospital were estimated to be $250,796 and were then allocated to the cancer center on the basis of beds. Expenditures directly attributable to the cancer program were totaled.
Table 4: Oncology Program Overhead Expenses
Expenditure Category Total Cost in USD Vehicle maintenance, fuel and repair $4,861.17 Sewage, Electricity and Plumbing $7,994.99 Equipment maintenance and repair $1,713.62
Communications $88.17
Security, Landscaping and Cleaning
Supplies $4,352.27
Office Supplies $1,881.40
Taxes and Fees $3,023.23
Administrative Salaries $41,799.27
Variable Costs
All purchases and emergency orders for chemotherapy medications, supportive care and consumables related to the Oncology Program for the fiscal year 2013-2014 totaled $134,920 US. This included purchases of cancer drugs, supportive drugs such as anti-nausea medications, and consumables.
A total of $236,844 was incurred for patients receiving radiotherapy in Uganda, including transport, medical bills and meals.
The cost of the delivery of pathology services was found to be $58,190, including items such as shipment of samples to Boston, training and travel costs for pathology lab technicians, customs and duties for reagents, and consumables related to the pathology lab. Pathology services for samples sent to Boston were provided by the Brigham and Women’s Hospital free of charge to the program. Samples that were not sent to Boston, were uploaded to the telepathology system and reviewed by one of 4 US-based volunteer pathologists. Each volunteer pathologist worked no more than 4 hours per week. These services were also donated free of charge to the program. Because all start-up pathology services were available free of charge to the program and would likely continue to be if new sites were constructed, the cost of providing these services is not included in the cost analysis. However, all costs that the program does incur (such as shipping and customs) were included. A model for estimating the cost of providing these services in-house is included in the Forecasting Future Costs analysis.
The total cost of services provided to the oncology program from the University Central Hospital of Kigali (CHUK) and the Rwanda Military Hospital (RMH) was estimated to be $75,125, including lab tests, CT Scans, and surgeries.
housing for cancer patients. The majority of the cost ($15,824) was directly related to providing patient housing.
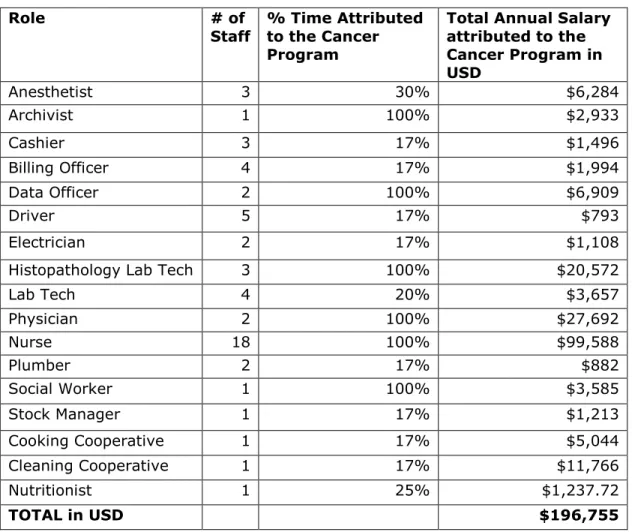
Annual salaries for all paid staff supporting the Oncology Program totaled $196,755. Table 5 outlines positions, salaries and percent time attributed to the cancer program. Salaries included allowances for transportation and accommodation as well as RAMA (Rwanda’s Medical Insurance Agency) and RSSB (Rwanda Social Security Board) and were adjusted in accordance with time dedicated to the cancer program. Positions shared across all hospital functions were allocated on the basis of the proportion of beds dedicated to the cancer program.
Table 5: Oncology Program Labor Costs
Role # of
Staff
% Time Attributed to the Cancer Program
Total Annual Salary attributed to the Cancer Program in USD
Anesthetist 3 30% $6,284
Archivist 1 100% $2,933
Cashier 3 17% $1,496
Billing Officer 4 17% $1,994
Data Officer 2 100% $6,909
Driver 5 17% $793
Electrician 2 17% $1,108
Histopathology Lab Tech 3 100% $20,572
Lab Tech 4 20% $3,657
Physician 2 100% $27,692
Nurse 18 100% $99,588
Plumber 2 17% $882
Social Worker 1 100% $3,585
Stock Manager 1 17% $1,213
Cooking Cooperative 1 17% $5,044
Cleaning Cooperative 1 17% $11,766
Nutritionist 1 25% $1,237.72
Total Costs
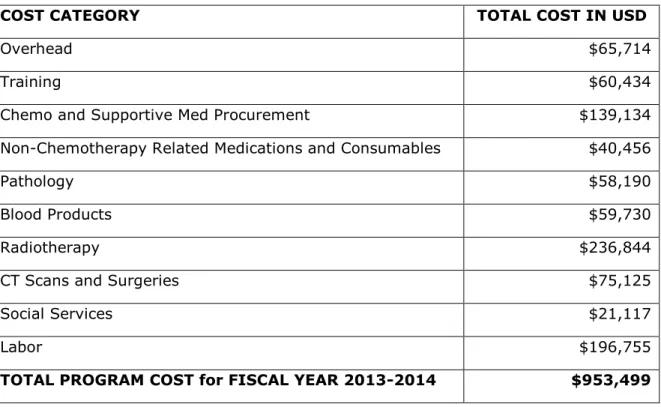
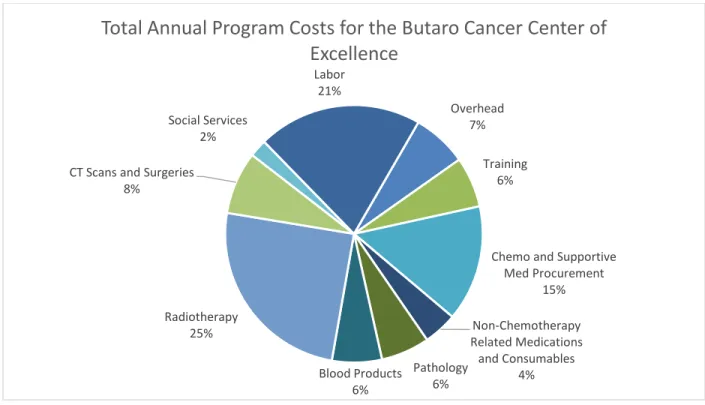
The total annual operating cost for the Butaro Cancer Center of Excellence was estimated to be $953,499 (Table 6). This represents the cost of treating 1,290 new patients and an additional 1,286 existing patients during the study period. The cost of chemotherapy, radiotherapy, and labor were the most significant cost drivers for the program. Surprisingly, given the relatively low number of patients sent to Uganda, radiotherapy services were the most significant cost driver comprising 25% of program costs. Labor was the second largest cost driver, accounting for 21% of the overall cost, followed by chemotherapy and supportive medications and consumables at 15%. Overhead, training, CT scans and surgeries, blood products, non-chemotherapy related medications and supplies, pathology, and social services all accounted for less than 10% of the total. Figure 1 presents the proportions of cost by category.
Table 6: Total Cost for the Butaro Cancer Center across All Categories
COST CATEGORY TOTAL COST IN USD
Overhead $65,714
Training $60,434
Chemo and Supportive Med Procurement $139,134
Non-Chemotherapy Related Medications and Consumables $40,456
Pathology $58,190
Blood Products $59,730
Radiotherapy $236,844
CT Scans and Surgeries $75,125
Social Services $21,117
Labor $196,755
Figure 1: Proportion of Cost by Cost Category
AIM #2: WILMS TUMOR
We determined the cost of a full course of treatment for a child with Wilms Tumor at the Butaro Cancer Center of Excellence to be $2,036 (including diagnosis, treatment and follow-up).
Chemotherapy
Assuming a child with a BSA of .6m2, a weight of 15kg and metastatic Wilms Tumor, the Rwandan protocol calls for 9 doses over 9 weeks of vincristine (1.5 mg/m2, maximum 2mg), 5 doses (every other week) of actinomycin D (45 ug/kg IV, maximum 2mg) and 3 doses Doxorubicin 50mg/m2 before surgery. This is followed by 11-weeks of vincristine (1.5 mg/m2, maximum 2mg), 5 doses of actinomycin D (45 ug/kg IV, maximum 2mg) and 5 doses Doxorubicin 50mg/m2 post-surgery. Costs per patient are outlined in Table 7.
Overhead 7%
Training 6%
Chemo and Supportive Med Procurement
15%
Non-Chemotherapy Related Medications
and Consumables 4% Pathology
6% Blood Products
6% Radiotherapy
25% CT Scans and Surgeries
8%
Social Services 2%
Labor 21%
Table 7: Chemotherapy Costs for Wilms Tumor Patients
Drug Unit Price
(in $US) # vials needed for full cycle Total Price (in $US)
Vincristine 1.1 20 $22.00
Actinomycin-D 12.5 20 $250.00
Doxorubicin 9.8 8 $78.40
Total Cost $350.40
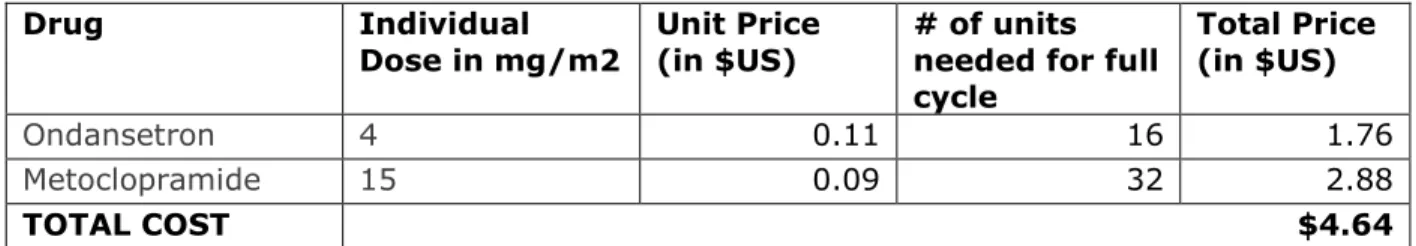
Supportive Medicines
A total of $4.64 is spent on chemotherapy-specific supportive medications for Wilms Tumor Patients (Table 8).
Table 8: Supportive Medication Costs for Wilms Tumor Patients
Drug Individual
Dose in mg/m2 Unit Price (in $US) # of units needed for full cycle
Total Price (in $US)
Ondansetron 4 0.11 16 1.76
Metoclopramide 15 0.09 32 2.88
TOTAL COST $4.64
Blood Products
All blood products are provided free of charge to local hospitals through the National Center for Blood Transfusion Division (NCBT). Assuming an average use of 5 RBC units (Red Blood Cell units available for transfusion) per patient over the treatment cycle, the cost per patient is $440.
Radiotherapy Services
Radiotherapy is provided through an agreement with Mulago Hospital in Uganda. The cost of accommodation and travel along with the medical bills for radiation and
hospitalization are covered by the program. Due to the lack of in-country treatment and the great expense, radiotherapy is only offered in limited circumstances and where cancer treatment intent is curative. The average cost for one patient to receive radiotherapy
However, because only 4% of patients received this care, the cost per patient is significantly less when allocated across the patient population. The resulting cost per patient is $120.51. Imaging and Surgical Costs
CT Scans are conducted in the primary hospital in Kigali and supported by the Ministry of Health. The patient is responsible for the cost of the CT Scans. Imaging is covered by the Mutelle de Sante program; therefore, any patient with the community insurance will have 90% of the cost of their scan paid and will be responsible for the other 10%. For vulnerable patients, the oncology program will cover any costs not paid by
insurance. The cost to the Ministry is therefore typically 90% of the full cost of the scans. A CT Scan is recommended for the abdomen both pre- and post-treatment. According to the 2012 Rwandan National Reference for Rates and Hospital Centres, the cost of the abdominal CT Scan is $141.08. Transport from Butaro to Kigali is included at a cost of $13.23 per roundtrip. The cost of surgery for a Wilms Tumor patient is $91.26. The cost of 2 sets of CT Scans, surgery and transportation for each totals $384.90 per patient.
Social Support Costs
Transportation stipends are necessary to ensure a patient’s ability to complete a full course of treatment. The median round trip cost of transport is 8,200 RWF (approximately 12 USD). Assuming a patient with Wilms Tumor makes at least 24 trips to the Cancer Center (including 9 trips for pre-surgical chemotherapy, 11 trips for post-surgical
chemotherapy and 4 follow up appointments), the resulting cost would be a total of $289 for a full course of treatment.
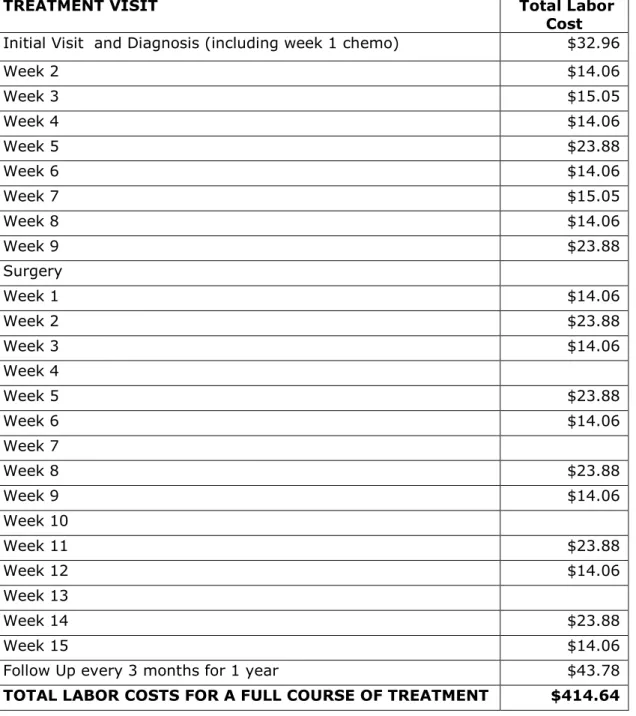
Labor
Total labor costs for the treatment of Wilms Tumor were determined to be $414.64 (Table 9). Calculations included doctors, nurses, social workers, cashiers, intake
estimate the amount of time each type of provider spends on each activity with each patient. Staff salaries were adjusted by the estimated total number of paid hours actually worked each year to determine a cost per minute for each provider. This was then
multiplied by the time spent on the patient care activities identified to create a total staff cost per patient. Given the short duration of treatment, we did not apply a discount rate.
Table 9: Total Labor Cost for Wilms Tumor
TREATMENT VISIT Total Labor
Cost Initial Visit and Diagnosis (including week 1 chemo) $32.96
Week 2 $14.06
Week 3 $15.05
Week 4 $14.06
Week 5 $23.88
Week 6 $14.06
Week 7 $15.05
Week 8 $14.06
Week 9 $23.88
Surgery
Week 1 $14.06
Week 2 $23.88
Week 3 $14.06
Week 4
Week 5 $23.88
Week 6 $14.06
Week 7
Week 8 $23.88
Week 9 $14.06
Week 10
Week 11 $23.88
Week 12 $14.06
Week 13
Week 14 $23.88
Week 15 $14.06
Follow Up every 3 months for 1 year $43.78
Equipment and Supplies
The total annualized per patient cost was calculated to be $26, including costs for cancer center construction and renovation, ambulance purchase and equipment and pathology equipment and supplies (Table 10). Costs for equipment and supplies were distributed across all service-life years and adjusted from the annual to current costing year.
Table 10: Annualized Cost per Wilms Tumor Patient
Expenditure Category Total Cost in USD Total Annualized Cost in USD
Pathology Lab and Equipment $100,848 $20,231
Cancer Center Construction $327,815 $40,229
Cancer Center Renovation Costs $25,461 $3,123
Ambulance Purchase $16,970 $3,195
Total Annualized Capital Costs $66,779
Total per Patient $26
Overhead