Comparison of Urine Output among Patients Treated
with More Intensive Versus Less Intensive RRT: Results
from the Acute Renal Failure Trial Network Study
Finnian R. Mc Causland,*†Josephine Asafu-Adjei,‡Rebecca A. Betensky,§Paul M. Palevsky,|¶and Sushrut S. Waikar*†
Abstract
Background and objectivesIntensive RRT may have adverse effects that account for the absence of benefit observed in randomized trials of more intensive versus less intensive RRT. We wished to determine the asso-ciation of more intensive RRT with changes in urine output as a marker of worsening residual renal function in critically ill patients with severe AKI.
Design, setting, participants, & measurementsThe Acute Renal Failure Trial Network Study (n=1124) was a multicenter trial that randomized critically ill patients requiring initiation of RRT to more intensive (hemodialysis or sustained low–efficiency dialysis six times per week or continuous venovenous hemodiafiltration at 35 ml/kg per hour) versus less intensive (hemodialysis or sustained low–efficiency dialysis three times per week or con-tinuous venovenous hemodiafiltration at 20 ml/kg per hour) RRT. Mixed linear regression models werefit to estimate the association of RRT intensity with change in daily urine output in survivors through day 7 (n=871); Cox regression models werefit to determine the association of RRT intensity with time to$50% decline in urine output in all patients through day 28.
ResultsMean age of participants was 60615 years old, 72% were men, and 30% were diabetic. In unadjusted models, among patients who survived$7 days, mean urine output was, on average, 31.7 ml/d higher (95% confidence interval, 8.2 to 55.2 ml/d) for the less intensive group compared with the more intensive group (P50.01). More intensive RRT was associated with 29% greater unadjusted risk of decline in urine output of$50% (hazard ratio, 1.29; 95% confidence interval, 1.10 to 1.51).
ConclusionsMore intensive versus less intensive RRT is associated with a greater reduction in urine output during thefirst 7 days of therapy and a greater risk of developing a decline in urine output of$50% in critically ill patients with severe AKI.
Clin J Am Soc Nephrol11: 1335–1342, 2016. doi: 10.2215/CJN.10991015
Introduction
Critically ill patients who develop AKI requiring RRT have a high estimated mortality of approximately 50%–60% (1–3). The use of RRT in this clinical setting is designed to optimize acid-base balance, small sol-ute clearance, and volume control. Providing more intensive RRT (via greater solute clearance as mea-sured by urea kinetic modeling) was, therefore, hy-pothesized to be beneficial (4–6). However, when tested in subsequent larger randomized, controlled trials, higher-intensity RRT in AKI has failed to im-prove outcomes compared with standard intensity therapy (7–9). A potential explanation for the absence of benefit may be an increased risk of adverse events associated with more intensive therapy. Enhanced clearance of small solutes may result in electrolyte depletion (8,10), and enhanced removal of antibiotics may result in decreased efficacy in the treatment of infections (11,12). In addition, untoward hemodynamic effects, such as greater frequency of intradialytic
hypotension (IDH;e.g., precipitated by rapid changes in plasma osmolality) (8), may exacerbate organ ische-mia, including hypoperfusion of the already injured kidney parenchyma.
Preservation of urine output is an important prog-nostic indicator in the setting of AKI. Patients with AKI who develop reduced urine output have sub-stantially greater risk of death (13–16), longer dura-tion of dialysis dependence (16), and longer hospital stay (13) compared with those who do not. Reduced urine output in patients with AKI requiring RRT may indicate a greater severity of kidney injury with less likelihood of renal recovery (17), greater associated mortality (14), and predisposition to complications related to volume management (18,19). No study to our knowledge has tested whether more intensive RRT in AKI leads to a reduction in urine output, a potential surrogate marker of residual renal function. To test the hypothesis that more intensive RRT may cause adverse effects on urine output, we performed a
*Renal Division, Department of Medicine, Brigham and Women’s Hospital, Boston, Massachusetts; †Harvard Medical School, Boston, Massachusetts; ‡Department of Biostatistics, School of Nursing, University of North Carolina at Chapel Hill, Chapel Hill, North Carolina; §Department of Biostatistics, Harvard School of Public Health, Boston, Massachusetts;|Renal Section, Veterans Affairs Pittsburgh Healthcare System, Pittsburgh, Pennsylvania; and ¶Renal-Electrolyte Division, Department of Medicine, University of Pittsburgh School of Medicine, Pittsburgh, Pennsylvania
Correspondence: Dr. Finnian R. Mc Causland, MRB-4, Brigham and Women’s Hospital, Boston, MA 02446. Email: fmccausland@ partners.org
post hocanalysis of the Acute Renal Failure Trial Network (ATN) Study to determine the association of more inten-sive versus less inteninten-sive RRT with postrandomization changes in urine volume.
Materials and Methods Study Design and Population
The ATN Study was a prospective, multicenter, ran-domized clinical trial of more intensive (hemodialysis [HD] or sustained low–efficiency dialysis six times per week or continuous venovenous hemodiafiltration at 35 ml/kg per hour) versus less intensive (HD or sustained low– efficiency dialysis three times per week or continuous venovenous hemodiafiltration at 20 ml/kg per hour) RRT in critically ill patients with a clinical diagnosis con-sistent with acute tubular necrosis (n=1124). Details of the study design have been previously reported (8,20). Notable exclusion criteria included a baseline serum cre-atinine .2 mg/dl for men and.1.5 mg/dl for women, AKI felt to not be caused by acute tubular necrosis, more than one HD treatment or.24 hours of continuous RRT before randomization, and expected survival ,28 days because of an underlying terminal chronic condition. Survival to day 7 (n=871) was a prespecified requirement
for our primarypost hocanalyses because of the compet-ing risk of mortality in critically ill patients with AKI. The study protocol pertaining to these post hocanalyses was deemed exempt under 42 CFR §46.101(b)(4) by the Part-ners Healthcare Institutional Review Board.
Exposures and Outcomes
The exposure of interest was the randomized treatment assignment of more intensive versus less intensive RRT. The primary outcome of interest was the rate of change in daily urine output in patients who survived from random-ization through (and including) day 7 (n=871). Additional analyses were performed to determine the association of more intensive versus less intensive RRT with the need for continued RRT at days 28 and 60. The secondary outcome was the time to$50% decline in daily urine output in the complete cohort from randomization through day 28 (n=1103). The majority of urine outputs (95.7%) were re-corded as timed 24-hour collections during each study day. For those with collection periods other than 24 hours (median =12 hours; interquartile range [IQR], 7–16 hours), the estimated daily output was extrapolated according to the following equation: daily urine output = (urine volume/hours of collection)324.
Study Data
All study data in the ATN Study were recorded on case report forms and submitted to a central data coordinating center. Demographic data (sex, race, and age), comorbid data (ischemic heart disease, congestive heart failure, peripheral vascular disease, hypertension, stroke, liver disease, diabetes, malignancy, baseline cardiovascular [CV] sequential organ failure assessment [SOFA] score, and 24-hour urine volume), and anthropometric data (weight and height) were recorded at baseline for all participants. The original ATN Study defined baseline oliguria as an average urine output ,20 ml/h over a
24-hour period. However, in light of the observed distribu-tion of the baseline 24-hour urine volumes, we defined base-line oliguria as a 24-hour urine volume,110 ml/d (the 25th percentile). Postrandomization physiologic data, in-cluding urine volume, BUN, the CV component of the SOFA score, and net fluid balance (total intake 2 [total output + ultrafiltration]), were recorded on days 1–14, 21, and 28.
Statistical Analyses
Continuous variables were examined graphically and recorded as means (6SDs) for normally distributed data or medians (with IQRs) for non–normally distributed data. Comparisons were made using t tests or Wilcoxon rank sum tests as appropriate. Categorical variables were exam-ined by frequency distribution and recorded as propor-tions, and comparisons were made using the chi-squared test. To model the daily urine output for the primary anal-yses, the following unadjusted linear mixed model wasfit (model 1), whereYijkdenotes the urine output for patientk in treatment groupi(i=1→less intensive RRT;i=2→more intensive RRT) on day j: E[Yijk]=m. . .+ti+a3j+gi3
j+dj(k)+«ijk. In this model, m represents the intercept, ti represents a fixed effect for treatment i, a represents a fixed effect for day j, gi represents an interaction effect for treatmentiand dayj,dj(k)represents a random effect of dayjnested within patientk(to account for correlation among urine output levels within each patient across time), and«ijk represents an error term for Yijk, which is normally distributed with mean =0 and variance ofs2
«. We
alsofit separate unadjusted models to assess each of the following effects on daily urine output: (1) the interaction between treatment assignment and treatment modality and (2) the interaction between treatment assignment and baseline urine output. Subsequently, a multivariable model was fit (model 2) that adjusted for the following baseline variables: sex, race (black versus nonblack), age, ischemic heart disease, congestive heart failure, peripheral vascular disease, hypertension, stroke, liver disease, dia-betes, malignancy, CV component of the SOFA score (0, 1, 2, 3, or 4), oliguria, weight, and height. All models were implemented in SAS (SAS Institute Inc., Cary, NC) using PROC GLIMMIX, where the Kenward–Roger denominator degrees of freedom method was used. Analogous models werefit for those who survived through day 28.
Exploratory models examining the daily rate of change werefit by adjusting for the same covariates as model 2 in addition to individual adjustment for time–varying cova-riates of interest (for survivors through day 7). These pre-specified covariates included daily measurement of BUN, CV SOFA score, and netfluid balance. Logistic regression models were subsequentlyfit to determine the unadjusted and adjusted (model 2) associations of RRT intensity with the need for continued RRT at days 28 and 60.
Results
Of the 1124 individuals in the ATN Study, 871 survived through day 7 and were included in our primary analyses. Mean age was 59.6615.3 years old, 14.9% were black, and 30.4% were diabetic. The demographic and comorbid char-acteristics of individuals according to randomized treat-ment arms were comparable at baseline (Table 1). During the first 7 days of the study, the average CV SOFA score and ultrafiltration volume achieved by RRT were similar between the treatment arms. BUN was lower in the more intensive arm, whereas netfluid balance was more negative in the less intensive arm (Table 2).
Rate of Change in Daily Urine Output from Randomization through Day 7
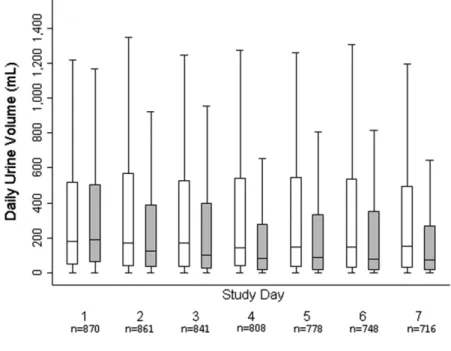
Urine volume at the time of randomization was similar in both groups (median =264 ml/d; IQR, 106–473 in the less intensive group and median =274 ml/d; IQR, 110–489 in the more intensive group;Pdifference =0.49). During the initial 7-day period, the unadjusted mean urine output in-creased by 23.2 (95% confidence interval [95% CI], 6.6 to 39.8) ml/d with less intensive therapy and decreased by 8.5 (95% CI,225.2 to 8.1) ml/d with more intensive ther-apy (Figure 1). The difference in the daily rate of change in urine output was 31.7 (95% CI, 8.2 to 55.2) ml/d higher, favoring the less intensive therapy arm. When adjusted for baseline covariates (model 2), the mean urine output in-creased by 26.6 (95% CI, 9.4 to 43.7) ml/d with less inten-sive therapy and decreased by 9.7 (95% CI,227.0 to 7.6) ml/d with more intensive therapy. The difference was 36.3
(95% CI, 11.9 to 60.7) ml/d, favoring the less intensive therapy arm. In exploratory analyses aimed at uncovering potential pathway intermediaries, three prespecified time– varying covariates (net dailyfluid balance, BUN, and CV component of the SOFA score) were added individually to model 2. Each resulted in a modest attenuation of the ef-fect estimate for the difference in daily rate of change com-pared with model 2 alone (Table 3).
When the analyses were restricted to those who survived through day 28, the unadjusted mean urine output increased by 3.5 (95% CI,22.9 to 9.8) ml/d with less intensive therapy and decreased by 2.7 (95% CI,28.8 to 3.4) ml/d with more intensive therapy. The difference was 6.2 (95% CI, 22.6 to 15.0) ml/d higher with less intensive therapy. When ad-justed for baseline covariates (model 2), the mean urine out-put increased by 4.6 (95% CI,22.0 to 11.2) ml/d with less intensive therapy and decreased by 1.6 (95% CI, 27.9 to 4.8) ml/d with more intensive therapy. The difference was 6.1 (95% CI,23.0 to 15.3) ml/d higher with less intensive therapy. There was no evidence for effect modification on the basis of modality of RRT (Pinteraction.0.90). When base-line urine output was considered as a continuous variable, there was marginal evidence for the presence of effect modification (P interaction =0.08). Therefore, exploratory analyses were performed to assess the association of treat-ment assigntreat-ment in the subgroups of patients who were oliguric and patients who were not oliguric. For those who were oliguric at baseline, the adjusted difference (model 2) in the daily rate of change in urine output was 11.4 ml/d (95% CI,217.0 to 39.8), in favor of the less intensive arm; for those
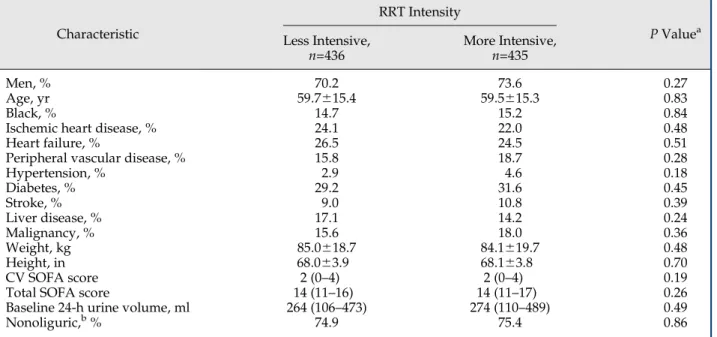
Table 1. Baseline characteristics of individuals who survive through day 7 according to RRT intensity randomized groups
Characteristic
RRT Intensity
PValuea Less Intensive,
n=436
More Intensive,
n=435
Men, % 70.2 73.6 0.27
Age, yr 59.7615.4 59.5615.3 0.83
Black, % 14.7 15.2 0.84
Ischemic heart disease, % 24.1 22.0 0.48
Heart failure, % 26.5 24.5 0.51
Peripheral vascular disease, % 15.8 18.7 0.28
Hypertension, % 2.9 4.6 0.18
Diabetes, % 29.2 31.6 0.45
Stroke, % 9.0 10.8 0.39
Liver disease, % 17.1 14.2 0.24
Malignancy, % 15.6 18.0 0.36
Weight, kg 85.0618.7 84.1619.7 0.48
Height, in 68.063.9 68.163.8 0.70
CV SOFA score 2 (0–4) 2 (0–4) 0.19
Total SOFA score 14 (11–16) 14 (11–17) 0.26
Baseline 24-h urine volume, ml 264 (106–473) 274 (110–489) 0.49
Nonoliguric,b% 74.9 75.4 0.86
CV SOFA, cardiovascular component of the sequential organ failure assessment score at baseline; SOFA, sequential organ failure assessment score.
aPvalue for difference; significance testing was byttest or Wilcoxon rank sum test for continuous variables or chi-squared test for
categorical variables. Continuous variables are presented as means6SDs if normally distributed and medians (25th to 75th percentiles) if non-normally distributed.
who were nonoliguric at baseline, the adjusted difference in the daily rate of change was 45.7 ml/d (95% CI, 14.2 to 77.2), in favor of the less intensive arm (Table 4).
Consistent with the results of the primary study (8), there was no association of more intensive RRT with a greater odds for continued RRT requirement at either day 28 (unadjusted odds ratio [OR], 1.26; 95% CI, 0.96 to 1.64 and adjusted OR, 1.32; 95% CI, 0.98 to 1.77) or day 60 (unadjusted OR, 1.20; 95% CI, 0.87 to 1.65 and adjusted OR, 1.26; 95% CI, 0.88 to 1.79).
Time to‡50% Decline in Urine Output from Randomization through Day 28
In unadjusted analyses, there was a 29% greater risk of$50% decline in daily urine output (hazard ratio, 1.29;
95% CI, 1.10 to 1.51; P=0.001) in patients randomized to more intensive versus less intensive therapy (Figure 2). When adjusted for baseline covariates (model 2), the effect estimate was accentuated (hazard ratio, 1.37; 95% CI, 1.15 to 1.63). The results were qualitatively similar when the composite outcome of time to death or $50% decline of urine output was considered (data not shown).
Discussion
In thispost hocanalysis of the ATN Trial Study, we re-port that more intensive RRT in critically ill patients with AKI resulted in a greater reduction in the daily rate of change in urine output than less intensive dosing of RRT
Figure 1.|Box plots of daily urine output according to RRT intensity.Less intensive is shown in white, and more intensive is shown in gray. The top line of each box represents the 75th percentile, the middle line represents the 50th percentile, and the bottom line represents the 25th percentile.
Table 2. Differences in physiologic parameters of interest in individuals who survived through day 7
Characteristic
RRT Intensity
PValue
Less Intensive More Intensive
No. of treatments 5 (3–7) 6 (6–7) ,0.001
CV SOFA score 2 (0–4) 1 (0–4) 0.07
BUN, mg/dl 48 (34–67) 35 (24–51) ,0.001
Ins 2500 (1530–3980) 2830 (1770–4397) ,0.001
Outs 722 (262–1600) 614 (200–1420) ,0.001
Urine 159 (35–530) 106 (20–365) ,0.001
UF volume, ml 1850 (524–3000) 1700 (500–3000) 0.22
Net balance, ml 2220 (21500–1301) 4 (21304–1712) ,0.001
during thefirst week of therapy but did not result in dif-ferences in dialysis dependence at day 28 or 60. We also report that patients randomized to more intensive therapy had a greater risk of decline in urine output of $50%.
These results suggest that lower urine output is a potential early adverse effect of more intensive RRT.
Before the availability of routine biochemical analyses, urine output was the major parameter by which changes in Table 3. Differences (less intensive RRT2more intensive RRT) in rate of change in daily urine output with individual additional adjustment for prespecified time–varying covariates in individuals who survived through day 7
Model
Daily Rate of Change in Urine Output
Less Intensive RRT
More Intensive RRT
Difference
(Less Intensive2More Intensive)
Unadjusted,n=871 Rate, ml/d (95%
confidence interval) 23.2 (6.6 to 39.8) 28.5 (225.2 to 8.1) 31.7 (8.2 to 55.2)
Pvalue 0.01 0.31 0.01
Model 2,n=783 Rate, ml/d (95%
confidence interval) 26.6 (9.4 to 43.7) 29.7 (227.0 to 7.6) 36.3 (11.9 to 60.7)
Pvalue 0.002 0.27 0.004
Model 2 and daily net fluid balance,n=775 Rate, ml/d (95%
confidence interval) 14.8 (1.2 to 28.4) 218.2 (231.3 to25.1) 33.0 (14.2 to 51.7)
Pvalue 0.03 0.01 ,0.001
Model 2 and daily CV SOFA score,n=776 Rate, ml/d (95%
confidence interval) 2.2 (213.9 to 18.2) 227.3 (242.7 to211.9) 29.5 (7.5 to 51.5)
Pvalue 0.79 ,0.001 0.01
Model 2 and daily BUN,n=783 Rate, ml/d (95%
confidence interval) 26.8 (9.5 to 44.1) 24.3 (222.1 to 13.4) 31.2 (6.6 to 55.7)
Pvalue 0.002 0.63 0.01
Model 2 was adjusted for baseline sex, race (black versus nonblack), age, ischemic heart disease, congestive heart failure, peripheral vascular disease, hypertension, stroke, liver disease, diabetes, malignancy, cardiovascular component of the sequential organ failure assessment score (CV SOFA) score (0, 1, 2, 3 or 4), oliguria, weight, and height.
Table 4. Analyses of the daily rate of change in urine output according to the presence or absence of baseline oliguria in individuals who survived through day 7
Sub-Group
Daily Rate of Change in Urine Output
Less Intensive RRT
More Intensive RRT
Difference
(Less Intensive2More Intensive)
Oliguria
(model 2),n=198
Rate, ml/d (95% CI) 29.9 (9.9 to 49.9) 18.5 (21.6 to 38.6) 11.4 (217.0 to 39.8)
Pvalue 0.003 0.07 0.43
Nonoliguria
(model 2),n=585
Rate, ml/d (95% CI) 25.5 (3.3 to 47.6) 220.2 (242.6 to 2.2) 45.7 (14.2 to 77.2)
PValue 0.02 0.08 0.004
kidney function could be assessed; it remains an important clinical parameter in everyday practice. Several consensus panels have incorporated lower thresholds of urine output in the definition of AKI (e.g., RIFLE [21], AKI Network [AKIN] [22], and Kidney Disease Improving Global Out-comes [23]) in recognition of the association of decreased urine output in critically ill patients with adverse out-comes. For example, in 1977, Andersonet al.(13) studied 90 patients with AKI (defined as persistent rise in serum creatinine .2 mg/dl despite corrective measures) and re-ported that patients who were not oliguric had a signifi-cantly shorter hospital stay, required RRT less frequently, and had lower mortality than those with oliguria. More recently, Oh et al. (16) examined urine output measure-ments over the 6-hour period before the initiation of con-tinuous RRT in 361 critically ill Korean patients. They found that those with predialysis 6-hour urine outputs above the median ($107 ml) had lower mortality in both unadjusted and case mix–adjusted analyses. Similar patterns of association with mortality have been reported in studies from South America (15) and Canada (14).
Greater degrees of volume overload have been associ-ated with a higher risk of adverse outcomes, including greater risk of 60-day mortality (24,25), longer duration of ventilator dependence (18,26), and slower recovery of re-nal function in those with AKI requiring RRT (19). Of note, although no randomized studies have been implemented to test if earlier initiation of RRT for volume control is beneficial (because volume removal by RRT may be offset by decreases in urine output), there is biologic plausibility to suggest that preservation of urine output may be a rea-sonable clinical management goal. In our study, we found that the intensity of RRT associated with modest but sig-nificant differences in the rate of change in urine output, with greater increases in the daily rate of change in urine output reported in the less intensive arm. Although the less intensive arm had a slightly more negative average
netfluid balance during thefirst 7 study days, in explor-atory models, additional adjustment for time–varying net fluid balance actually resulted in modest attenuation of the effect estimates. This suggests thatfluid status may partly mediate the association of RRT intensity with changes in urine volume but is not the major explanatory variable.
An important factor that may contribute to differences in urine output according to RRT intensity could be the presence of more hemodynamic instability associated with greater intensity or frequency of dialytic therapy. Indeed, the ATN Study reported that IDH events requiring vaso-pressor support or other interventions were more frequent in the intensive RRT arm (8), largely as a result of the greater absolute number of intermittent HD treatments in this arm. In exploratory models, we noted that addi-tional adjustment for time–varying CV SOFA scores (a measure of hemodynamic stability) resulted in a modest attenuation of the effect estimates for daily rate of change in urine output. These observations raise the possibility that IDH could confound or lie on the causal pathway for the association of lower urine output with more inten-sive dialytic therapy. Analogous evidence exists in a post hocanalysis of patients on chronic HD from the Hemodi-alysis Study, in whom we previously reported that higher versus lower target Kt/V was associated with a greater risk of IDH (27), which, has been associated with greater decline in residual urine output by others (28).
the ATN Study (8) may have partially contributed to a lower obligate urine volume (31,32). In our exploratory analyses, we noted that adjustment for time-updated measurements of BUN resulted in attenuation of the effect estimate for the difference in daily rate of change in urine output, supporting the notion that adjustment for BUN as a marker of solute load resulted in a smaller difference in changes in urine out-put between the less intensive and more intensive arms. Again, analogous evidence exists in patients on chronic HD, in whom more frequent HD (resulting in lower time– averaged urea concentrations) has been reported to be asso-ciated with a more rapid decline in urine output (33,34).
To assess if the association of RRT intensity with changes in urine volume persists over time, the data were analyzed in those who survived through day 28. In this case, there were no notable differences, suggesting that RRT intensity may have a greater influence on changes in urine output earlier in the course of AKI in critically ill patients. Supportive evidence for this assertion is provided by the fact that the favorable associations with less intensive therapy were more pronounced in those who were non-oliguric at baseline (which we defined as baseline 24-hour urine$110 ml/d) compared with those who were oliguric. However, we found no association of more intensive ther-apy with risk of persistent RRT requirement at day 28 or 60. Indeed, prior studies of strategies to augment urine output with diuretics in patients with AKI have not been shown to improve mortality or reduce the need for RRT (35,36). However, we are cognizant of the fact that the primary study was not powered for these post hoc sub-group analyses, which should be interpreted as hypothesis generating. Similarly, the analyses in the survivors through day 28 and later may be subject to selection and survivor biases.
The ATN Study afforded a unique opportunity to test the effect of RRT intensity on changes in urine output, a biologically plausible adverse effect of intensive RRT. The major strength of our report is that the primary analyses were performed according to the randomized treatment assignments from the ATN Study, which limits confound-ing by disease severity. Adjustment for potential con-founding variables did not result in qualitative changes to the patterns of association that we observed, which might be expected from the balance in baseline covariates in participants included in this analysis. Furthermore, our results were consistent across the primary analysis (change in urine output in survivors through day 7) and in the secondary analysis (time to decline in urine output of$50%). Limitations of this analysis include thepost hoc
nature of the study, because the trial was not designed to examine urine output as the outcome of interest, and limitations in generalizability from a randomized, controlled trial. Because of data limitations, we were not able to adjust for dialysate sodium, temperature, or changes in serum osmolality in relation to the timing of dialytic therapies or dosage or duration of diuretic therapy.
In conclusion, we report that the use of more intensive RRT is associated with a decline in the daily rate of change in urine output during the first week of therapy among critically ill patients requiring RRT initiation, consistent with a potentially early adverse effect of more intensive
RRT on residual renal function. Additional studies should identify the mechanistic basis for ourfindings. Identifying the optimal RRT strategy in AKI has the potential to improve the outcomes of hundreds of thousands of patients annually and should be a major focus of investigative efforts in critical care nephrology.
Acknowledgments
Because Dr. Palevsky is a Deputy Editor of CJASN, he was not involved in the peer-review process for this manuscript. Another editor oversaw the peer-review and decision-making process for this manuscript.
We thank the Acute Renal Failure Network (ATN) Study inves-tigators and the National Institute of Diabetes and Digestive and Kidney Diseases (NIDDK) data repository for the data used in this study.
F.R.M. was supported by an American Heart Association award from 2014 to 2015 and is currently supported by NIDDK grant DK102511. S.S.W. is supported by NIDDK grants DK093574, DK075941, U01DK085660, and R01DK103784. The ATN Study was performed by the ATN Study investigators and supported by the Cooperative Studies Program of the Department of Veterans Affairs (VA) Office of Research and Development and the NIDDK.
Portions of this work were presented in abstract form at the American Society of Nephrology Annual Meeting in Philadelphia, Pennsylvania in November 2014.
This paper does not necessarily reflect the opinions or views of the ATN Study investigators, the VA, or the NIDDK.
Disclosures None.
References
1. Uchino S, Kellum JA, Bellomo R, Doig GS, Morimatsu H, Morgera S, Schetz M, Tan I, Bouman C, Macedo E, Gibney N, Tolwani A, Ronco C; Beginning and Ending Supportive Therapy for the Kidney (BEST Kidney) Investigators: Acute renal failure in critically ill patients: A multinational, multicenter study.JAMA
294: 813–818, 2005
2. Bagshaw SM, Laupland KB, Doig CJ, Mortis G, Fick GH, Mucenski M, Godinez-Luna T, Svenson LW, Rosenal T: Prognosis for long-term survival and renal recovery in critically ill patients with severe acute renal failure: A population-based study.Crit Care9: R700–R709, 2005
3. Turney JH, Marshall DH, Brownjohn AM, Ellis CM, Parsons FM: The evolution of acute renal failure, 1956-1988.Q J Med74: 83– 104, 1990
4. Ronco C, Bellomo R, Homel P, Brendolan A, Dan M, Piccinni P, La Greca G: Effects of different doses in continuous veno-venous haemofiltration on outcomes of acute renal failure: A prospective randomised trial.Lancet356: 26–30, 2000
5. Saudan P, Niederberger M, De Seigneux S, Romand J, Pugin J, Perneger T, Martin PY: Adding a dialysis dose to continuous hemofiltration increases survival in patients with acute renal failure.Kidney Int70: 1312–1317, 2006
6. Schiffl H, Lang SM, Fischer R: Daily hemodialysis and the out-come of acute renal failure.N Engl J Med346: 305–310, 2002 7. Tolwani AJ, Campbell RC, Stofan BS, Lai KR, Oster RA, Wille KM:
Standard versus high-dose CVVHDF for ICU-related acute renal failure.J Am Soc Nephrol19: 1233–1238, 2008
8. Palevsky PM, Zhang JH, O’Connor TZ, Chertow GM, Crowley ST, Choudhury D, Finkel K, Kellum JA, Paganini E, Schein RM, Smith MW, Swanson KM, Thompson BT, Vijayan A, Watnick S, Star RA, Peduzzi P; VA/NIH Acute Renal Failure Trial Network: Intensity of renal support in critically ill patients with acute kidney injury.
N Engl J Med359: 7–20, 2008
RENAL Replacement Therapy Study Investigators: Intensity of continuous renal-replacement therapy in critically ill patients.N
Engl J Med361: 1627–1638, 2009
10. Sharma S, Waikar SS: Phosphate balance in continuous venovenous hemofiltration.Am J Kidney Dis61: 1043–1045, 2013
11. Roberts DM, Liu X, Roberts JA, Nair P, Cole L, Roberts MS, Lipman J, Bellomo R; RENAL Replacement Therapy Study Investigators: A multicenter study on the effect of continuous hemodiafiltration intensity on antibiotic pharmacokinetics.Crit Care19: 84, 2015
12. Mueller BA, Pasko DA, Sowinski KM: Higher renal replacement therapy dose delivery influences on drug therapy.Artif Organs
27: 808–814, 2003
13. Anderson RJ, Linas SL, Berns AS, Henrich WL, Miller TR, Gabow PA, Schrier RW: Nonoliguric acute renal failure.N Engl J Med
296: 1134–1138, 1977
14. Wald R, Deshpande R, Bell CM, Bargman JM: Survival to dis-charge among patients treated with continuous renal re-placement therapy.Hemodial Int10: 82–87, 2006
15. Avila MO, Zanetta DM, Abdulkader RC, Yu L, Burdmann EA: Urine volume in acute kidney injury: How much is enough?Ren Fail31: 884–890, 2009
16. Oh HJ, Shin DH, Lee MJ, Ko KI, Kim CH, Koo HM, Doh FM, Kwon YE, Kim YL, Nam KH, Park KS, An SY, Park JT, Han SH, Yoo TH, Kang SW: Urine output is associated with prognosis in patients with acute kidney injury requiring continuous renal replacement therapy.J Crit Care28: 379–388, 2013
17. Pistolesi V, Di Napoli A, Fiaccadori E, Zeppilli L, Polistena F, Sacco MI, Regolisti G, Tritapepe L, Pierucci A, Morabito S: Severe acute kidney injury following cardiac surgery: Short-term out-comes in patients undergoing continuous renal replacement therapy (CRRT).J Nephrol29: 229–239, 2016
18. Wiedemann HP, Wheeler AP, Bernard GR, Thompson BT, Hayden D, deBoisblanc B, Connors AF Jr., Hite RD, Harabin AL; National Heart, Lung, and Blood Institute Acute Respiratory Distress Syndrome (ARDS) Clinical Trials Network: Comparison of two fluid-management strategies in acute lung injury.N Engl J Med354: 2564–2575, 2006
19. Heung M, Wolfgram DF, Kommareddi M, Hu Y, Song PX, Ojo AO: Fluid overload at initiation of renal replacement therapy is associated with lack of renal recovery in patients with acute kidney injury.Nephrol Dial Transplant27: 956– 961, 2012
20. Palevsky PM, O’Connor T, Zhang JH, Star RA, Smith MW: Design of the VA/NIH Acute Renal Failure Trial Network (ATN) Study: Intensive versus conventional renal support in acute renal failure.
Clin Trials2: 423–435, 2005
21. Bellomo R, Ronco C, Kellum JA, Mehta RL, Palevsky P; Acute Dialysis Quality Initiative workgroup: Acute renal failure -definition, outcome measures, animal models, fluid therapy and information technology needs: The Second International Consensus Conference of the Acute Dialysis Quality Initiative (ADQI) Group.Crit Care8: R204–R212, 2004
22. Mehta RL, Kellum JA, Shah SV, Molitoris BA, Ronco C, Warnock DG, Levin A; Acute Kidney Injury Network: Acute Kidney Injury
Network: Report of an initiative to improve outcomes in acute kidney injury.Crit Care11: R31, 2007
23. KDIGO: KDIGO clinical practice guideline for acute kidney injury.Kidney Int Suppl2[Suppl 1]: 2012
24. Payen D, de Pont AC, Sakr Y, Spies C, Reinhart K, Vincent JL; Sepsis Occurrence in Acutely Ill Patients (SOAP) Investigators: A positive fluid balance is associated with a worse outcome in patients with acute renal failure.Crit Care12: R74, 2008 25. Bouchard J, Soroko SB, Chertow GM, Himmelfarb J, Ikizler TA,
Paganini EP, Mehta RL; Program to Improve Care in Acute Renal Disease (PICARD) Study Group: Fluid accumulation, survival and recovery of kidney function in critically ill patients with acute kidney injury.Kidney Int76: 422–427, 2009
26. Rosenberg AL, Dechert RE, Park PK, Bartlett RH; NIH NHLBI ARDS Network: Review of a large clinical series: Association of cumulative fluid balance on outcome in acute lung injury: A retrospective review of the ARDSnet tidal volume study cohort.J
Intensive Care Med24: 35–46, 2009
27. Mc Causland FR, Brunelli SM, Waikar SS: Dialysis dose and intradialytic hypotension: Results from the HEMO study.Am J
Nephrol38: 388–396, 2013
28. Jansen MA, Hart AA, Korevaar JC, Dekker FW, Boeschoten EW, Krediet RT; NECOSAD Study Group: Predictors of the rate of decline of residual renal function in incident dialysis patients.
Kidney Int62: 1046–1053, 2002
29. Cerda J: Oliguria: An earlier and accurate biomarker of acute kidney injury?Kidney Int80: 699–701, 2011
30. Schrier RW, Berl T: Nonosmolar factors affecting renal water excretion.N Engl J Med292: 81–88
31. Feinfeld DA, Danovitch GM: Factors affecting urine volume in chronic renal failure.Am J Kidney Dis10: 231–235, 1987 32. Yeh BP, Tomko DJ, Stacy WK, Bear ES, Haden HT, Falls WF Jr.:
Factors influencing sodium and water excretion in uremic man.
Kidney Int7: 103–110, 1975
33. Lin YF, Huang JW, Wu MS, Chu TS, Lin SL, Chen YM, Tsai TJ, Wu KD: Comparison of residual renal function in patients undergoing twice-weekly versus three-times-weekly haemodialysis.Nephrology (Carlton)14: 59–64, 2009 34. Daugirdas JT, Greene T, Rocco MV, Kaysen GA, Depner TA, Levin
NW, Chertow GM, Ornt DB, Raimann JG, Larive B, Kliger AS; FHN Trial Group: Effect of frequent hemodialysis on residual kidney function.Kidney Int83: 949–958, 2013
35. Ho KM, Sheridan DJ: Meta-analysis of frusemide to prevent or treat acute renal failure.BMJ333: 420, 2006
36. Mehta RL, Pascual MT, Soroko S, Chertow GM; PICARD Study Group: Diuretics, mortality, and nonrecovery of renal function in acute renal failure.JAMA288: 2547–2553, 2002
Received:October 15, 2015Accepted:April 4, 2016
Published online ahead of print. Publication date available at www. cjasn.org.