THE ROLE OF NONCOGNITIVE SKILLS IN THE TRANSITION TO THE WORKFORCE FOR YOUTH IN ANDHRA PRADESH, INDIA
Renee Ryberg
A thesis submitted to the faculty at the University of North Carolina at Chapel Hill in partial fulfillment of the requirements for the degree of Master of Arts in the Department of Sociology.
Chapel Hill 2016
Approved by: Kenneth A. Bollen
© 2016 Renee Ryberg
ABSTRACT
Renee Ryberg: The Role of Noncognitive Skills in the Transition to the Workforce for Youth in Andhra Pradesh, India
(Under the direction of Michael J. Shanahan)
Research based on youth in the United States and Europe has established the importance of noncognitive skills for successful transitions to adulthood. The influence of noncognitive skills may vary by social and economic contexts, though, and nine in ten youth live in
developing countries where these concepts have not been rigorously examined. I examine the role noncognitive skills play in the transition to the workforce among youth in Andhra Pradesh, India. Using data from the Young Lives study, this paper examines whether positive self-concept and social skills in early adolescence (age 11-12) predict whether youth (age 18-19) are in
TABLE OF CONTENTS
LIST OF TABLES ... vi
LIST OF FIGURES ... vii
LIST OF ABBREVIATIONS ... viii
INTRODUCTION ... 1
LITERATURE REVIEW ... 4
Evidence from high-income countries ... 4
Evidence from low- and middle-income countries ... 6
THE INDIAN CONTEXT ... 11
Gender ... 13
Caste ... 14
METHODOLOGY ... 16
Young Lives ... 16
Measures ... 18
Missing data ... 21
ANALYTIC STRATEGY ... 22
Modeling ... 22
RESULTS ... 24
Multivariate results ... 28
DISCUSSION ... 41
Limitations ... 42
CONCLUSION ... 45
LIST OF TABLES
LIST OF FIGURES
Figure 1. Transition to adulthood status by gender at ages 18-19……….26
Figure 2. Predicted transition to adulthood status by self-concept ………...…………28
Figure 3. Predicted probability by self-concept and gender ………...………..……34
LIST OF ABBREVIATIONS
NEET Not in education, employment, or training OBC Other backward castes
INTRODUCTION
Research across disciplines ranging from educational psychology to economics has established the importance of noncognitive skills1 for successful transitions to adulthood. Skills such as grit, problem-solving, social skills, and self-control are associated with educational attainment and positive outcomes in the workforce. Noncognitive skills may even rival the predictive power of cognitive skills with respect to workforce outcomes (Kautz, T. D. et al. 2014).
However, the extant research on noncognitive skills and status attainment has been conducted almost exclusively in developed countries (Lippman, Laura H. et al. 2015). Such a focus is troubling because the vast majority of youth around the world live in developing countries, where the transition to adulthood may bear little resemblance to patterns observed in the developed world. In the developed world, adolescence, it has been argued, is extending into
1 Researchers across many disciplines study noncognitive skills, but each discipline uses a different lexicon to refer to these competencies. Economists tend to discuss “noncognitive skills,” a term which was made popular by James Heckman and colleagues (2000). More recently, economists have backed away from this term, as many of the skills do indeed involve cognition (Heckman and Kautz 2014). Within psychology, different sub-disciplines use different language. Developmental psychologists talk about social and emotional learning; personality psychologists generally use the Big Five personality traits to describe these constructs; and positive psychologists tend to discuss “character virtues." In the applied workforce and educational settings, still more terms are used to refer to these skills, including: behavior skills, core skills, employability skills, generic skills, skills, and, perhaps most commonly, soft skills (Duckworth, Angela 2015; Lippman, Laura H. et al. 2015).
emerging adulthood as youth stay in school longer and postpone entry into work and the establishment of an independent household. In contrast, youth in the developing world may resemble Western adolescents before the expansion of education systems, an “adolescence” marked by fewer years of schooling, and quick entry into work and family roles. Consequently, studies based on developed countries may provide little insight into the role noncognitive skills play for the majority of the world’s youth. Whether the existing research is applicable to the diverse set of developing countries in the world, where approximately 89 percent of the world’s youth live (Gupta, Monica Das et al. 2014), remains to be seen.
This paper examines the role that noncognitive skills play in the transition to the
workforce for youth in Andhra Pradesh, India, which serves both as an example of a developing region and as a case study with its own socio-historical context. On the one hand, India is a typical developing country in that it has a “population pyramid” with a large base of young people, an educational system that does not adequately serve young people through the teenage years, and familial pressures on young people to contribute income to the household economy (Shanahan, Michael J., Mortimer, Jeylan T., and Kruger, Helga 2002). On the other hand, India is an interesting case study as it has unique gender and caste dynamics that may constrain youth’s opportunities as they transition to the workforce.
staying in school to ages 18-19, as opposed to entering the workforce, while others (i.e., social skills) may predict departure from school. The influence of noncognitive skills is especially important for young women, and youth from higher castes. Among employed youth,
LITERATURE REVIEW
Evidence from high-income countries
Early research on the relationship between noncognitive skills and workforce outcomes took place in the fields of psychology and sociology. Psychologists have been interested in the role that personality plays throughout one’s career. The Big Five Factor Model — comprising agreeableness, conscientiousness, emotional stability/neuroticism, extraversion, and openness to experience — is a commonly-used approach. Many analyses have examined the relationship between these personality traits and employment outcomes, and meta-analyses of research across North America and Europe have shown that certain personality characteristics are associated with outcomes including job proficiency, training proficiency, absenteeism, and wages. Of the five traits, conscientiousness has the strongest relationship with employment outcomes (e.g., job proficiency, productivity, salary, tenure) across occupations including professionals, police, managers, sales, skilled labor, and semi-skilled labor. Emotional stability also has a consistently strong relationship with job performance across occupations in Europe, but not in North
America. This difference has been attributed to methodological differences, but that has been refuted, and there may be unknown substantive difference in the two work settings (Barrick and Mount 1991; Salgado 1997).
in the United States, Poland, and the Ukraine. Men with high levels of noncognitive skills, such as self-direction and ideational flexibility, entered occupations that value these skills, and these values were, in turn, reinforced by experiences in their occupations. This pattern created a cycle reinforcing the value of noncognitive skills that continues across the generations, as men’s parenting styles inculcate their skills into their children.
A flurry of research on noncognitive skills commenced in the early 2000s as economists began to study these associations from the vantage point of economic theories and methods. In a now seminal piece, Bowles, Gintis, and Osborne-Groves (2001) acknowledged that the “usual suspects” of parental background, educational attainment, and cognitive ability did not explain a large proportion of the variance in earnings. The authors attribute the unexplained variance to noncognitive behaviors, including “incentive-enhancing preferences,” which increase motivation to be productive at work, and “earnings-relevant behavioral traits” such as self-esteem.
Economists have attempted to improve estimates of the relationship between
noncognitive skills and education and workforce outcomes. Heckman et al. (2006) found that noncognitive skills rival the importance of cognitive ability when predicting economic and social outcomes of youth, including educational attainment, employment status, wages, and
occupational level (white or blue collar). This study inspired a proliferation of literature
documenting the importance of noncognitive skills for employment outcomes. A recent review of the burgeoning interdisciplinary literature identified a set of notably salient skills for youth entering the workforce: higher-order thinking skills (including problem-solving, critical thinking, and decision-making), social skills, communication skills, self-control, and positive self-concept (Lippman, Laura H. et al. 2015).2
Evidence from low- and middle-income countries
Despite the proliferation of studies examining noncognitive skills in the United States and Europe, there is limited empirical evidence on the role that noncognitive skills play for youth outside of these contexts. Researchers have only recently started to investigate the role of noncognitive skills in low- and middle-income countries. In fact, a review of the literature could not find any peer-reviewed articles examining the link between noncognitive skills and
employment outcomes in developing countries. A few working papers and nonacademic reports have, however, focused on the role of noncognitive skills and success in the workforce.
These empirical studies are focused on Asia and South America. Individual studies have been conducted in China, Tajikistan, Uzbekistan, Peru, and Chile. The World Bank also has an ongoing large-scale study that is being conducted in over a dozen countries. No extant studies have examined noncognitive skills and the workforce in India. The studies examine a wide variety of noncognitive skills, ranging from the Big Five Factor Model and grit to educational aspirations and self-esteem. They are more limited in the outcomes they examine, however, and focus exclusively on wages and employment status.
There is a good deal of agreement among studies conducted in the developed world and those from low- and income countries. All of the studies reviewed from low- and middle-income countries found relationships between noncognitive skills and an employment outcome. In rural China, internalizing behaviors, high educational aspirations, and resilience
related to being employed among adults in Tajikistan(Nikoloski, Zlatko and Ajwad, Mohamed Ihsan 2014).
Studies examining wages find a positive association between wages and grit across a number of settings (Diaz, Juan Jose, Arias, Omar, and Tudela, David Vera 2012; Lavado, Velarde, and Yamada 2013; World Bank 2014), and wages and self-efficacy in Chile (Bassi, Marina and Galiani, Sebastian 2009). The most frequently examined noncognitive correlates of wages were the Big Five personality traits. In the large-scale study examining more than a dozen countries, conscientiousness was the most consistent correlate of high wages (World Bank 2014). Two studies in Peru found that emotional stability is positively associated with higher wages, while agreeableness is negatively related (Diaz, Juan Jose et al. 2012; Lavado et al. 2013). These findings are consistent with results in the developed country literature (i.e., Barrick and Mount 1991; Nyhus and Pons 2005; Salgado 1997).
In contrast, other findings from these same studies deviate from and even contradict those in the developed world. In rural China, youth with higher levels of self-esteem were more likely to work than be in school (Glewwe et al. 2013). Based on the developed country literature, one would expect self-esteem to be protective against working and help youth stay in school. Additionally, having a fixed mindset (believing that intelligence is fixed rather than malleable) was related to being employed in Uzbekistan (Nikoloski, Zlatko and Ajwad, Mohamed Ihsan 2014). In the American literature, a growth mindset, which is the opposite of a fixed mindset, is frequently related to positive outcomes (Dweck, Carol 2008). With regards to wages, no
noncognitive skills predicted wages in rural China (Glewwe et al. 2013). Additionally, in Peru, a general latent noncognitive construct was related to lower wages. The authors argue that
them (Lavado et al. 2013). Perhaps noncognitive skills are not valued because employees with them tend to recognize problems within the workplace and take initiative to try to fix them, whereas employers prefer to have submissive employees.
The largest contrast with the developed country literature is in regards to
conscientiousness. Conscientiousness is the Big Five personality construct most consistently linked to workforce outcomes in the developed world (Barrick and Mount 1991; Salgado 1997); however, two of the studies referenced above found no relationship between conscientiousness and wages. Rather, these studies found that emotional stability was related to higher wages (Diaz, Juan Jose et al. 2012; Lavado et al. 2013). Emotional stability has previously been found to relate to positive employment outcomes in Europe, but not in North America (Barrick and Mount 1991; Salgado 1997).
To summarize, there is some evidence that noncognitive skills play the same role in developing countries as they do in developed countries. Intuitively, it makes sense that noncognitive skills may be universally important. No matter the setting, humans need interpersonal skills to be able to communicate and get along with one another in order to be successful at work, whether they are selling soap in an outdoor market, harvesting sugar cane in a field, or providing technical support over the Internet. Intrapersonal skills such as
self-confidence and self-efficacy make tasks seem manageable. In short, the work world requires noncognitive skills. Nevertheless, the extant evidence in the developing world is not as clear-cut as it is in North America and Europe. Some studies fail to find the most robust relationships in the developed world, and other findings even run contrary to those found in high-income countries.
There are also theoretical reasons to believe that noncognitive skills may not be
predictive of the transition to the workforce for youth in Andhra Pradesh. Previous research has shown that macro economic and cultural forces can constrain or enhance the predictive power of noncognitive skills. For example, a study found that economic conditions limit the role that planful competence plays in predicting educational attainment. Planful competence predicted educational attainment for individuals who came of age after the Great Depression in the United States, but not for those who came of age during the Great Depression. During the Great
Depression, adolescents’ individual choices were constrained by their social contexts:
The macro economic and cultural settings in developing countries are clearly different from those in developed countries, in ways that may limit the influence of noncognitive skills. Even the universality of adolescence as a developmental stage has been questioned. Some children, especially those from lower social classes, are thrown straight into adulthood, skipping altogether the period of adolescence typical in the developed world (Saraswathi, T. S. 1999). In India, for example, young girls may be promised to arranged marriages before they reach puberty, and young men may be pushed out of school and into work to help support their families before puberty (Saraswathi, T. S. 1999). It seems clear that the transition to adulthood looks very different in and across developing countries, and youths’ opportunities may be constrained, limiting the influence of their noncognitive skills.
Due to the strength of the evidence that indicates the importance of cognitive and
THE INDIAN CONTEXT
Because India is so different from the contexts in which noncognitive skills have
traditionally been studied, both economically and culturally, it is important to ground the present study in the context of India, and Andhra Pradesh in particular. India is classified as a lower-middle income country by the World Bank (World Bank 2015c), with an average gross national income per capita of just over $5,372 (World Bank 2016a). About one in four (24%) people live in extreme poverty in India, on under $1.25 per day (World Bank 2015a:25).
In the process of modernization, India has adopted western neo-liberal ideas, and its government is working to increase educational opportunities for its youth (Morrow 2013b). Education is rapidly expanding, and with the passage of the Right to Free and Compulsory Education Act in 2009, education became compulsory to age 14 (Morrow 2013b). Primary education has reached close to universal coverage, with 93 percent of children enrolled in primary school (World Bank 2015b). In grade 10, at approximately age 15, students take entrance exams for secondary school. For youth in rural areas of Andhra Pradesh, attending secondary school may require migrating and living away from family in a dorm (Morrow 2013b). The Indian government is considering making access to secondary education universal through age 18 (Morrow 2013b). Beyond secondary school, India has moderate rates of tertiary education, with about one in four men and one in five women enrolling in college (World Bank 2016b, 2016c).
currently stands, youth labor force participation is relatively low in India, compared to other countries with similar income levels, where just over half of young men ages 15-24 (51%) and less than one in five young women (18%) are in the labor force (World Bank 2016d, 2016e). A large majority (approximately 84 %) of the labor force work in the informal sector and/or informal employment (International Labour Organization, Department of Statistics 2012). Unemployment rates for both young men and young women ages 15-24 are moderate, at around 11 percent (World Bank 2016f, 2016g). The largest sectors of the economy in Andhra Pradesh are agriculture, manufacturing, and services (Rao, R. V. Chandrasekhara 2015).
Youth in India and their parents are feeling the tension between traditional obligations to their families on one hand and a fortified emphasis on education based on western ideals on the other. Education is highly valued, but requires sacrifice on the part of families, and its payoffs in the local economy are unknown. As a result, a sizeable minority of children go to school and work at the same time. As Virginia Morrow explains based on research on adolescents in Andhra Pradesh: “the two fields of activity [meaning school and work] are not easily separated.
As there is uncertainty in the context of Andhra Pradesh as to whether work or education is a more valued outcome, I make no judgment about the value of either work or school, and use value-neutral language and methods throughout this paper.
Gender
In India, a youth’s opportunities in their transition to adulthood are largely shaped by their gender and family background (Saraswathi, T. S. 1999; Verma, Suman 2000). Gender differences have been documented across India, and in Andhra Pradesh in particular. Differences along gender lines have appeared in parents’ educational expectations for their children,
enrollment rates, and spending on girls’ education. In the past, parents expressed lower educational aspirations for their daughters and daughters were less likely to be enrolled in school. More recently, daughters and sons were equally likely to be enrolled in school, but more money was spent on boys’ education than that of girls (Morrow 2013b).
The gender differences in employment are also striking for young Indians. While they complete education at levels comparable to young men, young women are much less likely than men to be in the labor market. More than twice as many young men as young women work. This difference may be partially attributable to cultural norms, including early-arranged marriages that limit opportunities for women to enter the workforce.
to obtaining a suitable partner, rather than as a means to a career (Morrow 2013b; Saraswathi, T. S. 1999). Due to the cultural constraints placed on women’s roles, I predict that noncognitive skills predict whether young men are employed, in education, or NEET, but that such a relationship does not exist for young women (Hypothesis 2).
Caste
In addition to gender, Indian society is stratified by caste. The caste system can be defined as a system that divides Hindu society into hereditary groups that are distinguished from one another, and linked to one another, by three characteristics: division of labor, hierarchy, and separation (Bougle 1958, as cited in Dumont, Louis 1970; Ghurye, G. S. 1932). Castes
correspond to hereditary professions in which one is traditionally required to work. These occupations are ranked according to a hierarchy in which some occupations and castes are considered higher than others. Traditionally, there was strict separation between castes, and members of different castes could not marry or have contact with (i.e., eat or drink with)
members of other castes. The system has become less rigid over time, though, so that one is not necessarily obligated to work in the profession to which he or she are assigned at birth, or to always marry within the same caste.
are the lowest of the caste structure, and traditionally were not even considered part of it.3 STs are also low castes, made up of nationally recognized indigenous people. They frequently live in areas isolated from mainstream society, such as mountains and forests (Morrow 2013a). The OBCs are another group of low castes, and the people making up this category are considered to be “backwards” in that they are not proportionally represented in education or professions
(Government of India Ministry of Law and Justice 2015; Government of India Ministry of Social Justice and Empowerment 2009). These three groups of lower castes are protected by the Indian Constitution in an attempt to make amends for historical discrimination. All other castes, which are predominantly upper castes, fall into the OC category (Galub, S., Reddy, P. Prudhvikar, and Himaz, Rozana 2008:2). In 2006, twenty percent of the population belonged to SCs, nine percent belonged to STs, 41 percent belonged to BCs, and 31 percent belonged to OCs (Anon 2007).
Despite the loosening of social norms associated with the caste system, and the affirmative action programs and quotas aimed at combatting India’s discriminatory history, castes continues to impact the lives of young people in India. Youth from lower castes continue to have fewer opportunities than youth from higher castes. In fact, one study found that
educational gaps along caste lines are larger than those along gender lines(Pells 2011, as cited in Morrow 2013b). Those in lower castes, for example, are more likely to continue in the
occupations that they were assigned at birth (Seiter, Liann Nicole 2009). Boys in lower castes, in particular, are more likely to be tracked into schools taught in local languages, rather than
English, that limit their occupational possibilities outside of traditional occupations. Low-caste
girls, in contrast, are more likely to attend English-speaking schools that expand their
occupational options (Munshi, Kaivan and Rosenzweig, Mark 2006). The third hypothesis, then, is that noncognitive skills will not be as important in determining whether youth are employed, in education, or NEET for youth of lower castes than youth from upper castes, as they do not have the same opportunities (Hypothesis 3).4
METHODOLOGY
Young Lives
Young Lives is an ongoing longitudinal study of two cohorts of children across four diverse developing countries: Ethiopia, India, Peru, and Vietnam, designed to study the causes and consequences of poverty. The study is conducted by the University of Oxford, with local partnerships within each country.5
The present study uses data from the face-to-face surveys of the older cohort of children, who were born in 1994-1995, from Andhra Pradesh, India.6 They have been interviewed four times, as of 2016, at ages 7-8, 11-12, 14-15, and 18-19.
Young Lives uses a multi-stage sampling design. In Andhra Pradesh, 20 sentinel sites were selected to capture a diverse set of both urban and rural communities. Sites were
purposefully selected to represent certain indicators including climate poverty, with an overrepresentation of poor communities. Within each site, households with children of appropriate ages were identified and then children were randomly selected to be part of the sample (Young Lives 2011). Due to the non-random selection of sentinel sites, the data from Young Lives are not nationally representative.7
5 Young Lives has been sponsored by a number of European aid agencies including the UK Department for International Development (DFID), Irish Aid, and the Netherlands Ministry of Foreign Affairs. For additional sponsors, see http://www.younglives.org.uk/who-we-are/funders. For a list of local partners, see
http://www.younglives.org.uk/who-we-are/young-lives-partners
6 In 2014, Andhra Pradesh was split into two states: Andhra Pradesh and Telangana. The same sample of youth continues to be followed in these two states.
Young Lives provides an unparalleled opportunity to investigate the role of noncognitive skills for the transition to adulthood in developing countries. This survey is particularly suitable to this study as it has multiple indicators of noncognitive skills, and its longitudinal format allows noncognitive skills to be measured prior to an adolescent’s transition to the workforce.
Measures
Independent variables. Noncognitive skills are measured when respondents are 11 or 12 years old (Round 2). The noncognitive items asked in Young Lives are unique, and do not appear to be based on any conventional scales. Previous studies using Young Lives have broken a subset of these items into the constructs of self-efficacy and self-esteem. However, these measures had poor measurement properties, and reported alphas of 0.67 and 0.59, respectively (Dercon, Stefan and Krishnan, Pramila 2009).8 With the goal of assessing two of the most salient skills for workforce success (Lippman, Laura H. et al. 2015), I attempted to composite measures of positive self-concept and social skills.
First, I chose the items that most theoretically tapped into positive self-concept, and examined the relationships between the items and an underlying construct using confirmatory factor analysis in Mplus.9 The resulting measure contains items that tap both self-efficacy and self-esteem, but analyses indicate that there is one underlying construct, which aligns with the operationalization of self-concept set forth by Lippman et al.. The measure is composed of the following items: “If I try hard, I can improve my situation in life”; “I like to make plans for my future studies and work”; “If I study hard at school I will be rewarded by a better job in the
future”; “I feel proud to show my friends or other visitors where I live”; “I am ashamed of my clothes”; and “I am proud of my achievements at school.” Response options are on a four-point Likert scale ranging from “Strongly Agree” to “Strongly Disagree.” Positively-worded items were recoded so that a higher values indicates more positive self-concept on all items. A scale was constructed by standardizing each item, and then taking the mean of available items. Many of these items were only asked of youth who were in school at age 11-12 (Round 2), and, in order to use these items, the sample was limited to youth who were enrolled in school at age 11-12 in 2006 (n=883).
I also attempted to create a composite measure of social skills. A confirmatory factor analysis revealed that the most theoretically relevant items were not related to an underlying construct. Therefore, social skills is operationalized with two individual items: “Do you find it hard to talk to other children in your class?” and “Do you help other children who have a
problem at school?” Response options are never, sometimes, and always. Items were recoded so that a higher value indicates more social skills. Because the items in Young Lives are unique, the resulting positive self-concept and social skills measures are also unique and not directly
comparable to anything in the extant literature. The correlations between the three noncognitive skills are low, ranging from -0.08 to 0.06.
Cognitive skills are also measured at age 11-12 (Round 2), using the Peabody Picture Vocabulary Test (PPVT-III) to assess verbal ability and a 10-item mathematics achievement test to assess math ability (Cueto, Santiago et al. 2009). Rasch scores are used for the present study.
Caste (OC). For the purpose of these analyses, caste has been broken down into a dichotomous indicator of lower caste, made up of ST, SC, and BC, and upper caste (OC). The three lower castes are all protected by the government as they have experienced harsh discrimination in the past.
Control variables. The demographic background variables are all measured at the first round of data collection, before the transition to adulthood began. They are lagged in order to address any potential reciprocal relationship between them and the outcome. The control
variables include the child’s household wealth index,10 urbanicity, household size, and a dummy variable indicating whether the caregiver has completed primary education.
Dependent variables. The dependent variable, “transition to adulthood status,” is
measured when youth are 18-19 years old (Round 4 in 2013). At this age, youth are on the cusp of adulthood in India. More than one-half of youth in the study have completed their education. Thirty-seven percent of women are married, and, of these, more than one-half have become mothers (Singh, Abhijeet and Revollo, Patricia Espinoza 2016).11
The main dependent variable in this study is “transition to adulthood status,” a nominal variable indicating whether an individual is a student, a worker, working while in school, or NEET. This variable is constructed based on four items from Round 4. A youth is considered a student if he/she is currently in full-time education and has not worked on a family farm, worked for someone outside of the household, or worked for their own or a family business in the past week. A youth is considered a worker if he/she reports working for at least one hour in the past week on either on a family farm, for someone outside of the household, or for their own or a
family business. If a youth reports being in school and working in the past week, they are classified as a student worker. If an individual does not participate in school or work, as defined above, he/she is coded as NEET.
Missing data
Young Lives has relatively low levels of missing data. The attrition rates for Young Lives are much lower than for other longitudinal studies in similar country contexts (Outes-Leon, Ingo and Dercon, Stefan 2008; Young Lives 2014, 2015). Nevertheless, as with any longitudinal studies, there is some missing data. In India, 1,008 children were interviewed at age 7-8 (Round 1), and 952 (94.4%) were interviewed in Round 4 at age 18-19 (Young Lives 2014). The highest levels of missing data are found in Round 2, on some of the noncognitive and cognitive
measures. Cognitive test scores are missing for between six and eight percent of original Round 1 respondents. The individual noncognitive items were missing for less than two percent to almost 13 percent of cases, depending on the item. Among those who were enrolled in school at age 11-12, there is much less missing data. The highest levels of missing data for this analytic sample are on the cognitive measures, with four percent of cases missing math scores and six percent of cases missing vocabulary scores.
ANALYTIC STRATEGY
Modeling
Hypotheses 1 through 3 are examined using a series of multinomial logistic regression models with cluster-robust standard errors. The cluster-robust standard errors correct for the multi-level data structure (individuals nested within communities). Models are estimated for the full sample and also for males and females, separately.
The first set of models tests whether noncognitive skills in early adolescence predict whether student are involved in education, work, both, or are NEET in late adolescence (Hypothesis 1). This relationship can be represented by the following general equation:
= = +
where j refers to the outcome categories: J refers to the reference category of being in school, while the other j refer to the other categories of working, working while in school, or being NEET. is a constant and is a vector of coefficients for each j up to j-1. Three equations are simultaneously modeled, one comparing only working to only being in school, one comparing being NEET to being in school, and one comparing working and being in school concurrently to only being in school.
The multinomial logistic regression makes no assumptions about the ways in which individuals make decision (i.e., that one outcome is more favorable than another) nor does it place a value judgment on any of the categories. An advantage of this type of model is its ability to allow the cognitive and noncognitive skills to have different influences on each outcome. For example, cognitive skills may be more salient to participating in the workforce than to being NEET.
RESULTS
Descriptive statistics
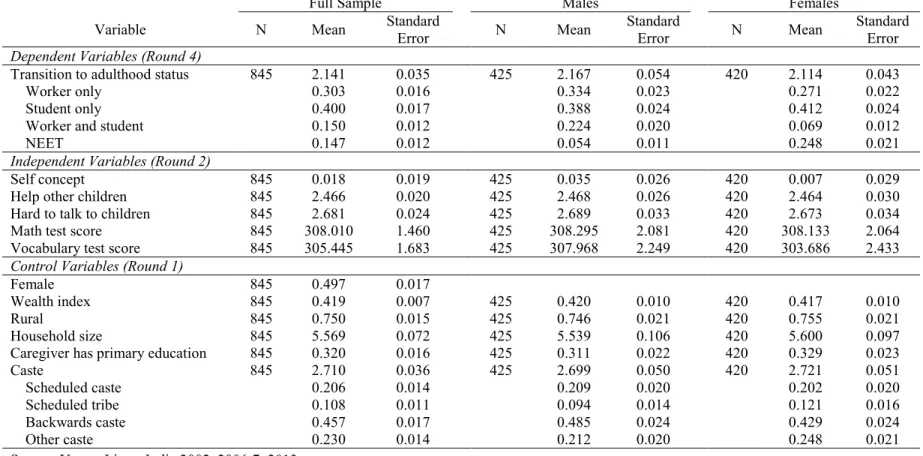
One-half (49.7%) of the participants in the sample are female, and three-quarters (75.0%) live in rural areas. On average, they live in a household with 4.6 other people, and with a
caregiver who has not completed primary education. Just 32.0 percent of youth live with a caregiver who has completed primary education. The participants come from a variety of caste backgrounds: 20.6 percent come from the scheduled caste; 10.8 percent from scheduled tribe, 45.7 percent from backward castes, and 23.0 percent from other higher castes.
2
5
Table 1. Descriptive statistics for full sample, males, and females, post-multiple imputation
Full Sample Males Females
Variable N Mean Standard
Error N Mean
Standard
Error N Mean
Standard Error
Dependent Variables (Round 4)
Transition to adulthood status 845 2.141 0.035 425 2.167 0.054 420 2.114 0.043
Worker only 0.303 0.016 0.334 0.023 0.271 0.022
Student only 0.400 0.017 0.388 0.024 0.412 0.024
Worker and student 0.150 0.012 0.224 0.020 0.069 0.012
NEET 0.147 0.012 0.054 0.011 0.248 0.021
Independent Variables (Round 2)
Self concept 845 0.018 0.019 425 0.035 0.026 420 0.007 0.029
Help other children 845 2.466 0.020 425 2.468 0.026 420 2.464 0.030
Hard to talk to children 845 2.681 0.024 425 2.689 0.033 420 2.673 0.034 Math test score 845 308.010 1.460 425 308.295 2.081 420 308.133 2.064 Vocabulary test score 845 305.445 1.683 425 307.968 2.249 420 303.686 2.433
Control Variables (Round 1)
Female 845 0.497 0.017
Wealth index 845 0.419 0.007 425 0.420 0.010 420 0.417 0.010
Rural 845 0.750 0.015 425 0.746 0.021 420 0.755 0.021
Household size 845 5.569 0.072 425 5.539 0.106 420 5.600 0.097
Caregiver has primary education 845 0.320 0.016 425 0.311 0.022 420 0.329 0.023
Caste 845 2.710 0.036 425 2.699 0.050 420 2.721 0.051
Scheduled caste 0.206 0.014 0.209 0.020 0.202 0.020
Scheduled tribe 0.108 0.011 0.094 0.014 0.121 0.016
Backwards caste 0.457 0.017 0.485 0.024 0.429 0.024
Other caste 0.230 0.014 0.212 0.020 0.248 0.021
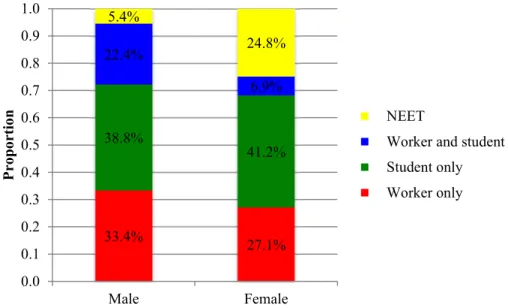
The transition to adulthood status varies considerably by gender (See Figure 1). Over one-third (33.4%) of young men are working at age 18-19; or are in school (38.8%);
approximately one-fifth (22.4%) are both working and enrolled in school; and just five (5.4) percent are NEET. In contrast, about one-quarter of young women are working (27.1%), and two-fifths are in school (41.2%), while just seven (6.9) percent are doing both at the same time and one-quarter are NEET (24.8%). Of the young women who are NEET, three-fifths (60.6%) are married, compared with just one-fifth (19.9%) of women who are not NEET.
Figure 1. Transition to adulthood status by gender at ages 18-19
Bivariate statistics
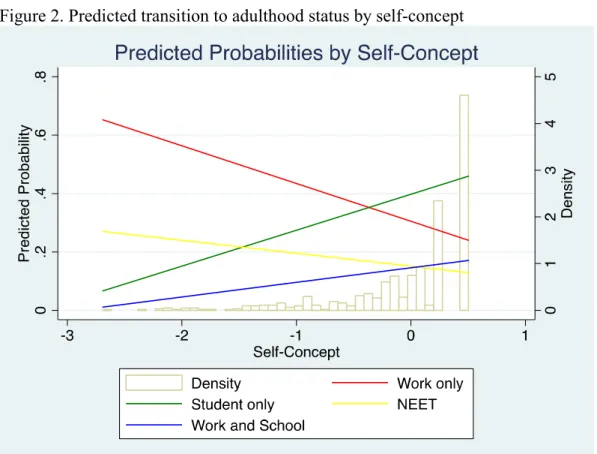
When examined in a bivariate framework, there is a significant relationship between self-concept and transition to adulthood status. Youth with higher levels of self-self-concept have lower odds of working compared with being students. Youth with higher levels of self-concept also have lower odds of being NEET than students. In a bivariate sense, the social skill indicators are
33.4% 27.1% 38.8% 41.2% 22.4% 6.9% 5.4% 24.8% 0.0 0.1 0.2 0.3 0.4 0.5 0.6 0.7 0.8 0.9 1.0 Male Female P r o p o r ti o
n NEET
Figure 2. Predicted transition to adulthood status by self-concept
Multivariate results
The first three columns in Table 2 present findings from the multinomial logistic
regression examining the relationship between cognitive and noncognitive skills and transition to adulthood status for the entire sample.13 This model tests Hypothesis 1, that noncognitive skills help keep youth in school rather than transitioning to the workforce. Results show that youth with higher levels of self-concept in early adolescence are less likely to be workers than to be students, in comparison to youth with lower levels of self-concept (b=-0.518, p<.01).
2
9
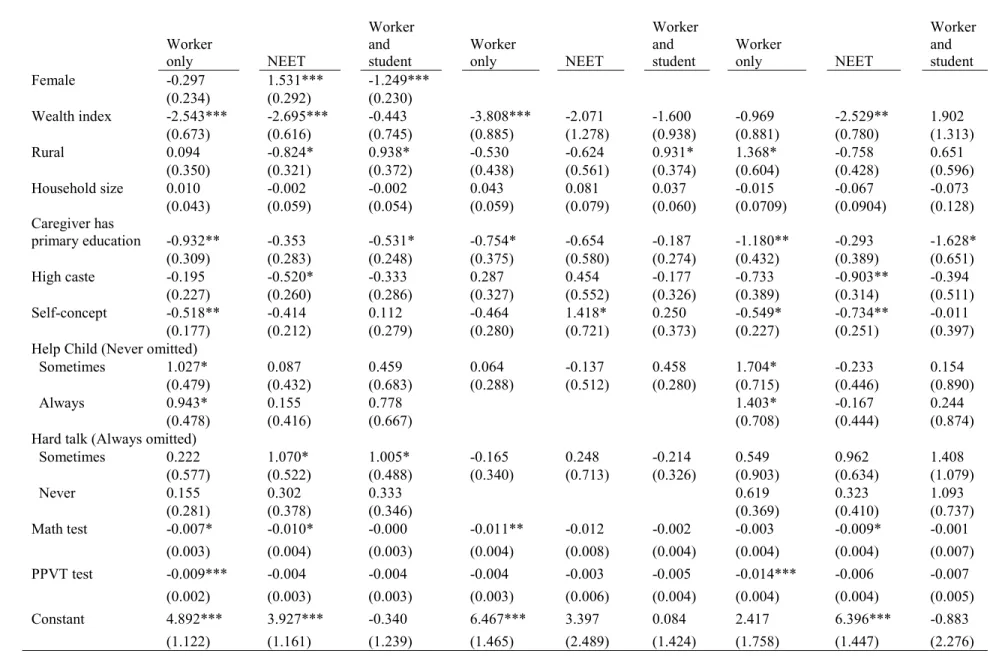
Table 2. Multinomial logistic regression results for full sample, males, and females
Full sample (reference student only) Males Females
Worker
only NEET
Worker and student
Worker
only NEET
Worker and student
Worker
only NEET
Worker and student Female -0.297 1.531*** -1.249***
(0.234) (0.292) (0.230)
Wealth index -2.543*** -2.695*** -0.443 -3.808*** -2.071 -1.600 -0.969 -2.529** 1.902 (0.673) (0.616) (0.745) (0.885) (1.278) (0.938) (0.881) (0.780) (1.313)
Rural 0.094 -0.824* 0.938* -0.530 -0.624 0.931* 1.368* -0.758 0.651
(0.350) (0.321) (0.372) (0.438) (0.561) (0.374) (0.604) (0.428) (0.596) Household size 0.010 -0.002 -0.002 0.043 0.081 0.037 -0.015 -0.067 -0.073
(0.043) (0.059) (0.054) (0.059) (0.079) (0.060) (0.0709) (0.0904) (0.128) Caregiver has
primary education -0.932** -0.353 -0.531* -0.754* -0.654 -0.187 -1.180** -0.293 -1.628* (0.309) (0.283) (0.248) (0.375) (0.580) (0.274) (0.432) (0.389) (0.651) High caste -0.195 -0.520* -0.333 0.287 0.454 -0.177 -0.733 -0.903** -0.394
(0.227) (0.260) (0.286) (0.327) (0.552) (0.326) (0.389) (0.314) (0.511) Self-concept -0.518** -0.414 0.112 -0.464 1.418* 0.250 -0.549* -0.734** -0.011
(0.177) (0.212) (0.279) (0.280) (0.721) (0.373) (0.227) (0.251) (0.397) Help Child (Never omitted)
Sometimes 1.027* 0.087 0.459 0.064 -0.137 0.458 1.704* -0.233 0.154
(0.479) (0.432) (0.683) (0.288) (0.512) (0.280) (0.715) (0.446) (0.890)
Always 0.943* 0.155 0.778 1.403* -0.167 0.244
(0.478) (0.416) (0.667) (0.708) (0.444) (0.874)
Hard talk (Always omitted)
Sometimes 0.222 1.070* 1.005* -0.165 0.248 -0.214 0.549 0.962 1.408
(0.577) (0.522) (0.488) (0.340) (0.713) (0.326) (0.903) (0.634) (1.079)
Never 0.155 0.302 0.333 0.619 0.323 1.093
(0.281) (0.378) (0.346) (0.369) (0.410) (0.737)
Math test -0.007* -0.010* -0.000 -0.011** -0.012 -0.002 -0.003 -0.009* -0.001 (0.003) (0.004) (0.003) (0.004) (0.008) (0.004) (0.004) (0.004) (0.007) PPVT test -0.009*** -0.004 -0.004 -0.004 -0.003 -0.005 -0.014*** -0.006 -0.007
3
0
N 845 425 420
* <.05 ** <.01 ***<.001 (2-tailed)
Note: For the male model, the social skill variables, help child and hard talk, were dichotomized. Hard talk is coded Always or Sometimes = 0, Never=1. Help child is coded Never or Sometimes=0, Always=1.
Social skills, on the other hand, may be associated with increases in the likelihood that a youth is a worker, works while in school, or is NEET, compared to being a student only.
Specifically, helping other children is associated with an increased likelihood of working (b=1.027, p<.05; b=0.943, p<.05), and not finding it hard to talk to other children is associated with increased likelihoods of being NEET (b=1.070, p<.05) or student workers (b=1.005, p<.05), in comparison to being students. This finding, that social skills are positively related to outcomes other than being in school, is unexpected, as extant literature finds that noncognitive skills tend to work in the same direction as one another.
Thus with respect to Hypothesis 1, self-concept is associated with reduced odds of youth entering the workforce, while social skills are associated with a higher likelihood of departure from school. Previous research finds that noncognitive skills tend to work in the same direction, but these results show differential effects based on the individual skill.
The role of gender. This model was also examined for males and females separately because young men and women may have different paths into adulthood, especially into being NEET (Hypothesis 2). Among males, the relationships between the control variables and the outcome are much the same as in the full sample, though caste is not related to transition to adulthood status.14 Self-concept is not significantly related to transition to adulthood status among young men, but is positively associated with being NEET (b=1.418, p<.05). This finding is in the opposite direction of Hypothesis 2. There is no statistically significant relationship between either of the social skill variables and any of the three outcome categories. For boys, math scores are related to lower odds of working (b= -0.011, p<.01 ), while vocabulary does not have an influence.
Among young women, the odds that one enters the workforce or is NEET decrease as self-concept increases. Girls with higher self-concept at age 11-12 are less likely to be working (b=-0.549, p<.05) or NEET (b=-0.734, p<.01) at age 18-19 than in school. Helping other
children, either sometimes (b=1.704, p<.05) or always (b=1.403, p<.05) in comparison to never, is related to an increased likelihood of working. Social skills are not related to being NEET or student workers. Cognitive ability is associated with decreased odds girls falling into statuses other than being in school (math in reference to being NEET: b= -0.009, p<.05; vocabulary in
reference to working: b= -0.014, p<.001). Wealthy girls are less likely to be NEET (b=-2.529, p<.01), as are those from high castes (b=-0.903, p<.01). Rural girls are more likely to work than urban girls (b=1.368, p<.05).
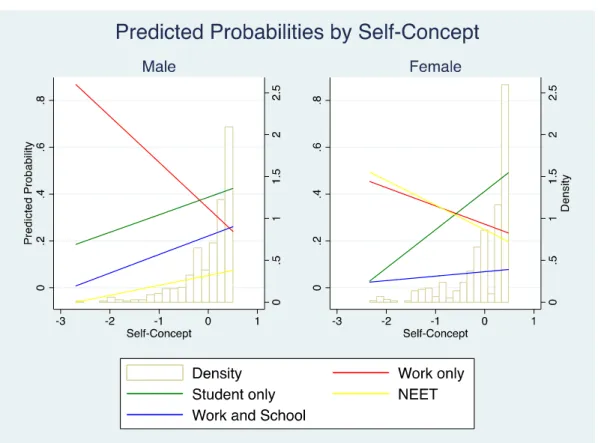
In summary, social skills are associated with increased probabilities of working for young women while self-concept is associated with a decreased likelihood of working or being NEET. Meanwhile, for young men, self-concept is associated with being NEET. Cognitive skills are related to increased probabilities of being in school for both young men and women, though math appears to be more influential for males, and vocabulary more influential for females. Figure 3 presents predicted probabilities for being in each outcome category for males and females separately. Keep in mind that the data presented are descriptive, and based on the actual Young Lives data, and do not involve any microsimulation. The green line, showing the
Figure 3. Predicted probability by self-concept and gender
3
5
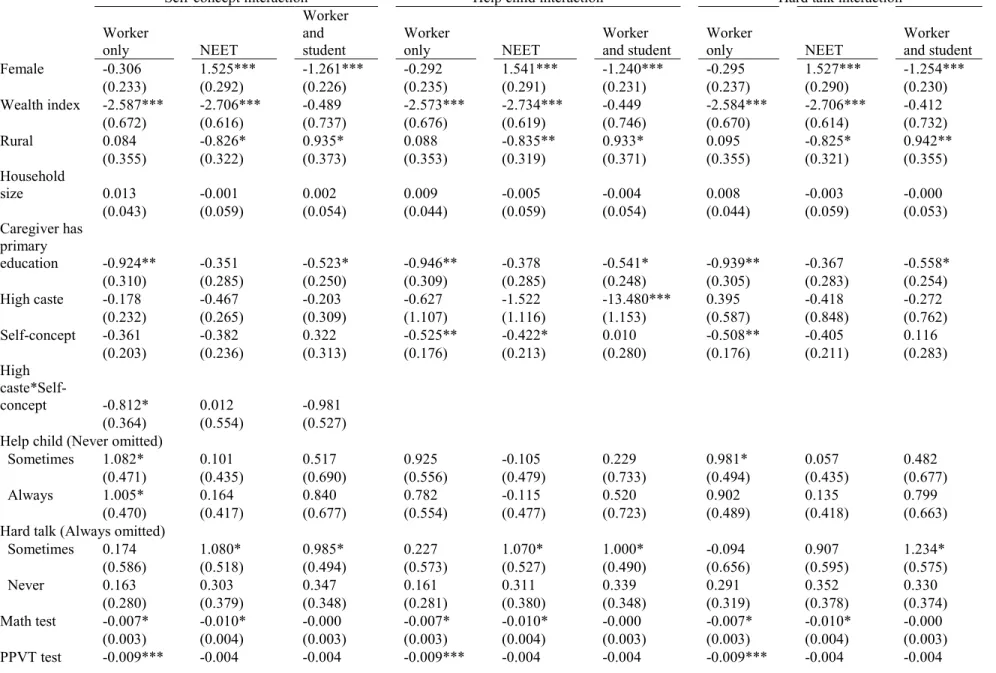
Table 3. Multinomial logistic regression results including caste interactions
Self-concept interaction Help child interaction Hard talk interaction
Worker
only NEET
Worker and student
Worker
only NEET
Worker and student
Worker
only NEET
Worker and student Female -0.306 1.525*** -1.261*** -0.292 1.541*** -1.240*** -0.295 1.527*** -1.254***
(0.233) (0.292) (0.226) (0.235) (0.291) (0.231) (0.237) (0.290) (0.230) Wealth index -2.587*** -2.706*** -0.489 -2.573*** -2.734*** -0.449 -2.584*** -2.706*** -0.412
(0.672) (0.616) (0.737) (0.676) (0.619) (0.746) (0.670) (0.614) (0.732)
Rural 0.084 -0.826* 0.935* 0.088 -0.835** 0.933* 0.095 -0.825* 0.942**
(0.355) (0.322) (0.373) (0.353) (0.319) (0.371) (0.355) (0.321) (0.355) Household
size 0.013 -0.001 0.002 0.009 -0.005 -0.004 0.008 -0.003 -0.000
(0.043) (0.059) (0.054) (0.044) (0.059) (0.054) (0.044) (0.059) (0.053) Caregiver has
primary
education -0.924** -0.351 -0.523* -0.946** -0.378 -0.541* -0.939** -0.367 -0.558* (0.310) (0.285) (0.250) (0.309) (0.285) (0.248) (0.305) (0.283) (0.254) High caste -0.178 -0.467 -0.203 -0.627 -1.522 -13.480*** 0.395 -0.418 -0.272
(0.232) (0.265) (0.309) (1.107) (1.116) (1.153) (0.587) (0.848) (0.762) Self-concept -0.361 -0.382 0.322 -0.525** -0.422* 0.010 -0.508** -0.405 0.116
(0.203) (0.236) (0.313) (0.176) (0.213) (0.280) (0.176) (0.211) (0.283) High
caste*Self-concept -0.812* 0.012 -0.981 (0.364) (0.554) (0.527) Help child (Never omitted)
Sometimes 1.082* 0.101 0.517 0.925 -0.105 0.229 0.981* 0.057 0.482 (0.471) (0.435) (0.690) (0.556) (0.479) (0.733) (0.494) (0.435) (0.677)
Always 1.005* 0.164 0.840 0.782 -0.115 0.520 0.902 0.135 0.799
(0.470) (0.417) (0.677) (0.554) (0.477) (0.723) (0.489) (0.418) (0.663) Hard talk (Always omitted)
Sometimes 0.174 1.080* 0.985* 0.227 1.070* 1.000* -0.094 0.907 1.234* (0.586) (0.518) (0.494) (0.573) (0.527) (0.490) (0.656) (0.595) (0.575)
Never 0.163 0.303 0.347 0.161 0.311 0.339 0.291 0.352 0.330
(0.280) (0.379) (0.348) (0.281) (0.380) (0.348) (0.319) (0.378) (0.374) Math test -0.007* -0.010* -0.000 -0.007* -0.010* -0.000 -0.007* -0.010* -0.000
3
6
(0.002) (0.003) (0.003) (0.002) (0.003) (0.003) (0.002) (0.003) (0.003) High caste*Help child (Never omitted)
High caste*Sometimes 0.313 0.871 13.150***
(1.133) (1.169) (1.231) High
caste*Always 0.572 1.220 13.220***
(1.132) (1.145) (1.212) High caste*Hard talk (Always omitted)
High caste*Sometimes 0.585 0.474 -13.440***
(0.978) (1.204) (1.136) High
caste*Never -0.785 -0.183 0.066
(0.614) (0.914) (0.780) Constant 4.794*** 3.870*** -0.509 5.028*** 4.160*** -0.101 4.850*** 3.929** -0.429
(1.130) (1.159) (1.271) (1.144) (1.144) (1.262) (1.119) (1.209) (1.227)
N=845
* <.05 ** <.01 ***<.001
The first model examines the interaction between high caste and positive self-concept. The main effect of self-concept is not a significant predictor of being a worker, NEET, or student worker, suggesting that self-concept is not related to transition to adulthood status for youth from low castes. The interaction between high caste and self-concept is significant and negative for being a worker (b=-0.812, p<.05), though, indicating that for youth in high castes, self-concept is associated with lower odds of being a worker, even though there is no relationship for youth in low castes.
The heightened importance of self-concept decreasing the odds of working for youth from high castes is illustrated in Figure 4.15 The dashed green line, representing the predicted probability of being in school for youth from high castes, is much steeper than the solid green line, representing the predicted probability of being in school for low-caste youth. Similarly, the dashed red line slopes downward more steeply than the solid red line, indicating a stronger relationship between self-concept and the probability of working for high-caste youth than low-caste youth.
This effect does not reach statistical significance for males or females alone. However, among females, self-concept is associated with lower odds of being NEET for youth from low castes (b=-0.615, p<.05) and self-concept is associated with lower odds of working while being a student for high-caste young women (b=-2.673, p<.001). All of the significant effects are in the same direction, with self-concept linked to decreased likelihoods of all statuses other than being in school. In two out of the three significant findings, self-concept is significant for youth from higher castes, but not from lower castes. These findings are in line with Hypothesis 3, that noncognitive skills matter more for high castes than low castes.
Figure 4. Predicted probability by self-concept and caste, for females
The second and third sets of columns in Table 3 examine the intersection of caste and social skills. These models show very little in terms of the influence of social skills on being either a worker or NEET in comparison to being a student.
helping other children is positively associated with being a worker (b=11.93, p<.001; b=12.54, p<.001) for youth from high castes.16
The other indicator of social skills, not finding it hard to talk to other students, has a main effect positively related to being a worker and a student among the full sample, indicating that finding it hard to talk to other students sometimes, as opposed to always, increases the
probability of being a student worker (b=1.234, p<.05) for youth from low castes. The interaction between high caste and this term is negative and significant (b=-13.440, p<.001), indicating that talking to other students decreases the odds of being a student worker for high caste youth, even though it is predictive of being a student worker for low-caste youth. The findings are similar for the male subsample. For the males, there is no relationship between finding it hard to talk to other children and being a student worker among low-caste youth. However, it decreases the odds of being a student worker for high-caste youth (b=-15.080, p<.001). For the females, however, the results reflect the opposite pattern. Again, there is no relationship between the skill and being a student-worker among low-caste youth; however, this skill positively predicts being a student worker for high-caste young women (b=11.710, p<.01). The ability to talk to other students is also related to being NEET and working, for males and females, respectively. For males, this skill is positively associated with being NEET for low-caste youth only (b=14.810, p<.001; b=14.020, p<.001). For females, this skill is positively
related to working for low-caste youth (b=0.966, p<.05) but decreases the odds of working for high-caste youth (b=-2.294, p<.01).
Taken together, with respect to Hypothesis 3, these findings indicate that noncognitive skills may be more potent for high-caste youth than low-caste youth. Results are most clear-cut
with self-concept, which has a stronger negative relationship with being out-of-school for high-caste youth. Social skills also seem to be more potent for high-high-caste youth than low-high-caste youth, but the direction of this relationship (i.e., whether social skills protect against or promote being out-of-school) is less clear. The ability to talk to other children is related to youth in high castes staying in school. Meanwhile, helping other children is actually positively related to being out of school for youth in high castes. For youth in low castes, not finding it hard to talk to other children is positively related to being out-of-school. These findings indicate that there may be different mechanisms at play which influence the entry into work while being a student for youth from different caste backgrounds.
DISCUSSION
As the importance of noncognitive skills has been well documented in the United States and Europe, the role they play in the developing world has remained under-studied. This study examines three hypotheses surrounding the role of noncognitive skills in the transition to the workforce for youth in Andhra Pradesh, India.
There is some evidence to support Hypothesis 1, namely that noncognitive skills in early adolescence predict whether a youth is involved in education, work, both, or is NEET in early adulthood. Positive self-concept, in particular, is associated with a lower likelihood of youth working in comparison to being in school. The relationship between social skills and transition to adulthood status is in the opposite direction; evidence indicates that higher levels of social skills may be associated with children working, working while going to school, or being NEET in late adolescence rather than going to school. Self-concept is linked to a smaller probability that youth leave school, while social skills may entice them to do so. It could be that because education is so valued in India, students who are doing well in school at age 11, when self-concept is measured, may feel especially good about themselves. This self-concept could then lead to continuing to do well in school. Meanwhile, social skills could potentially enhance youths’ value as potential employees. This finding of different skills being related to different outcomes has not been found in the developed world. Future work in the developing world should examine whether similar trends exist elsewhere.
appear to be more important for girls than boys. Girls with higher levels of self-concept in early adolescence are less likely to work in early adulthood, compared with being a student. Self-concept is not related to working for boys, though, and is actually associated with being idle. For girls, social skills are linked to working, while they have no predictive power for boys. One potential mechanism for this link is that girls who are helpful to others are seen as valuable and are recruited into the workforce at an earlier age, rather than continuing with their schooling. Alternatively, as India has worked toward gender equality in education, it could be that those girls with especially positive self-concepts are able to negotiate roles within the family that allow them to stay in school longer. This explanation aligns with the previous finding of girls being sent to English-speaking schools that expand their future options.
Across the models, cognitive skills act in the expected direction. Youth with math and vocabulary skills are more likely to remain in school than work or be NEET. Math appears to be more influential for young men, and vocabulary appears to be more influential for young women.
In addition to varying by gender, the influence of noncognitive skills also varies by caste, above and beyond wealth, such that noncognitive skills are most influential for youth from higher castes. This finding is consistent with Hypothesis 3. While there is no way of knowing the mechanism behind this relationship from the current data, perhaps there are more opportunities for noncognitive skills to translate into outcomes for youth from higher castes than youth from lower castes. Whatever the mechanism is, it seems clear that noncognitive skills are more potent for youth from higher-caste backgrounds than youth from lower-caste backgrounds.
developed world, it is not perfect. The data provide a unique opportunity to examine youth as they transition to adulthood. As they are currently undergoing this transition, though, it is impossible to know how noncognitive skills will influence their long-term trajectories. As more data are released, it will be important to continue this line of inquiry.
The measures available in Young Lives are not comparable to those frequently used in developed countries. The measures in Young Lives were not asked of all youth, and therefore this study is limited to youth who were enrolled in school at age 11-12. These youth may be more advantaged than those not enrolled in school, and so these results may not be generalizable to the most disadvantaged children. Additionally, the items in Young Lives developed from extant instruments, but appear to have been developed uniquely for this survey. They
complement those used in other developing countries, notably the Big Five personality traits and grit used by the World Bank. Because the items available in Young Lives are original, and have not been validated, this study conducted confirmatory factor analysis to develop a measure of positive self-concept. Each item loads onto the latent variable of self-concept with a fairly low r-squared value (ranging from .07 to .52). These low loadings indicate that there is a considerable amount of measurement error. In the future, analyses using these variables should use structural equation modeling in order to account for the measurement error that cannot be addressed with the present analyses. That these items are used to form an unorthodox measure of positive self-concept is a limitation of this study. Future work on this dataset should continue to investigate what noncognitive skills can be measured with the available items.
coefficients across models using multinomial logistic regression, as standard errors are based on the unobserved heterogeneity, unlike in linear models. This unobserved heterogeneity varies between models including different sets of variables, and between estimates based on different samples, making direct comparisons between models or samples impossible (Mood 2010). In this paper, I have been careful to interpret each model within itself only, and have avoided making direct comparisons between models, or between subgroups. When I do make comparisons, it is with predicted probabilities rather than coefficients. As with any descriptive multivariate model, the results presented above cannot be interpreted causally.
CONCLUSION
Despite these limitations, the present study contributes to the field’s understanding of noncognitive skills in a novel setting. Noncognitive skills, notably positive self-concept and social skills, are influential in an adolescent’s transition to adulthood outside of the developed world. Their influence is not uniform, but varies according to the type of skill measured, the youth’s gender, and his or her social status. Future work should continue to investigate the role that noncognitive skills play in the lives of young people in diverse settings, and under what conditions these skills are influential.
This research is especially timely, as not only do nine in ten youth currently live in developing countries, but many developing nations are currently undergoing or will soon undergo the demographic transition, resulting in a disproportionately large cohort of youth. Without too many elders to support, these large youth cohorts offer a tremendous opportunity for countries to improve the livelihoods of their people. As this study demonstrates, certain
REFERENCES
Anon. 2007. “OBCs Form 41% of Population: Survey.” The Times of India, September 1. Retrieved May 23, 2016 (http://timesofindia.indiatimes.com/india/OBCs-form-41-of-population-Survey/articleshow/2328117.cms).
Barrick, Murray R. and Michael K. Mount. 1991. “The Big Five Personality Dimensions and Job Performance: A Meta-Analysis.” Personnel Psychology 44:1–26.
Bassi, Marina and Galiani, Sebastian. 2009. “Labor Market Insertion of Young Adults in Chile.” Retrieved June 3, 2015
(http://www.sociedadpoliticaspublicas.cl/archivos/MODULO_II/Panel02_Mercado_del_t rabajo/Marina_Bassi_Labor_market_insertionof_young_adults_in_Chile.pdf).
Bhogle, Sudha. 1999. “Gender Roles: The Construct in the Indian Context.” in Culture,
socialization and human development: Theory, research and applications in India, edited by Saraswathi, T. S. New Delhi/Thousand Oaks/London: Sage.
Bowles, Samuel, Herbert Gintis, and Melissa Osborne. 2001. “The Determinants of Earnings: A Behavioral Approach.” Journal of Economic Literature 39(4):1137–76.
Camfield, Laura. 2012. “Resilience and Well-Being among Urban Ethiopian Children: What Role Do Social Resources and Competencies Play?” Social Indicators Research
107(3):393–410.
Cueto, Santiago, Leon, Juan, Guerrero, Gabriela, and Munoz, Ismael. 2009. Psychometric Characteristics of Cognitive Development and Achievement Instruments in Round 2 of Young Lives. Young Lives. Retrieved
(http://www.younglives.org.uk/publications/TN/psychometric-characteristics-cognitive- development-achievement-instruments/psychometric-characteristics-of-cognitive-development-and-achievement-instruments-in-round-2-of-young-lives).
Dercon, Stefan and Krishnan, Pramila. 2009. “Poverty and the Psychosocial Competencies of Children: Evidence from the Young Lives Sample in Four Developing Countries.”
Children, Youth and Environments 19(2):138–63.
Diaz, Juan Jose, Arias, Omar, and Tudela, David Vera. 2012. Does Perseverance Pay as Much as Being Smart?: The Returns to Cognitive and Non-Cognitive Skills in Urban Peru. Retrieved (http://econweb.umd.edu/~urzua/DiazAriasTudela.pdf).
Dumont, Louis. 1970. Homo Hierarchicus: The Caste System and Its Implications. Chicago, IL: University of Chicago Press.
Dweck, Carol. 2008. Mindset: The New Psychology of Success. Ballantine Books Trade Paperback Edition. New York, NY: Ballantine Books Trade.
Galub, S., Reddy, P. Prudhvikar, and Himaz, Rozana. 2008. Young Lives Round 2 Survey Report: Andhra Pradesh, India. Oxford: Young Lives. Retrieved
(http://www.younglives.org.uk/content/young-lives-round-2-survey-report-andhra-pradesh-india).
Ghurye, G. S. 1932. Caste and Race in India. New York, NY: Alfred A. Knopf.
Glewwe, Paul, Quiqiong Huang, and Albert Park. 2013. Cognitive Skills, Noncognitive Skills, and the Employment and Wages of Young Adults in Rural China. Retrieved October 17, 2014
(https://www.apec.umn.edu/sites/apec.umn.edu/files/cognitive_skills_noncognitive_skills _and_the_employment_and_wages.pdf).
Government of India Ministry of Law and Justice. 2015. “The Constitution of India.” Retrieved May 23, 2016 (http://lawmin.nic.in/olwing/coi/coi-english/coi-4March2016.pdf).
Government of India Ministry of Social Justice and Empowerment. 2009. “Welfare of Backward Classes - About the Division.” Retrieved May 23, 2016
(http://socialjustice.nic.in/aboutdivision4.php).
Gupta, Monica Das et al. 2014. The Power of 1.8 Billion: Adoelscents, Youth and the Transformation of the Future. New York, NY: United Nations Population Fund. Heckman, James J., JingJing Hsse, and Yona Rubinstein. 2000. “The GED Is a Mixed Signal:
The Effect of Cognitive and Non-Cognitive Skills on Human Capital and Labor Market Outcomes.” University of Chicago. Retrieved
(https://www.google.com/url?sa=t&rct=j&q=&esrc=s&source=web&cd=3&ved=0ahUK EwjhmZ3gsMHNAhUD5SYKHbxKDIcQFggzMAI&url=http%3A%2F%2Fwww.ibraria n.net%2Fnavon%2Fpaper%2FCognitive_and_non_Cognitive_Skills_on_Human_Capit.p df%3Fpaperid%3D11332940&usg=AFQjCNEqywfLOQviqL1vkwSL3qKPKfqR_w&sig 2=N4k0zp1oCR099U2PDswjgQ).
Heckman, James J., Jora Stixrud, and Sergio Urzua. 2006. “The Effects of Cognitive and Noncognitive Abilities on Labor Market Outcomes and Social Behavior.” Journal of Labor Economics 24(3):411–82.
International Labour Organization, Department of Statistics. 2012. Statistical Update on Employment in the Informal Economy. International Labour Organization. Retrieved
Kautz, T. D., Heckman, James J., Diris, Ron, Weel, Bas ter, and Borghans, Lex. 2014. Fostering and Measuring Skills: Improving Cognitive and Non-Cognitive Skills to Promote Lifetime Success. Cambridge, MA: National Bureau of Economic Research.
Kohn, Melvin L. 1977. Class and Conformity: A Study in Values with a Reassessment, 1977. 2nd ed. Chicago, IL: The University of Chicago Press.
Kohn, Melvin L. 2006. Change and Stability: A Cross-National Analysis of Social Structure and Personality. Boulder, CO: Paradigm Publishers.
Kohn, Melvin L. and Schooler, Carmi. 1982. “Job Conditions and Personality: A Longitudinal Assessment of Their Reciprocal Effects.” American Journal of Sociology 87(6):1257–86. Kumra, Neha. 2008. An Assessment of the Young Lives Sampling Approach in Andhra Pradesh,
India. Oxford: Young Lives. Retrieved May 24, 2016
(http://www.younglives.org.uk/sites/www.younglives.org.uk/files/YL-TN02-Kumra-Sampling-Approach-In-AP.pdf).
Lavado, Pablo, Luciana Velarde, and Gustavo Yamada. 2013. Cognitive and Non-Cognitive Skills and Wages: The Role of Latent Abilities on the Gender Wage Gap in Peru. Young Lives.
Lippman, Laura H., Ryberg, Renee, Carney, Rachel, and Moore, Kristin A. 2015. Key “Soft” Skills That Foster Youth Workforce Success: Toward a Consensus Across Fields. Washington, D.C.: USAID.
Mood, Carina. 2010. “Logistic Regression: Why We Cannot Do What We Think We Can Do, and What We Can Do About It.” European Sociological Review 26(1):67–82.
Morrow, Virginia. 2013a. “Troubling Transitions? Young People’s Experiences of Growing up in Poverty in Rural Andhra Pradesh, India.” Journal of Youth Studies 16(1):86–100. Morrow, Virginia. 2013b. “Whose Values? Young People’s Aspirations and Experiences of
Schooling in Andhra Pradesh, India.” Children & Society 27(4):258–69.
Munshi, Kaivan and Rosenzweig, Mark. 2006. “Traditional Institutions Meet the Modern World: Caste, Gender, and Schooling Choice in a Globalizing Economy.” The American
Economic Review 96(4):1225–52.
Nikoloski, Zlatko and Ajwad, Mohamed Ihsan. 2014. Cognitive and Non-Cognitive Skills Affect Employment Outcomes: Evidence from Central Asia. Retrieved
Outes-Leon, Ingo and Dercon, Stefan. 2008. Survey Attrition and Attrition Bias in Young Lives. Young Lives. Retrieved (http://www.younglives.org.uk/publications/TN/survey-attrition-bias-young-lives/survey-attrition-and-attrition-bias-in-young-lives).
Rao, R. V. Chandrasekhara. 2015. “Andhra Pradesh.” Encyclopaedia Britannica. Retrieved August 28, 2015 (http://www.britannica.com/place/Andhra-Pradesh).
Rolleston, Caine. 2014. “Learning Profiles and the ‘Skills Gap’ in Four Developing Countries: A Comparative Analysis of Schooling and Skills Development.” Oxford Review of
Education 40(1):132–50.
Rubin, D. B. 1987. Multiple Imputation for Nonresponse in Surveys. New York, NY: John Wiley and Sons.
Salgado, Jesus F. 1997. “The Five Factor Model of Personality and Job Performance in the European Community.” Journal of Applied Psychology 82(1):30–43.
Saraswathi, T. S. 1999. “Adult-Child Continuity in India: Is Adolescence a Myth or an Emerging Reality?” Pp. 213–32 in Culture, socialization and human development: Theory, research and applications in India. Thousand Oaks, CA: SAGE Publications Ltd.
Seiter, Liann Nicole. 2009. “Emerging Adulthood in India.” Bringham Young University, Provo, UT.
Shanahan, Michael J., Bauldry, Shawn, Roberts, Brent W., Macmillan, Ross, and Russo, Rosemary. 2014. “Personality and the Reproduction of Social Class.” Social Forces
93(1):209–40.
Shanahan, Michael J., Glen H. Elder, and Richard A. Miech. 1997. “History and Agency in Men’s Lives: Pathways to Achievement in Cohort Perspective.” Sociology of Education
70(1):54–67.
Shanahan, Michael J., Mortimer, Jeylan T., and Kruger, Helga. 2002. “Adolescence and Adult Work in the Twenty-First Century.” Journal of Research on Adolescence 12(1):99–120. Singh, Abhijeet and Revollo, Patricia Espinoza. 2016. Teenage Marriage, Fertility, and
Well-Being: Panel Evidence from India. Oxford: Young Lives. Retrieved May 24, 2016
(http://www.younglives.org.uk/sites/www.younglives.org.uk/files/YL-WP151_Teenage%20Marriage%20Fertility%20and%20Well-being.pdf).
The editors of Encyclopaedia Britannica. 2016. “Varna.” Encyclopaedia Britannica. Retrieved August 17, 2016 (https://www.britannica.com/topic/varna-Hinduism).
Verma, Suman. 2000. “The Indian Social Reality of Passage to Adulthood.” International Society for the Study of Behavioural Development Newsletter 2(37):6–9.