Unified
feature
association
networks
through
integration
of
transcriptomic
and
proteomic
data
RyanS.McClure1,JasonP.WendlerID1,JoshuaN.Adkins1,JesicaSwanstrom2,
RalphBaric2,BrookeL.DeatherageKaiser3,KristieL.OxfordID1,KatrinaM.WatersID1,
JasonE.McDermottID1,4*
1BiologicalSciencesDivision,PacificNorthwestNationalLaboratory,RichlandWA,UnitedStatesof America,2DepartmentofMicrobiologyandImmunology,SchoolofMedicine,UniversityofNorthCarolina, ChapelHill,ChapelHill,NC,UnitedStatesofAmerica,3SignaturesScienceandTechnologyDivision, PacificNorthwestNationalLaboratory,RichlandWA,UnitedStatesofAmerica,4DepartmentofMolecular MicrobiologyandImmunology,OregonHealth&SciencesUniversity,Portland,OR,UnitedStatesofAmerica
Abstract
High-throughputmulti-omicsstudiesandcorrespondingnetworkanalysesofmulti-omic datahaverapidlyexpandedtheirimpactoverthelast10years.Asbiologicalfeaturesof dif-ferenttypes(e.g.transcripts,proteins,metabolites)interactwithincellularsystems,the greatestamountofknowledgecanbegainedfromnetworksthatincorporatemultipletypes of-omicdata.However,biologicalandtechnicalsourcesofvariationdiminishtheabilityto detectcross-typeassociations,yieldingnetworksdominatedbycommunitiescomprisedof nodesofthesametype.Wedescribeherenetworkbuildingmethodsthatcanmaximize edgesbetweennodesofdifferentdatatypesleadingtointegratednetworks,networksthat havealargenumberofedgesthatlinknodesofdifferent–omictypes(transcripts,proteins, lipidsetc).Wesystematicallyrankseveralnetworkinferencemethodsanddemonstrate that,inmanycases,usingarandomforestmethod,GENIE3,producesthemostintegrated networks.ThisincreaseinintegrationdoesnotcomeatthecostofaccuracyasGENIE3 pro-ducesnetworksofapproximatelythesamequalityastheothernetworkinferencemethods testedhere.UsingGENIE3,wealsoinfernetworksrepresentingantibody-mediatedDengue viruscellinvasionandreceptor-mediatedDenguevirusinvasion.Anumberoffunctional pathwaysshowedcentralitydifferencesbetweenthetwonetworksincludinggenes respond-ingtobothGM-CSFandIL-4,whichhadahighercentralityvalueinanantibody-mediated vs.receptor-mediatedDenguenetwork.Becauseabiologicalsysteminvolvestheinterplay ofmanydifferenttypesofmolecules,incorporatingmultipledatatypesintonetworkswill improvetheiruseasmodelsofbiologicalsystems.Themethodsexploredherearesomeof thefirsttospecificallyhighlightandaddressthechallengesassociatedwithhowsuch multi-omicnetworkscanbeassembledandhowthegreatestnumberofinteractionscanbe inferredfromdifferentdatatypes.Theresultingnetworkscanleadtothediscoveryofnew hostresponsepatternsandinteractionsduringviralinfection,generatenewhypothesesof pathogenicmechanismsandconfirmmechanismsofdisease.
a1111111111 a1111111111 a1111111111 a1111111111 a1111111111 OPEN ACCESS
Citation: McClure RS, Wendler JP, Adkins JN,
Swanstrom J, Baric R, Kaiser BLD, et al. (2019) Unified feature association networks through integration of transcriptomic and proteomic data. PLoS Comput Biol 15(9): e1007241.https://doi. org/10.1371/journal.pcbi.1007241
Editor: Paul Jensen, University of Illinois at
Urbana-Champaign, UNITED STATES
Received: August 20, 2018 Accepted: July 2, 2019 Published: September 17, 2019
Copyright: This is an open access article, free of all
copyright, and may be freely reproduced, distributed, transmitted, modified, built upon, or otherwise used by anyone for any lawful purpose. The work is made available under theCreative Commons CC0public domain dedication.
Data Availability Statement: All viral
transcriptomic data used in this study has been uploaded to the Gene Expression Omnibus (GEO) with accession number GSE135079. Accession numbers for additional transcriptomic data sets are called out in the text. All proteomic data used in this study is available via ProteomeXchange with identifier PXD014780 (https://www.ebi.ac.uk/pride/ archive/projects/PXD014780).
Funding: JNA, Intelligence Advanced Research
Author summary
Inferring co-expression networks that combine multiple types of–omics data can lead to networks that are highly segregated with very few edges linking nodes of different–omics types. Here, we explored methods of improving integration in co-expression networks and found that a random forest approach, GENIE3, was, in many cases, the best method for inferring such networks. GENIE3 was approximately as accurate as other network inference methods so this improvement in integration did not come at the cost of network quality. We also used GENIE3 to infer several networks using data derived from infection of human cells with Dengue virus and interrogated them to better understand processes that may have higher importance when Dengue virus carries out antibody-mediated infection compared to receptor-mediated infection. Processes involved in GM-CSF and IL-4 were more central during antibody-mediated infection. Overall, these studies identify network inference methods that are particularly well suited to multi-omic networks and also demonstrate how these approaches can be used to better understand Dengue virus infection.
Introduction
Over the last several decades, a number of multi-omic experimental methods have emerged to study host-pathogen interactions [1] and other complex biological systems. These studies focus on collecting a particular type of molecule from a biological system and using high throughput methods to query abundance levels across changing conditions. These empirical methods include transcriptomics [2–5], proteomics [6–8], metabolomics [9,10], and lipido-mics [11–13]. Host-pathogen interactions, including immunological responses and virulence factors, represent a particularly complex biological site where multiple different types of bio-molecules are known to play important roles. Therefore, some of the most critical insights and translational conclusions can be gained from combining different types of -omics-based stud-ies. Kocharunchitt et. al. examined the response ofEscherichia coliO157:H7 to varying water temperatures, emulating host interactions, by collecting proteomic and transcriptomic data and using both to query responses of a single parent gene [14]. Dapat and Oshitani linked host and viral proteins of respiratory syncytial virus based on creating networks of protein-protein interactions from pre-existing databases and then overlaying abundance data from transcrip-tomic and proteomic studies onto these networks to identify hubs that may alter their expres-sion [15].
Other studies have used transcriptomics, proteomics, and lipidomics in integrated net-works to elucidate interactions between Hepatitis C virus and the host [16,17] or to better understand bacterial virulence programs [18,19]. Several multi-omic studies have reported on the fact that, globally, there seems to be poor correlation between different data types (tran-scriptomic or proteomic for example) that are derived from the same gene [20–22]. Although expression heterogeneity (batch effects) can be an important driver of poor cross-class correla-tion, this lack of correlation is also likely due to the regulatory processes that determine abun-dance of each transcript and protein (e.g. transcription, translation, degradation, etc.). Lack of correlation may also be linked to the inherent differences in querying protein levels (2D gel electrophoresis and mass spectrometry) compared to transcript levels (microarray or RNA-seq) or in other aspects of experimental design [23].
JNA and KMW, HSHQPM-14-X-00238, Department of Homeland Security Predictive Virology projects,https://www.dhs.gov/. The funders had no role in study design, data collection and analysis, decision to publish, or preparation of the manuscript.
Competing interests: The authors have declared
Because–omics data tends to be large and complex a network approach that links features in omics datasets can be very useful in gaining a high level view of the system and identifying which features occupy positions of high centrality or which processes are co-regulated in a non-intuitive way. A number of methods exist for inferring networks based on correlation coefficient, mutual information, Bayesian probability, random forest analysis and regression analysis. Networks of related features have been made for transcriptomic analyses of pathogens [24,25], for proteome analyses [17,26] and for metabolomic or lipidomic analyses [27]. Such networks have been used to identify specific processes or pathways that may be responding in tandem across a range of conditions, providing insight into coordination and cross-talk in bio-logical systems as they respond to infection. They can also be used to identify genes of high importance to the organism under analysis [24,28,29], predict gene function [30–32] or iden-tify regulatory strategies of biological systems [33–35]. Networks focusing on pathogens have identified which genes may be specifically important to virulence [24,36] and other networks have been focused on expanding this approach further by querying not only the host or patho-gen but specifically interactions between these organisms [37–39].
As networks seek to model complex biological systems with a number of different molecu-lar features (e.g. transcripts, proteins, metabolites), the most accurate networks will be those that can incorporate multiple types of–omics data reporting on these molecules. The lack of apparent correlation between different–omics types (protein and transcript) described above has also emerged when networks of multiple data types are constructed. Despite this hurdle, approaches that effectively integrate data across different technological platforms and biomo-lecular classes are likely to become more important as multi-omics data becomes easier to gen-erate. Platforms such as mass-spectrometry and RNA-seq also result in missing values when molecules fall below an abundance threshold, and attempts have been made to develop meth-odologies to incorporate these data types when building networks using mutual information scores [40,41]. With the goal of creating improved integrated networks, we examine here a number of network inference tools using several types of–omics data (mainly transcriptomic and proteomic) and identify those inference tools that create the most integrated networks, defined as those having the maximum number of edges connecting different types of–omics data, termed cross-type edges. Previous studies have focused on ranking network inference methods based on accuracy and have found that GENIE3, a random forest method, created the best network in terms of its ability to link known regulator-target pairs inEscherichia coli
[42]. However, there has been no corresponding analysis that systematically ranks network inference methods by their ability to create integrated networks of transcripts and proteins. We perform this ranking here and find that, in most cases, GENIE3 is also the best inference method to create integrated networks of proteomic and transcriptomic data. We show that these networks, including the cross-type edges in the network, are accurate, and we use this approach to interrogate and compare networks inferred from data derived from antibody-mediated entry of Dengue virus into cells and from receptor-antibody-mediated entry. The methods presented here provide important guidance for constructing multi-omic networks represent-ing host responses to infection, and offer strategies for inferrrepresent-ing networks that can act as highly accurate and robust models of cellular systems.
Results
Networks of transcripts and proteins are highly segregated
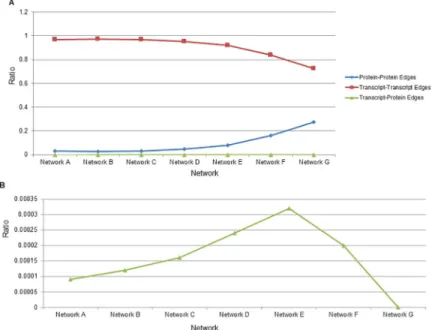
that transcripts showing changes in expression in response to infection were enriched for pro-cesses such as cytokine signaling, TLR signaling, phagosomes, viral carcinogenesis and response to infection (S1andS2Tables). Proteins showing changes in expression as a function of infection were enriched for some of the same pathways as well as regulation of the cytoskele-ton and antigen presentation (S3 Table). We also examined replicate and treatment variation between samples as part of a quality analysis of the Dengue dataset. Using an Adonis test we found that Treatments (virus infection, cell type, etc.) accounted for 23.6% of the differences between samples when proteins were examined and 40.7% of the differences when transcripts were examined with both of these results being statistically significant (p-value>0.001 for both tests). In contrast, replicates accounted for<3% of differences among samples when either proteins or transcripts were examined with neither of these results being significant (p -value of 0.858 and 0.981 respectively). Networks were then inferred for this dataset where tran-scripts and proteins were kept as separate nodes in the network. The same gene detected at the transcript or protein level is represented by two separate nodes in the network (though often a gene is only detected at either transcript or protein level, not both). This was done for two rea-sons: (1) a gene may show different expression levels as a transcript or as a protein due to post-transcriptional regulation. Combining transcript and protein levels may therefore give an inac-curate overall view of the gene’s expression level. (2) Within the cell transcripts and proteins exist simultaneously and may interact with each other and affect each other’s expression. To identify these putative interactions it will be necessary to also keep transcript and proteins as separate entities in a network. Initial networks using both proteins and transcripts as separate features in the network and Pearson correlation coefficient (PCC) as an association method resulted in an extremely low number of edges linking transcripts and proteins compared to those linking transcripts only or proteins only (S1 Fig,S4 Table). Using a PCC threshold of ~0.85 produced a network containing 100000 total edges and 5016 total nodes. Within this network, 97,396 edges (97.3%) connected two transcripts, 2592 (2.59%) connected two pro-teins and only 12 (0.012%) connected a protein and transcript (cross-type edges). This low number of cross-type edges persisted as additional Pearson thresholds examined, ranging from ~0.81 to ~0.96 and producing networks of 200000, 50000, 25000, 12500, 5000 and 2500 edges (Fig 1A and 1B). We next examined whether the differing scales and distributions of proteomic vs. transcriptomic data could be the cause of the lack of cross-type edges. Because of differences in the nature of microarrays compared to mass spectrometry and the downstream data analysis expression values for transcripts are generally far lower than expression values for proteins (S2A Fig). To artificially correct for this discrepancy, we multiplied all transcrip-tomic gene expression values by a factor of 2.6. This led to modified transcriptranscrip-tomic values that had a distribution and scale that was highly similar that seen with proteomic expression values (S2B Fig). However, when using these modified transcriptomic values, we found that there was no change in the number of cross-type edges inferred (S4 Table). This demonstrates that the differing scales and distributions of transcriptomic vs. proteomic data seen here are not the cause of the lack of cross-type edges and that other factors are at play.
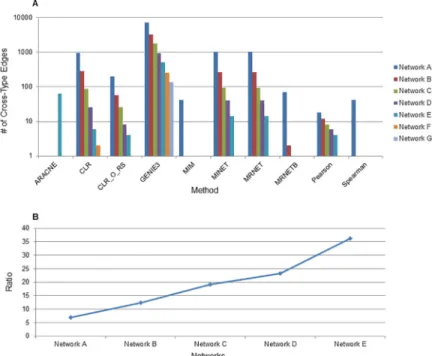
include correlation coefficient (Pearson and Spearman), mutual information (CLR, methods from the MINET package) and random forest (GENIE3) approaches. We specifically were interested in GENIE3 as it ranked as the top performer in the DREAM5 challenge and had been used in the past to infer networks of proteins and transcripts [23]. For each method we inferred seven different networks ranging in size from 200000 to 2500 edges to evaluate the performance of methods. Networks with the same letter designation (Networks A through G) are matched by size across inference methods. Network designations, the edge cutoffs used, the sizes of networks and the number of cross-type edges are shown inS4 Tableand .sif files for each network are included as a Supplementary Dataset. While a number of the mutual information based methods improved upon PCC in drawing cross-type edges, GENIE3, the random forest method, was by far the best method for creating integrated networks (Fig 2A). It was 6.9-fold better than the next best method (MINET, from the MINET package in R) when examining the largest networks. When examining small networks of 5000 edges it pro-duced 252 cross-type edges, compared to only two for CLR, one for PCC and zero for all other methods (S3 Fig,S4 Table). Similar to PCC, increasing the threshold used to define an edge to make it more stringent led to an increase in the ratio of cross-type edges to total edges. We also found that increasing the edge threshold led to an increase in the ratio of cross-type edges drawn by GENIE3 compared to those drawn by MINET (Fig 2B), at smaller network sizes GENIE3 has an even larger advantage over other network inference methods.
Jaccard similarity of network inference methods
As there were large differences in the ability of each method to infer cross-type edges, we next compared how much edge overlap there was between methods. Using networks of 5000 edges
Fig 1. Ratio of edges types by Pearson correlation coefficient to all existing edges of that type. (A) The network
letter is indicated on x-axis and the ratio of the number of edges of a particular type (either Transcript-Transcript, Protein-Protein, or Transcript-Protein) to the total number of edges of all types is shown on the y-axis. Network A is the largest and network G the smallest. Protein-Protein ratios are represented by blue diamonds, Transcript-Transcript ratios are represented by red squares and Cross-type edges (Transcript-Protein) are represented by green triangles. (B) Cross-type edge ratios are enlarged for ease of viewing. Network G inferred with Pearson had no cross-type edges so the resulting ratio is zero.
from each method we determined the overlap of identical edges between networks. Networks were compared using the Jaccard similarity of edges (the ratio of intersection of edges/union of edges).Fig 3shows the similarity of all network pairs of the 10 inference methods we tested, with green representing higher Jaccard similarity and red lower similarity. The composition of the GENIE3 network was closest to networks made using CLR from the MINET package and the original CLR algorithm using resampling (Methods). The Jaccard similarity of edges
Fig 2. Comparison of network inference method’s ability to generate cross-type edges. (A) Networks were made
with several different methods and edge cutoffs were chosen so that all networks of a particular letter are the same size across inference methods. The number of Cross-type edges for each network is shown on the y-axis and the methods on the x-axis. CLR_O_RS indicates the original CLR algorithm with resampling to distinguish it from the version of CLR used in the MINET package. The ARACNE method removes edges of low association as part of its methodology and thus only smaller networks containing high scoring edges are retained with ARACNE. (B) The fold increase in Cross-type edges inferred by the GENIE3 method compared to the MINET method (the next best method at creating Cross-type edges) is shown. For networks F and G MINET did not draw any Cross-type edges and so these ratios are not displayed.
https://doi.org/10.1371/journal.pcbi.1007241.g002
Fig 3. Comparisons of edge identity in networks. Overlap of identical edges is shown for all network inference
methods by calculating the Jaccard similarity of edges (the ratio of intersection of edges/union of edges) when comparing two networks. Green indicates higher similarity and red lower similarity. Inference methods were clustered and the resulting dendogram is shown on the left. CLR_O_RS indicates the original CLR algorithm with resampling to distinguish it from the version of CLR used in the MINET package.
comparing GENIE3 to these methods was 0.174 and 0.184 respectively. When examining the pattern of overlap between other algorithm pairs, two additional clusters emerge. The
MRNET, MINET, and ARACNE methods from the MINET package cluster together showing Jaccard similarity of approximately 0.42. Clustering with PCC is the Spearman correlation coefficient and two other methods from the MINET package, MIM and MRNETB, the average Jaccard similarity between these methods being 0.612. There are several clusters of methods that produce similar networks, but GENIE3 produces networks that have more unique edges distinct from networks produced by the other methods. Therefore, GENIE3 is able to detect cross-platform relationships that are not detected by other methods.
Quality of network edges
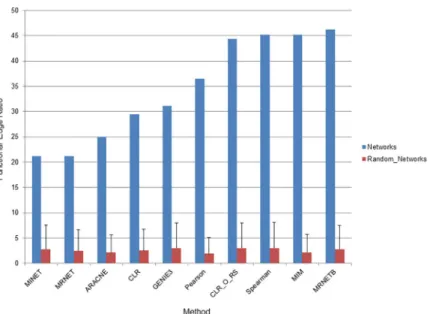
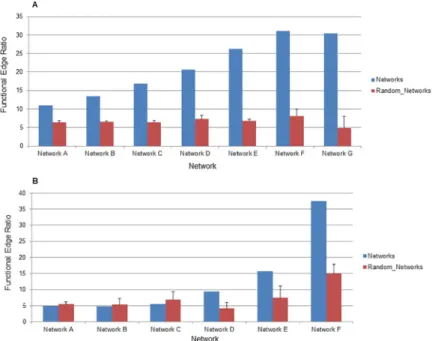
Because there is some variation in overlap of edges between methods (ratios range from 0.104 to 0.99), we next wanted to examine how accurate networks were to address the question, “are different network inference methods producing edges of different quality?” Quality of net-works can be difficult to assess as they generally provide far more information than has been experimentally verified. Previous studies have graded networks based on their ability to link known regulator-target pairs inE.coliand in this study GENIE3 emerged as the most accurate [42]. However, networks provide additional information beyond regulator-target pairs and we chose a wider metric based on linking genes in the same functional group. Here, we focus on the number of edges that connect two features that are in the same functional group as deter-mined using KEGG pathways [44,45]. Because there is such a large difference in the ability of each inference method to infer cross-type edges, we used only transcript-transcript edges for this analysis. This approach revealed that there was moderate variability between network inference methods (Fig 4). MRNETB had the highest quality network according to this metric with a functional edge ratio of 46.1%. MINET showed the lowest functional edge ratio at 21.2% while GENIE3 was near the middle with a functional edge ratio of 31.1%. As a baseline we also examined the quality of networks where the identity of all nodes had been randomized. All of the networks improved upon the randomization, which had a functional edge ratio clus-tered around 7.6±0.012%. Importantly, the method we identified as producing the greatest number of cross-type edges, GENIE3, produced edges of approximately the same quality as the other methods. This indicates that the significant improvement of GENIE3 in inferring cross-type edges does not come at the expense of network quality. This is consistent with prior studies using GENIE3 on bacterial systems, which have also found it to be highly accurate [42].
the functional edge ratio of cross-type edges specifically in networks inferred using GENIE3. This analysis showed that cross-type edges made by GENIE3 are of lower functional quality than transcript-transcript edges. However, they are still better than edges produced in ran-domized network at higher edge thresholds (Fig 5B) and are therefore providing relevant information regarding the co-expression of transcripts and proteins. It should be noted that this kind of analysis, examining the functional quality of cross-type edges across edge thresh-olds, is impossible with all other network inference methods tested here as they simply do not create enough cross-type edges (and in many cases do not create any such edges) for analysis.
Networks derived from permutations of the input data
Multiple biological factors including post-transcriptional regulation, different rates and mecha-nisms of RNA and protein degradation, as well as protein modifications contribute to differences in regulation of transcript abundance and protein abundance. However, specific properties of the data arising from the experimental approach used (microarray vs. mass spectrometry), with the distribution of the data, or with the missing values in one type of data also may be contributing to the observed low numbers of cross-type edges. To minimize differences among experimental platforms we next examined the effect of averaging biological replicates within the transcriptomic and proteomic datasets. We explored the effect of averaging in GENIE3 as well as in one repre-sentative of each of the three clusters we identified when interrogating network overlap (Fig 3), MINET, PCC and the original CLR_O_RS. In all network inference methods and at all edge threshold levels, we saw an increase in cross-type edges when replicates were averaged compared to being kept separate (Fig 6). PCC, MINET, and CLR showed the best overall improvement, far better than GENIE3, but this is likely because GENIE3 was already well-suited to drawing cross-type edges and there simply was little room for improvement. However, despite the increase in cross-type edges when replicates were averaged, the functional quality of these edges decreased
Fig 4. Quality of network inference methods. The ability of networks to connect features in the same functional
category was interrogated. The ratio of edges (as a percentage) connecting annotated features in the same functional category to all edges connecting annotated features is displayed on the y-axis. The network inference method is displayed on the x-axis. A network of 5000 edges was examined for each network inference method. Blue bars represent ratios of edges in the networks described here and red bars represent ratios of edges when all nodes in the network have been randomized. Error bars indicate standard deviation of ratios from three randomized networks. CLR_O_RS indicates the original CLR algorithm with resampling to distinguish it from the version of CLR used in the MINET package.
and, in the case of MINET, CLR_O_RS and GENIE3 networks, was no higher than a randomized network (S4 Fig). Averaging replicates also reduces the total number of edges in the network. On average, edge thresholds used to generate networks of the same size as those inferred when repli-cates were not averaged had to be lowered by 1.6-fold. The loss of input data that is seen when replicates are averaged likely makes it more difficult to draw meaningful edges between features, leading to generally smaller networks if the same edge threshold is used. Therefore, it seems that averaging replicates prior to inferring networks using multi-omic data is not recommended.
We also tested data that had been normalized to the mean of the row as well as fold change data when comparing to time matched mock infected samples. Normalizing by the mean of the row had no effect on network structure, which is not surprising since most of the inference methods used rely on assessing relative patterns of expression between features that will not be changed by mean normalization. When determining fold change values we normalized all abundance values to uninfected controls and as a result fewer samples were used to infer the network. Mock infected samples were not included as they were used to determine fold change values for infected samples. We also used only proteins with no missing values when determin-ing fold changes across conditions and samples. This smaller dataset contained 38 samples with abundance data for 5000 transcripts and 972 proteins. Because this dataset was different than that used above (it has fewer samples and fewer proteins) we re-inferred networks using abundance values from this smaller dataset as well as fold change values. We tested this dataset using GENIE3 as well as MINET and CLR, as they were the second and third best methods for creating integrated networks from our previous analyses. Interestingly, there was an increase in cross-type edges for both CLR and MINET when using this smaller dataset with abundance values. Despite these increases, GENIE3 was still the best method for inferring cross-type edges in this smaller dataset using abundance values (Fig 7,S4 Table). When using fold change values rather than abundance values all three methods inferred far fewer cross type
Fig 5. Quality of GENIE3 across increasing edge cutoffs. (A) The ratio of Transcript-Transcript edges (as a
percentage) connecting annotated features in the same functional category to all edges connecting annotated features is displayed on the y-axis. The network is displayed on the x-axis. Blue bars represent ratios of edges in the networks described here and red bars represent ratios of edges in randomized networks. Error bars indicate standard deviation of ratios from three randomized networks. (B) The same ratio is shown for Cross-type edges specifically.
edges. Using fold change data, GENIE3 and CLR were essentially equal in inferring cross-type edges with GENIE3 having slight advantage in very large (200000 edges) and very small (5000–2500 edges) networks and CLR having a slight advantage with medium sized (10000– 12500 edges) networks (Fig 7,S4 Table). Both CLR and GENIE3 were far better than MINET at inferring cross-type edges using fold change data.
Ranking of network inference methods using other biological datasets
The above data shows that GENIE3 is the best method for creating integrated networks when using data fromin vitrocell culture infections. We next wanted to see if this advantage held with other datasets drawn from different experimental setups and with other kinds of–omics
Fig 6. Effects of averaging replicates on cross-type edges. (A) The number of cross-type edges identified in the seven
networks using CLR (original algorithm with resampling) when replicates are averaged (blue bars) or kept separate (red bars). (B) Similar analysis with GENIE3, (C) Similar analysis with MINET, (D) Similar analysis with PCC.
https://doi.org/10.1371/journal.pcbi.1007241.g006
Fig 7. Effects of using fold change values on cross-type edges. (A) Using a smaller dataset of abundance values for
proteins and transcripts, networks were inferred using GENIE3 and cross-type edges determined for each network (blue bars). Similar networks were also inferred for fold change values using this same dataset (red bars). (B) The same analysis using CLR instead of GENIE3. (C) The same analysis using MINET instead of GENIE3.
data, namely lipidomics. To do so we tested other datasets with GENIE3 as well as MINET and CLR. We first tested another experiment looking at a different strain of Dengue virus
(DENV1) infecting the same cell type (U937). This experiment not only included transcrip-tomic data and proteomic data, as the DENV4 experiment used above did, but also lipidomic data. When looking at edges linking transcripts and proteins in this new dataset GENIE3 was again the highest performer, identifying 81 and 177 cross-type edges in 2500 edge and 5000 edge transcript-protein networks respectively compared to only 1 and 8 edges for CLR and only 1 edge in each network for MINET (S5 Fig). As this data included lipidomic data we next looked at cross-type edges in a network comprised of transcripts and lipids, here GENIE3 again performed the best, identifying 15 and 34 cross-type edges in 2500 edge and 5000 edge transcript-lipid networks respectively compared to only 1 and 13 for CLR and 3 and 14 for MINET (S5 Fig). Finally, we also looked at a network comprised of proteins and lipids. Here, the advantages of GENIE3 are not as apparent, MINET performs slightly better, though both are better than CLR. GENIE was able to infer 53 and 166 edges compared to 62 and 188 edges for MINET (CLR inferred 2 and 28 edges) (S5 Fig). We next examined other datasets that were different from infection of cells with a virusin vitro. We examined two datasets looking at
in vivoinfection of mice with influenza virus. With both of these datasets GENIE3 was again, by far, the best method for inferring cross type edges (S6 Fig). In addition, we examined both of these datasets specifically looking at the functional edge overlap of cross-type edges. We found, similar to our analysis of Dengue data (Fig 5B), that the functional edge overlap of cross-type edges from networks of this influenza data are significantly higher than that seen in a random-ized network (S7 Fig). The fact that we see this across multiple datasets from very different experiments (human vs. mouse,in vitrovs.in vivo, various pathogens, etc.) indicates cross-type edges contain biologically relevant data and that this is true across multiple disparate datasets. We also examined another mouse dataset looking atin vivoinfection with West Nile Virus (WNV). Again, with this dataset GENIE3 was the best at inferring cross-type edges (S6 Fig). Finally, we also examined a dataset comprised of transcriptomic and proteomic analysis of ovar-ian cancer tumors [22]. Here, each tumor represented a unique condition and we chose the 2000 random proteins with the highest variability across tumor samples based on standard devi-ation. We then combined this dataset with the cognate transcripts matching these proteins for which we had data (a total of 1641 transcripts). With this dataset we found that, across network sizes, there was no significant advantage in using GENIE3, CLR, or MINET regarding cross-type edges. With very large networks (200000 edges) GENIE3 was very similar to MINET and both were slightly superior to CLR. With the smallest network examined (2500 edges) CLR and MINET were slightly superior to GENIE3 with MINET and CLR each inferring about ~500 cross-type edges for this network compared to 347 for GENIE3 (S6 Fig). There were also far more cross-type edges inferred with this data set with ~22% of edges linking a protein and a transcript when examining large networks (200000 edges) and ~7% when examining small (5000–2500 edges) networks. While this may have been affected by including a large number of protein-transcript cognate pairs from the same gene, a similar analysis using 2000 random pro-teins and 2000 random transcripts also found a higher number of cross-type edges, ~20%. This is in contrast to networks examining Dengue infection where only ~3% of the edges were cross-type in a large network inferred with GENIE3 and ~5% were cross-cross-type in a small network.
Network analysis of antibody-mediated versus receptor-mediated Dengue
infection
transcriptomic data we applied this approach to comparison of networks derived from recep-tor-mediated Dengue virus infection and antibody-mediated Dengue virus infection. Studies of DENV3 using multiplicities of infection similar to those used here have shown that Dengue virus can benefit from antibody dependent enhancement during infection. Non-neutralizing monoclonal antibodies against Dengue virus already present in the host can increase invasion of this virus into cells of the immune system including monocytes, dendritic cells and macro-phages [46–48]. Infection by the antibody-mediated route can also lead to more serious disease development with increased suppression of host antiviral response [46]. Because of these dif-ferences in viral entry into the cell and subsequent changes in disease we examined networks inferred using only data from Dengue infection via an antibody-mediated route and compared that to a network inferred using only data from Dengue infection via a receptor-mediated route. Both transcriptomic and proteomic data was used to infer integrated networks contain-ing 5000 edges uscontain-ing GENIE3, one for antibody-mediated infection data and one for receptor-mediated infection data.
what degree, cross-type edges can aid in the biological interpretation of networks and what they can show about response of hosts to pathogens or to other stress conditions.
Based on previous analysis of these features they are likely involved in anti-inflammatory pathways as they are downregulated when T cells proliferate upon being stimulated with IL-4 and GM-CSF [51]. As centrality is a measure of importance, the more central position of these features in an antibody-mediated entry network suggests that this route of infection for the virus may lead to downregulation of innate immune pathways and lead to the more enhanced disease outcome seen with antibody-mediated vs. receptor-mediated entry. Other studies have also identified an upregulation of anti-inflammatory cytokines when antibody-mediated entry is undertaken by Dengue [48,52].
Discussion
The lack of integration in networks comprised of multiple–omics types can be a serious hin-drance to using these networks as accurate, robust and predictive models of biological systems. Usingin vitroinfection data, we show here that GENIE3, a random forest based method, gen-erates, by far, the most integrated networks of ten inference methods tested. This integration does not come at the cost of edge quality as GENIE3 performs as well as other methods at link-ing features of similar functional roles. Network analysis is a powerful way to view complex systems such as host-pathogen interactions. Using GENIE3, we built integrated networks of data derived from an antibody-mediated Dengue infection experiment and a receptor-medi-ated Dengue infection experiment and highlight innate immune pathways that are different between networks representing both viral entry mechanisms.
Despite these challenges and the small number of cross-type edges, GENIE3 does emerge as the best method for inferring integrated networks, specifically of proteomic and transcrip-tomic data. One of the reasons for this may be the fact that, unlike the other nine methods used, GENIE3 relies on a random forest approach to generate networks. Random forest is an ensemble method that can combine strengths of many weak signals to build better models, and is therefore likely more sensitive to biological signals. It is also able to work with different types of input data and does not require linear relationships between features to establish edges (though this quality is shared by several other methods we examined). Another possible advantage of GENIE3 may lie in its ability to handle values of zero supplied as a substitute for missing values in protein data. When networks were inferred with no missing values for any protein under any condition both CLR and MINET were able to infer more cross-type edges compared to a dataset containing proteins with missing values in some of the conditions. However, GENIE3 was not affected by this difference in the dataset suggesting that this approach may also be especially useful when inferring networks from datasets with missing values, a common feature of proteomic data.
Another observation of interest that emerged from these studies was the functional quality of GENIE3 networks and how this accuracy changes as a function of edge cutoff; smaller, more stringent networks are more accurate than larger networks. This increase in network accuracy among smaller networks was also seen when CLR_O_RS and MINET were used. While all of the networks used here, aside from those that averaged replicates, showed higher accuracy compared to a randomized network, if edge cutoffs are increasingly made less strin-gent, a point will eventually be reached where the functional edge ratio is no higher than a ran-domized network. Examining networks made by GENIE3 suggests that this point will be reached with a network of 371535 edges (representing the top 0.77% of all possible edges). The choice of edge threshold is somewhat arbitrary but our analysis suggests that there is a hard lower limit to network size if quality is to be maintained. While making edge threshold less stringent always leads to larger networks, defining a “floor” will help researchers reach a bal-ance between the maximum number of edges and networks of the best quality.
a relatively short time frame. However, since all of the methods are compared across the same datasets if autocorrelation is present it would affect all network inference methods equally.
The advantages of GENIE3 may be less useful when examining multi-omics data from dif-ferent experimental setups, specificallyin vivodatasets or multi-omic data where both–omics types are drawn from a mass-spectrometry technology. Here, multi-omics data from short term,in vitro, time course experiments led to far fewer cross-type edges compared to clinical data collected directly from patients. There are likely many reasons for this but it may be related to the high amount of sampling duringin vitroexperiments compared to clinical data, within vitroexperiments collecting several samples over a matter of hours rather than over weeks or months as is often the case with clinical data. This increased sampling, used with in vitro experiments, may capture cell responses as they are initially responding to stress pertur-bations with many regulatory signals happening over a short time frame and leading to more discrepancies between cognate transcript-protein pairs. The resulting paucity of cross-type edges amplified the advantage of GENIE3, making this method the only choice for this data type in creating networks with a significant number of cross-type edges. In contrast, data col-lected from clinical experiments is over a much longer time frame or, in some cases, only a sin-gle sample is collected. In this second case regulatory pathways controlling transcript and protein expression may have more time to converge, leading to more correlation in the expres-sion and regulation of cognate transcript-protein pairs, more cross-type edges and the option of using other network inference tools. It may also be that uniform nature and response of cells used inin vitroinfection experiments may expose and amplify differences between pro-teins and transcripts. In contrast, samples collected from patients and tumors are a mixture of cell types and responses, which may smooth out inherent differences between transcripts and proteins and lead to more cross-type edges. It is also possible that autocorrelation, which exists in many of thein vitrodatasets examined here but not thein vivotumor sets may also contrib-ute to the larger number of cross-type edges seen with GENIE3. When examining such clinical data, GENIE3 is no better or worse with regard to cross-type edges than other methods of inferring networks such as CLR and MINET. It should be noted that all three of these methods are still superior to correlation based methods such as Spearman or Pearson. GENIE3 and MINET also find approximately the same number of cross-type edges when examining a proteomic-lipidomic dataset. The fact that a similar result emerges with these two methods only when examining proteomic- lipidomic data, and not proteomic-transcriptomic data or lipidomic-transcriptomic data, suggests that the advantages of GENIE3 may be in linking multi-omic data across different methodological platforms. When one kind of multi-omic data comes from a mass spectrometry platform and one kind comes from a microarray plat-form (such as proteomic-transcriptomic data or lipidomics-transcriptomic) GENIE3 is by far the best option. However, when both–omics types come from a mass spectrometry platform (such as proteomic-lipidomic) then MINET is able to identify slightly more cross-type edges compared to GENIE3. This suggests that when examining two–omics types that are both mass spectrometry based (proteomics, lipidomics, metabolomics, phospho-proteomics) MINET may be another viable option. It is important to note however that GENIE3 was able to infer a higher functional edge overlap than MINET and thus may be more accurate.
using network approaches to examine other aspects of viral infections these experiments pro-vide some of the first systematic ranking of methods used to create integrated networks and lay out strategies for how to infer them and which specific methods to use.
Methods
Cells and viruses
Viruses were propagated in C6/36Aedes albopictuscells grown in minimal essential medium (Gibco, Grand Island, NY) at 32˚C. U937 cells were transfected with a lentivirus vector expressing DC-SIGN, or passaged in parallel, and sorted by FACS. U937 and U937+DC-SIGN cells were maintained in RPMI-1640 (Gibco) at 37˚C. Growth media were supplemented with 5% fetal bovine serum (HyClone, Logan, UT), 0.1 mM nonessential amino acids (Gibco), 100 U/ml penicillin and 100 mg/ml streptomycin (Gibco). U937 and U937+DC-SIGN media was supplemented with 2 mM GlutaMAX (Gibco), 10mM HEPES (Cellgro, Manassas, VA). U937 +DC-SIGN media included 2-mercaptoethanol (Sigma, St Louis, MO). All infection media contained 2% fetal bovine serum. Cells were incubated in the presence of 5% CO2.
Infectious clones of wild-type strains were constructed using a quadripartite cDNA clone. The DENV4 (Sri Lanka 92) strain was used in the present study. Full-length cDNA was tran-scribed into genome-length RNAs using T7 polymerase and recombinant viruses isolated in C6/36 cells as previously described. Virus was then passaged twice on C6/36 cells, centrifuged to remove cellular debris, and stored at−80˚C as a working stock.
In vitro experiments
Fc receptor and DC-SIGN mediated entry were titered, and at 24 hours post-infection, condi-tions were optimized to obtain 60% infection for both entry mechanisms. Each experiment had five infection conditions: U937+DC-SIGN mock infected, U937+DC-SIGN DENV infected, U937 mock infected, U937 DENV+Ab infected and U937 DENV + Ab isotype con-trol (a concon-trol condition for Ab-mediated infection). Each condition was examined under four timepoints (2, 8, 16 and 24 hours post-infection). Each timepoint for each condition was examined with five replicates with a few exceptions, four replicates were collected for the fol-lowing conditions/timepoints: 2 hours post-infection U937+DC-SIGN mock infected, 8 hours post-infection U937+DC-SIGN mock infected, 2 hours post-infection U937 DENV+Ab infected, 24 hours post-infection U937 DENV+Ab infected and 2 hours post-infection U937 DENV + Ab isotype control. With all conditions, timepoints and replicates there were 95 data points comprising this dataset. The virus:antibody/mock mixtures were incubated for 45 min-utes in 12-well plates at 37˚C. Following this incubation, 1x10⁶U937 or U937+DC-SIGN cells were added and the infection was allowed to proceed for 2 hours at 37˚C. The 2 hour time point was collected, and the rest of the cells were centrifuged for 2 minutes at 450XG and resuspended in fresh infection media. The collection timepoints were 2, 8, 16, and 24 hours post infection. Cells were initially grown and then placed into separate wells for infection assays, with RNA and protein being collected from cells in different wells. For each timepoint cells collected for RNA were pelleted and resuspended in TRIzol. Cells collected for proteomics were filtered, washed twice with sterile PBS, pelleted and dried. Samples were stored at -80˚C until processed.
Transcriptomic analysis
array. Total RNA from each sample was quantified using the NanoDrop ND-1000 and RNA integrity was assessed by standard denaturing agarose gel electrophoresis. For microarray anal-ysis, the Agilent Array platform was employed. The sample preparation and microarray hybridization were performed based on the manufacturer’s standard protocols. Briefly, total RNA from each sample was amplified and transcribed into fluorescent cRNA using the manu-facturer’s Agilent’s Quick Amp Labeling protocol (version 5.7, Agilent Technologies). The labeled cRNAs were hybridized onto the Whole Human Genome Oligo Microarray (4 x 44K, Agilent Technologies). After washing the slides, the arrays were scanned by the Agilent Scan-ner G2505C.
Analysis of transcriptomic data
Background correction was carried out on microarray samples using the maximum likelihood estimation for the normal-exponential convolution model [57], with an offset of 50, as imple-mented in Bioconductor’s [58]limmapackage [59]. Samples were then normalized using quantile normalization so that the entire empirical distribution of each column was identical, this includes log2-transformation of the data. Outliers among samples were detected using intensity distribution and a boxplot graph followed by hierarchical clustering and PCA analy-sis of expression profiles using theMVApackage [60]. Any sample that did not visually cluster with other samples of the same condition was removed. For this dataset, only one sample was removed as a result of outlier detection, 1 replicate of the U937 DENV+Ab 24 hour timepoint. To identify differentially expressed probes, we use Bioconductor’slimmapackage [59], which calculates a p-value based on a moderated t-statistic (recommended for experiments with small sample sizes) and then adjusts it to correct for the effects of multiple hypothesis testing. To adjust the p-value, we use the method of Benjamini and Hochberg [61] that controls the false discovery rate (FDR orq-value).
Proteomics sample processing and analysis
WI). Briefly, the columns were conditioned with 3 mL methanol followed by 2 mL of 0.1% tri-fluoroacetic acid (TFA). After the samples were loaded on the columns, they were rinsed with 4 mL of 95:5 water:acetonitrile with 0.1% TFA. The columns were allowed to dry, after which the samples were eluted with 1 mL of 80:20 acetonitrile:water with 0.1% TFA. The samples were concentrated using a Speed Vac (ThermoFisher Scientific, Waltham, MA) to 50 uL and a final BCA protein assay was performed to quantitate the peptide mass. The samples were diluted to 0.1 ug/uL in water for analysis by LC-MS/MS.
Analysis consisted of reverse-phase LC-MS/MS using Waters nano-Acquity M-Class dual pumping UPLC system (Milford, MA) configured for online trapping and interfaced with a Q-Exactive Plus hybrid quadrupole/Orbitrap mass spectrometer (Thermo Scientific, San Jose, CA). Both trapping and analytical columns were packed in-house using 360μm o.d. fused sil-ica (Polymicro Technologies Inc., Phoenix, AZ) with 1-cm sol-gel frits for media retention and contained Jupiter C18 media (Phenomenex, Torrence, CA) in 5μm particle size for the trap-ping column (150μm i.d. x 4 cm long) and 3μm particle size for the analytical column (75μm i.d. x 70 cm long). A 5μL injection at 5μL/min was loaded onto trapping column and eluted by reverse direction elution onto the analytical column at 300 nL/min. Mobile phases consisted of (A) 0.1% formic acid in water and (B) 0.1% formic acid in acetonitrile with the following gradient profile (min, %B): 0, 1; 2, 8; 20, 12; 75, 30; 97, 45; 100, 95; 105, 95; 110, 1; 140, 1. The analytical column was coupled to the mass spectrometer with a home built nano-electrospray ionization interface. Electrospray emitters were chemically etched in-house using 150 um o.d. x 20 um i.d. fused silica. The mass spectrometer inlet was maintained at a temperature of 350˚C and spray voltage was at 2.2kV. Data were collected for 100 min following a 20 min delay from sample injection. A precursor FT-MS scan was performed from 400–2000 m/z at a resolution of 35k (AGC target 3e6) and the top 12 FT-HCD-MS/MS spectra were acquired in data dependent mode with an isolation window of 2.0 m/z and at a resolution of 17.5k (AGC target 1e5) using a normalized collision energy of 30 and a 30 sec exclusion time.
Analysis of proteomics data
The initial dataset contained 100 LC-MS instrument runs associated with 100 unique cal samples and 41,947 unique peptides that had at least 2 observations across the 100 biologi-cal samples. This corresponded to 5,705 proteins of which 5,699 were human and 6 were viral. The algorithm RMD-PAV [62] was used to identify any outlier biological samples, of which 4 were identified (one replicate each from the control for the receptor-mediated Dengue virus infection at the 2hr and 8hr timepoint, one replicate from the control for the ated Dengue virus infection at the 2hr timepoint and one replicate from the antibody-medi-ated Dengue virus infection at the 2hr timepoint) and confirmed via Pearson correlation. Peptides with inadequate data for either qualitative or quantitative statistical tests were also removed from the dataset [63], resulting in a final dataset ready for normalization that included 96 unique biological samples and 29,694 measured unique peptides corresponding to 4,333 proteins (4,333 human/0 viral). SPANS was used and selected L Order Statistics (LOS) median centering [64] with a parameter of 0.2 for normalization.
to mock. BP-Quant was run with a default parameter of 0.9. All proteins were then analyzed using the same methodology as for the peptides; ANOVA with a Dunnett test correction and a Bonferroni-corrected g-test to compare each virus to the associated mock within each time point.
Network analysis
For Dengue-derived networks 5000 human transcripts that were differentially regulated (>2-fold change,q-value<0.05) when comparing virus to time-matched mock samples were selected. We also chose 1930 human proteins that were differentially regulated (>2-fold change,q-value<0.05) and had missing values in no more than half of the samples examined. Missing values that were present in the protein dataset were replaced with “0” to allow compat-ibility with all network inference methods. The complete Dengue dataset consisted of 6930 fea-tures examined under 20 conditions with either four or five biological replicates queried for each condition, a total of 95 columns of data.
Networks were inferred using 10 feature association metrics that were chosen based on sev-eral criteria. We chose to use methods that had been used in the past to infer networks [23,66–
mice with influenza (GEO Accession numbers GSE68946 and GSE71759) and a dataset exam-ining tumor samples from cancer patients [22].
To compare how well networks agreed with known data and how accurate they were, we compared the ability of networks to draw edges between features within the same functional category. Annotation of features (transcripts and proteins) was obtained from the KEGG data-base data-based on the Molecular Signatures Datadata-base (MSigDB) [44,45]. Ratios were determined for edges connecting two annotated features in the same functional category/all edges connect-ing two annotated features with these ratios expressed as a percentage. This ratio can range from 0% (no edges connecting annotated genes are those connecting genes in the same func-tional category) to 100% (all edges connecting annotated genes are those connecting genes in the same functional category) and is referred to as the functional edge ratio, a higher functional edge ratio means more edges linked features in the same functional category and the network is more accurate. When randomizing networks for this comparison an identical node-degree distribution was used and only the identity of the individual nodes was shuffled.
Supporting information
S1 Fig. Transcript-protein network made with Pearson correlation coefficient. Using a PCC cutoff of ~0.85 a network of 100000 edges and 5016 nodes was generated. Proteins in the network are colored red and transcripts green. Some small, unconnected clusters of transcripts or proteins have been removed.
(PDF)
S2 Fig. Boxplot of transcriptomic and proteomic value distributions. (A) Boxplot showing distributions of transcriptomic and proteomic data. (B) Boxplot showing matched distribu-tions of transcriptomic and proteomic data after multiplying all transcriptomic gene expres-sion values by a factor of 2.6.
(PDF)
S3 Fig. Small networks of Pearson correlation, CLR and GENIE3. Networks of 5000 edges were generated using (A) Pearson correlation, (B) CLR and (C) GENIE3. Proteins in the net-work are colored red and transcripts green. Some small, unconnected clusters of transcripts or proteins have been removed.
(PDF)
S4 Fig. Accuracy of network inference methods using averaged replicates. The ratio of type edges connecting annotated features in the same functional category to all cross-type edges connecting annotated features is displayed on the y-axis. The network is displayed on the x-axis. Blue bars represent networks made with GENIE3, red bars represent networks made with CLR (original algorithm with resampling) and green bars represent networks made with MINET. Networks 5, 6 and 7 made using CLR had no cross-type edges with functional annotation and Networks 6 and 7 made using MINET had no cross-type edges with functional annotation so these bars are not displayed.
(PDF)
data from infection of human cells with Dengue D1 virus. (C) A similar analysis as in (A) but looking at lipidomic-transcriptomic data from infection of human cells with Dengue D1 virus. (PDF)
S6 Fig. Comparison of network inference method’s ability to generate cross-type edges in other datasets. (A) Using proteomic and transcriptomic data from infection of mice with Influenza virus (GEO Accession number GSE68946) networks were made with three different methods and edge cutoffs were chosen so that all networks of a particular number are the same size across inference methods. The number of Cross-type edges for each network are shown on the y-axis and the methods on the x-axis. (B) A similar analysis as in (A) but using a different data set examining infection of mice with influenza virus (GEO Accession number GSE71759). (C) A similar analysis as in (A) but using proteomic and transcriptomic data from mice infected with West Nile Virus (WNV). (D) A similar analysis as in (A) but using proteo-mic and transcriptoproteo-mic data human ovarian tumor samples.
(PDF)
S7 Fig. Functional edge overlaps for mouse influenza networks. (A) Functional edge overlap of cross-type edges in networks inferred from infection of mice with Influenza virus (GEO Accession number GSE68946). Blue bars represent ratios of edges in the networks described here and red bars represent ratios of edges in randomized networks. Error bars indicate stan-dard deviation of ratios from three randomized networks. (B) A similar analysis as in (A) but using a different data set examining infection of mice with influenza virus (GEO Accession number GSE71759).
(PDF)
S1 Table. Functional enrichment of transcripts showing differential expression in Dengue virus infected cells vs. mock infected cells at 24 hours post-infection.
(XLSX)
S2 Table. Functional enrichment of transcripts showing differential expression in anti-body-mediated Dengue virus infected cells vs. mock infected cells at 24 hours post-infec-tion.
(XLSX)
S3 Table. Functional enrichment of proteins showing differential abundance in antibody-mediated Dengue virus infected cells vs. mock infected cells at 24 hours post-infection. (XLSX)
S4 Table. Edge cutoffs, network sizes and number of cross type edges for all networks. (XLSX)
S5 Table. KEGG functions showing differential centrality in an antibody-mediated net-work versus a receptor-mediated netnet-work built from transcriptomic and proteomic data. (XLSX)
S6 Table. KEGG functions showing differential centrality in an antibody-mediated net-work versus a receptor-mediated netnet-work built only from transcriptomic data.
(XLSX)
Author Contributions
Formal analysis: Ryan S. McClure, Jason P. Wendler, Jason E. McDermott.
Funding acquisition: Joshua N. Adkins, Katrina M. Waters.
Investigation: Ryan S. McClure, Jesica Swanstrom, Ralph Baric.
Methodology: Ryan S. McClure, Jason P. Wendler, Jesica Swanstrom, Ralph Baric, Kristie L. Oxford, Katrina M. Waters, Jason E. McDermott.
Project administration: Joshua N. Adkins, Brooke L. Deatherage Kaiser, Katrina M. Waters.
Supervision: Jason E. McDermott.
Writing – original draft: Ryan S. McClure.
Writing – review & editing: Ryan S. McClure, Jason P. Wendler, Joshua N. Adkins, Jesica Swanstrom, Ralph Baric, Brooke L. Deatherage Kaiser, Kristie L. Oxford, Katrina M. Waters, Jason E. McDermott.
References
1. Oxford KL, Wendler JP, McDermott JE, White Iii RA, Powell JD, Jacobs JM, et al. The landscape of viral proteomics and its potential to impact human health. Expert review of proteomics. 2016; 13 (6):579–91.https://doi.org/10.1080/14789450.2016.1184091PMID:27133506.
2. Aevermann BD, Pickett BE, Kumar S, Klem EB, Agnihothram S, Askovich PS, et al. A comprehensive collection of systems biology data characterizing the host response to viral infection. Scientific data. 2014; 1:140033.https://doi.org/10.1038/sdata.2014.33PMID:25977790; PubMed Central PMCID: PMC4410982.
3. Flori L, Rogel-Gaillard C, Cochet M, Lemonnier G, Hugot K, Chardon P, et al. Transcriptomic analysis of the dialogue between Pseudorabies virus and porcine epithelial cells during infection. BMC geno-mics. 2008; 9:123.https://doi.org/10.1186/1471-2164-9-123PMID:18331636; PubMed Central PMCID: PMC2335119.
4. McClure R, Nudel K, Massari P, Tjaden B, Su X, Rice PA, et al. The Gonococcal Transcriptome during Infection of the Lower Genital Tract in Women. PloS one. 2015; 10(8):e0133982.https://doi.org/10.
1371/journal.pone.0133982PMID:26244506.
5. Villalba M, Fredericksen F, Otth C, Olavarria V. Transcriptomic analysis of responses to cytopathic bovine viral diarrhea virus-1 (BVDV-1) infection in MDBK cells. Molecular immunology. 2016; 71:192–
202.https://doi.org/10.1016/j.molimm.2016.01.009PMID:26919728.
6. Mendez JA, Mateos J, Beceiro A, Lopez M, Tomas M, Poza M, et al. Quantitative proteomic analysis of host—pathogen interactions: a study of Acinetobacter baumannii responses to host airways. BMC genomics. 2015; 16:422.https://doi.org/10.1186/s12864-015-1608-zPMID:26025090; PubMed Cen-tral PMCID: PMC4449591.
7. Pitarch A, Nombela C, Gil C. Proteomic profiling of serologic response to Candida albicans during host-commensal and host-pathogen interactions. Methods in molecular biology. 2009; 470:369–411.https://
doi.org/10.1007/978-1-59745-204-5_26PMID:19089396.
8. Zhu SL, Chen X, Wang LJ, Wan WW, Xin QL, Wang W, et al. Global quantitative proteomic analysis profiles host protein expression in response to Sendai virus infection. Proteomics. 2017;17(5).https://
doi.org/10.1016/j.jprot.2017.12.010PMID:29275045.
9. Antunes LC, Arena ET, Menendez A, Han J, Ferreira RB, Buckner MM, et al. Impact of salmonella infection on host hormone metabolism revealed by metabolomics. Infection and immunity. 2011; 79 (4):1759–69.https://doi.org/10.1128/IAI.01373-10PMID:21321075; PubMed Central PMCID: PMC3067560.
10. Nguyen CT, Shetty V, Maresso AW. Global metabolomic analysis of a mammalian host infected with Bacillus anthracis. Infection and immunity. 2015; 83(12):4811–25.https://doi.org/10.1128/IAI.00947-15 PMID:26438791; PubMed Central PMCID: PMC4645395.
11. Jain M, Petzold CJ, Schelle MW, Leavell MD, Mougous JD, Bertozzi CR, et al. Lipidomics reveals con-trol of Mycobacterium tuberculosis virulence lipids via metabolic coupling. Proceedings of the National Academy of Sciences of the United States of America. 2007; 104(12):5133–8.https://doi.org/10.1073/
12. Lorizate M, Sachsenheimer T, Glass B, Habermann A, Gerl MJ, Krausslich HG, et al. Comparative lipi-domics analysis of HIV-1 particles and their producer cell membrane in different cell lines. Cellular microbiology. 2013; 15(2):292–304.https://doi.org/10.1111/cmi.12101PMID:23279151.
13. Saquib NM, Jamwal S, Midha MK, Verma HN, Manivel V. Quantitative Proteomics and Lipidomics Anal-ysis of Endoplasmic Reticulum of Macrophage Infected with Mycobacterium tuberculosis. International journal of proteomics. 2015; 2015:270438.https://doi.org/10.1155/2015/270438PMID:25785198; PubMed Central PMCID: PMC4345262.
14. Kocharunchitt C, King T, Gobius K, Bowman JP, Ross T. Integrated transcriptomic and proteomic anal-ysis of the physiological response of Escherichia coli O157:H7 Sakai to steady-state conditions of cold and water activity stress. Molecular & cellular proteomics: MCP. 2012; 11(1):M111 009019.https://doi.
org/10.1074/mcp.M111.009019PMID:22008207; PubMed Central PMCID: PMC3270098.
15. Dapat C, Oshitani H. Novel insights into human respiratory syncytial virus-host factor interactions through integrated proteomics and transcriptomics analysis. Expert review of anti-infective therapy. 2016; 14(3):285–97.https://doi.org/10.1586/14787210.2016.1141676PMID:26760927; PubMed Cen-tral PMCID: PMC4819838.
16. Diamond DL, Syder AJ, Jacobs JM, Sorensen CM, Walters KA, Proll SC, et al. Temporal proteome and lipidome profiles reveal hepatitis C virus-associated reprogramming of hepatocellular metabolism and bioenergetics. PLoS pathogens. 2010; 6(1):e1000719.https://doi.org/10.1371/journal.ppat.1000719 PMID:20062526; PubMed Central PMCID: PMC2796172.
17. McDermott JE, Diamond DL, Corley C, Rasmussen AL, Katze MG, Waters KM. Topological analysis of protein co-abundance networks identifies novel host targets important for HCV infection and pathogen-esis. BMC systems biology. 2012; 6:28.https://doi.org/10.1186/1752-0509-6-28PMID:22546282; PubMed Central PMCID: PMC3383540.
18. Ansong C, Schrimpe-Rutledge AC, Mitchell HD, Chauhan S, Jones MB, Kim YM, et al. A multi-omic systems approach to elucidating Yersinia virulence mechanisms. Molecular bioSystems. 2013; 9 (1):44–54.https://doi.org/10.1039/c2mb25287bPMID:23147219; PubMed Central PMCID: PMC3518462.
19. Yoon H, Ansong C, McDermott JE, Gritsenko M, Smith RD, Heffron F, et al. Systems analysis of multi-ple regulator perturbations allows discovery of virulence factors in Salmonella. BMC systems biology. 2011; 5:100.https://doi.org/10.1186/1752-0509-5-100PMID:21711513; PubMed Central PMCID: PMC3213010.
20. Payne SH. The utility of protein and mRNA correlation. Trends in biochemical sciences. 2015; 40(1):1–
3.https://doi.org/10.1016/j.tibs.2014.10.010PMID:25467744; PubMed Central PMCID: PMC4776753.
21. Waters KM, Liu T, Quesenberry RD, Willse AR, Bandyopadhyay S, Kathmann LE, et al. Network analy-sis of epidermal growth factor signaling using integrated genomic, proteomic and phosphorylation data. PloS one. 2012; 7(3):e34515.https://doi.org/10.1371/journal.pone.0034515PMID:22479638; PubMed Central PMCID: PMC3315547.
22. Zhang H, Liu T, Zhang Z, Payne SH, Zhang B, McDermott JE, et al. Integrated Proteogenomic Charac-terization of Human High-Grade Serous Ovarian Cancer. Cell. 2016; 166(3):755–65.https://doi.org/10.
1016/j.cell.2016.05.069PMID:27372738; PubMed Central PMCID: PMC4967013.
23. Walley JW, Sartor RC, Shen Z, Schmitz RJ, Wu KJ, Urich MA, et al. Integration of omic networks in a developmental atlas of maize. Science. 2016; 353(6301):814–8.https://doi.org/10.1126/science.
aag1125PMID:27540173.
24. McDermott JE, Taylor RC, Yoon H, Heffron F. Bottlenecks and hubs in inferred networks are important for virulence in Salmonella typhimurium. Journal of computational biology: a journal of computational molecular cell biology. 2009; 16(2):169–80.https://doi.org/10.1089/cmb.2008.04TTPMID:19178137.
25. Zheng ZL, Zhao Y. Transcriptome comparison and gene coexpression network analysis provide a sys-tems view of citrus response to ’Candidatus Liberibacter asiaticus’ infection. BMC genomics. 2013; 14:27.https://doi.org/10.1186/1471-2164-14-27PMID:23324561; PubMed Central PMCID: PMC3577516.
26. Drozdov I, Didangelos A, Yin X, Zampetaki A, Abonnenc M, Murdoch C, et al. Gene network and proteo-mic analyses of cardiac responses to pathological and physiological stress. Circulation Cardiovascular genetics. 2013; 6(6):588–97.https://doi.org/10.1161/CIRCGENETICS.113.000063PMID:24214729.
27. Kotze HL, Armitage EG, Sharkey KJ, Allwood JW, Dunn WB, Williams KJ, et al. A novel untargeted metabolomics correlation-based network analysis incorporating human metabolic reconstructions. BMC systems biology. 2013; 7:107.https://doi.org/10.1186/1752-0509-7-107PMID:24153255; PubMed Central PMCID: PMC3874763.
data. Disease markers. 2010; 28(4):253–66.https://doi.org/10.3233/DMA-2010-0695PMID: 20534910; PubMed Central PMCID: PMC3833603.
29. Song HS, McClure RS, Bernstein HC, Overall CC, Hill EA, Beliaev AS. Integrated in silico Analyses of Regulatory and Metabolic Networks of Synechococcus sp. PCC 7002 Reveal Relationships between Gene Centrality and Essentiality. Life. 2015; 5(2):1127–40.https://doi.org/10.3390/life5021127PMID: 25826650.
30. Gillis J, Pavlidis P. "Guilt by association" is the exception rather than the rule in gene networks. PLoS computational biology. 2012; 8(3):e1002444.https://doi.org/10.1371/journal.pcbi.1002444PMID: 22479173; PubMed Central PMCID: PMC3315453.
31. Klie S, Nikoloski Z, Selbig J. Biological cluster evaluation for gene function prediction. Journal of compu-tational biology: a journal of compucompu-tational molecular cell biology. 2014; 21(6):428–45.https://doi.org/
10.1089/cmb.2009.0129PMID:20059365.
32. Tian W, Zhang LV, Tasan M, Gibbons FD, King OD, Park J, et al. Combining guilt-by-association and guilt-by-profiling to predict Saccharomyces cerevisiae gene function. Genome biology. 2008; 9 Suppl 1:
S7.https://doi.org/10.1186/gb-2008-9-s1-s7PMID:18613951; PubMed Central PMCID: PMC2447541.
33. Faith JJ, Hayete B, Thaden JT, Mogno I, Wierzbowski J, Cottarel G, et al. Large-scale mapping and val-idation of Escherichia coli transcriptional regulation from a compendium of expression profiles. PLoS biology. 2007; 5(1):e8.https://doi.org/10.1371/journal.pbio.0050008PMID:17214507; PubMed Central PMCID: PMC1764438.
34. Ishchukov I, Wu Y, Van Puyvelde S, Vanderleyden J, Marchal K. Inferring the relation between tran-scriptional and posttrantran-scriptional regulation from expression compendia. BMC microbiology. 2014; 14:14.https://doi.org/10.1186/1471-2180-14-14PMID:24467879; PubMed Central PMCID: PMC3948049.
35. Wang Y, Han R, Chen Z, Fu M, Kang J, Li K, et al. A transcriptional miRNA-gene network associated with lung adenocarcinoma metastasis based on the TCGA database. Oncology reports. 2016; 35 (4):2257–69.https://doi.org/10.3892/or.2016.4560PMID:26781266.
36. McDermott JE, Mitchell HD, Gralinski LE, Eisfeld AJ, Josset L, Bankhead A, 3rd, et al. The effect of inhi-bition of PP1 and TNFalpha signaling on pathogenesis of SARS coronavirus. BMC systems biology. 2016; 10(1):93.https://doi.org/10.1186/s12918-016-0336-6PMID:27663205; PubMed Central PMCID: PMC5035469.
37. Chen C, Yao Y, Zhang L, Xu M, Jiang J, Dou T, et al. A Comprehensive Analysis of the Transcriptomes of Marssonina brunnea and Infected Poplar Leaves to Capture Vital Events in Host-Pathogen Interac-tions. PloS one. 2015; 10(7):e0134246.https://doi.org/10.1371/journal.pone.0134246PMID: 26222429; PubMed Central PMCID: PMC4519268.
38. Hebecker B, Vlaic S, Conrad T, Bauer M, Brunke S, Kapitan M, et al. Dual-species transcriptional profil-ing durprofil-ing systemic candidiasis reveals organ-specific host-pathogen interactions. Scientific reports. 2016; 6:36055.https://doi.org/10.1038/srep36055PMID:27808111; PubMed Central PMCID: PMC5093689.
39. Wang YC, Lin C, Chuang MT, Hsieh WP, Lan CY, Chuang YJ, et al. Interspecies protein-protein interac-tion network construcinterac-tion for characterizainterac-tion of host-pathogen interacinterac-tions: a Candida albicans-zebra-fish interaction study. BMC systems biology. 2013; 7:79.https://doi.org/10.1186/1752-0509-7-79PMID: 23947337; PubMed Central PMCID: PMC3751520.
40. Folch-Fortuny A, Villaverde AF, Ferrer A, Banga JR. Enabling network inference methods to handle missing data and outliers. BMC bioinformatics. 2015; 16:283.
https://doi.org/10.1186/s12859-015-0717-7PMID:26335628; PubMed Central PMCID: PMC4559359.
41. Pan R, Yang T, Cao J, Lu K, Zhang Z. Missing data imputation by K nearest neighbours based on grey relational structure and mutual information. Applied Intelligence. 2015.https://doi.org/10.1016/j.intell.
2015.09.004PMID:26478640
42. Marbach D, Costello JC, Kuffner R, Vega NM, Prill RJ, Camacho DM, et al. Wisdom of crowds for robust gene network inference. Nature methods. 2012; 9(8):796–804.https://doi.org/10.1038/nmeth.2016 PMID:22796662; PubMed Central PMCID: PMC3512113.
43. Meyer PE, Lafitte F, Bontempi G. minet: A R/Bioconductor package for inferring large transcriptional networks using mutual information. BMC bioinformatics. 2008; 9:461.
https://doi.org/10.1186/1471-2105-9-461PMID:18959772; PubMed Central PMCID: PMC2630331.
44. Liberzon A, Birger C, Thorvaldsdottir H, Ghandi M, Mesirov JP, Tamayo P. The Molecular Signatures Database (MSigDB) hallmark gene set collection. Cell systems. 2015; 1(6):417–25.https://doi.org/10.
1016/j.cels.2015.12.004PMID:26771021; PubMed Central PMCID: PMC4707969.
45. Kanehisa M, Goto S. KEGG: kyoto encyclopedia of genes and genomes. Nucleic acids research. 2000; 28(1):27–30.https://doi.org/10.1093/nar/28.1.27PMID:10592173; PubMed Central PMCID: