Copyright © 2001, American Society for Microbiology. All Rights Reserved.
Improved Antimicrobial Interventions Have Benefits
JOAN BARENFANGER,1* MICHAEL A. SHORT,2ANDALISA A. GROESCH2
Microbiology, Pathology Department,1and Pharmacy Department,2
Memorial Medical Center, Springfield, Illinois 62781
Received 14 February 2001/Returned for modification 25 April 2001/Accepted 16 May 2001
Studies have shown benefits to patients from improved interventions involving antimicrobial therapy. The purpose of the present study was to evaluate prospectively the impact of improved interventions by (i) the use of TheraTrac 2, a computer software program which electronically links susceptibility testing results imme-diately to the pharmacy and alerts pharmacists of potential interventions, and (ii) the education of pharma-cists involving microbiologic topics. The study group had the new intervention program. The control group had interventions performed the way that they had previously been done by manually reviewing hard copies of susceptibility testing data. In a 5-month period, all inpatients whose last names began with A to K were the study group; inpatients whose last names began with L to Z were controls. Three analyses were done; one analysis (analysis A) involved only patients with interventions, one analysis (analysis B) involved all patients for whom antimicrobial testing was done and who were matched for diagnosis-related groups (DRGs), regardless of whether an intervention occurred, and one analysis (analysis C) involved these DRG-matched patients by using severity-adjusted data. In analysis A, the study group had a 4.8% decreased rate of mortality, an average of a 16.5-day decreased length of stay per patient, and $20,886 decreased variable direct costs per patient. None of these differences was statistically significant. In analysis B, the study patients had a 1.2%
higher mortality rate (Pⴝ0.741), an average of a 2.7-day decreased length of stay per patient (Pⴝ0.035), and
$2,626 decreased variable direct costs per patient (Pⴝ0.008). In analysis C, the study patients had a 1.4%
lower mortality rate, a 1.2-day decreased length of stay per patient, and $1,466 decreased variable direct costs per patient. In conclusion, the institution of this program caused substantial cost savings.
For quality assurance, many pharmacies monitor antimicro-bial therapy and antimicroantimicro-bial susceptibility testing (AST), po-tentially preventing inappropriate antimicrobial therapy by in-terventions with the physicians. In the past, a manual review of pertinent data sufficed, but with the advent of sophisticated computer software, there are alternatives to this. Several stud-ies have documented the clinical and financial benefits of im-proved antibiotic therapy facilitated by various programs that use computer software (4–7, 9–11). In the present study, we assessed the impact of improved interventions facilitated by (i) TheraTrac 2 (bioMerieux, Hazelwood, Mo.), a computer soft-ware program which electronically notifies pharmacists of po-tential problems with a patient’s antimicrobial therapy, and (ii) the education of pharmacists making interventions and notifi-cation of the medical staff of the program. We compared pa-tients whose microbiologic data were processed in the normal manual manner in the pharmacy to patients whose microbio-logic data were processed on a more timely basis.
MATERIALS AND METHODS
Study design.Memorial Medical Center is a 450-bed community teaching hospital for the Southern Illinois University School of Medicine. In a prospective study we evaluated the effects of improved interventions involving antimicrobial agents (the study group) with our (then) current method (the control group). Although most thought it unnecessary, the design of the study was approved by an institutional review board.
An intervention for both control and study groups consisted of communication between a pharmacist and the physician caring for the patient. By design,
inter-ventions were to involve (i) patients infected with a bacterial isolate without an order for antimicrobial therapy, (ii) patients infected with bacteria resistant to their current antimicrobial therapy, (iii) patients on therapy which was not tested, and (iv) patients who were on antimicrobial therapy but from whom no sample for culture had been taken.
Between 1 October 1998 and 28 February 1999, all inpatients whose last names began with the letters A to K were included in the study group; all inpatients whose last names began with the letters L to Z were the control group. Costs (not charges) were obtained from the data management team. Total costs were the sum of fixed direct, variable direct, and fixed indirect costs. Costs attributable to the pharmacy were variable direct costs. Fixed costs are those costs which do not change with an individual patient, such as overhead and costs of administration. Variable costs are those costs which are associated directly with patient care, such as supplies actually used for a patient, pharmaceuticals, and laboratory or radiological tests performed on a particular patient.
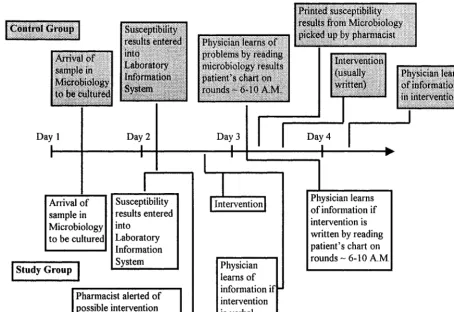
Control group.The control group comprised inpatients who had their micro-biologic data processed manually (the way it was previously done at Memorial Medical Center). For the control group, a pharmacist went to the microbiology department to obtain a hard (paper) copy of all AST done for inpatients on the previous day with the Vitek instrument (bioMerieux), an instrument which gen-erates bacterial identification and AST results (Fig. 1). These reports print automatically in Microbiology by the end of the first day that the data were generated and were manually picked up by a pharmacist on the following day, Monday through Friday. Weekend reports from the Vitek instrument were collected on Monday. The pharmacist then correlated the patient’s current antimicrobial therapy (information available in the pharmacy) with the suscep-tibility data and made interventions, as needed. By tradition, most of the inter-ventions were made via written communication sheets on the patient’s chart, but in more urgent situations, interventions could involve a telephone call to the physician (Fig. 1).
Study group.For the study group, more timely and more interventions were made possible by institution of a program to improve interventions, which con-sisted of (i) the use of TheraTrac 2, a computer software program which elec-tronically links susceptibility testing results immediately to the pharmacy and alerts pharmacists of potential interventions, and (ii) the education of pharma-cists involving microbiologic topics and notification of the medical staff about the program. TheraTrac 2 is a clinical pharmacy documentation software program which, among other functions, serves as an electronic link between the AST result generated by the Vitek instrument and data available in the Pharmacy
* Corresponding author. Mailing address: Microbiology, Pathology Department, Memorial Medical Center, 701 N. First St., Springfield, IL 62781. Phone: (217) 788-3018. Fax: (217) 788-5577. E-mail: barenfanger [email protected].
2823
on May 15, 2020 by guest
http://jcm.asm.org/
Department, such as current antimicrobial therapy and allergies. Microbiologists developed guidelines on how to interpret their data, and in-service training sessions were held for the pharmacists making interventions in the TheraTrac 2 group. This involved such topics as (i) guidelines for determination of contam-ination or colonization versus infection; (ii) interpretations of Gram staining results including guidelines for morphological features of common bacteria; (iii) correlation of Gram staining results with culture results; (iii) guidelines for interpretation of results from sterile and nonsterile sites, such as urine; (iv) a guide to which organisms would be likely to cause infection for a particular source; and (v) a guide to which organisms would not be expected to have AST reports in TheraTrac 2 (e.g., anaerobes andStreptococcus pneumoniae, for which AST would not be done with the Vitek instrument) and which therapies might be recommended. Physicians were made aware of this new process by announce-ments at meetings of the major departannounce-ments (surgery, family practice, and in-ternal medicine) and a newsletter. Initially, when they were uncertain, the phar-macists occasionally consulted with a microbiologist to determine if an intervention was appropriate. Generally, these cases involved whether the bac-teria represented contamination or colonization versus true infection. Interven-tions were made only if contamination or colonization was unlikely. These consultations were no longer necessary after the program was under way (once the various pharmacists became adept at making these determinations). The team of pharmacists who made interventions for the study group was composed of pharmacists entirely different from those who made interventions for the control group.
The computer was set up to include only patients whose last names began with the letters A to K (the study group). A flag was generated by TheraTrac 2 when inappropriate antimicrobial therapy was likely. Through TheraTrac 2 and the automatic messaging system in Windows 95, an electronic notification (via a pager) of a flag was made to a pharmacist, who then evaluated whether an intervention was necessary. This was done by evaluating the information avail-able in TheraTrac 2. After evaluation, an intervention was made, if necessary (Fig. 1). Although new information was potentially available around the clock, functionally (because of work schedules in Microbiology), new information from
Microbiology became available only between 10 a.m. and 9 p.m. Therefore, we elected to have notification from TheraTrac 2 to the pharmacist occur daily between 8 a.m. and 10 p.m. Although physicians specializing in infectious dis-eases originally helped in the design of the study, they were not involved in the recommendations made during the course of an intervention. Pharmacists relied on a combination of the following: (i) the results of the AST for a particular patient which were provided by TheraTrac 2, (ii) guidelines and advice described previously from Microbiology, and (iii) their backgrounds and educations as pharmacists.
Ultimately, for both the study and the control groups, the decision whether to alter antimicrobial therapy lay with the physician.
Analysis of patient data.Three sets of analyses were performed: the first analysis (analysis A) included only inpatients with interventions, the second analysis (analysis B) included all diagnosis-related group (DRG)-matched inpa-tients for whom AST was done during this 5-month time period, regardless of whether or not they had interventions, and the third analysis (analysis C) in-volved the DRG-matched patients in analysis B, but with the additional step of adjusting the average of the control group to the volume of the corresponding DRGs in the study group (i.e., “severity-adjusting” the control group).
Matching.To ensure that our study and control groups were comparable for analysis, matching by DRG was done for analyses B and C. All categories of DRGs for patients in the control group were examined, and data for those patients with DRGs with a match with the DRGs for patients in the study group were included in the analysis. All patients described in analyses B and C are DRG matched. After matching of DRGs for patients for analyses B and C, the study group had 188 patients and the control group had 190 patients. The most frequent diagnoses or procedures included septicemia, kidney and urinary tract infection, respiratory infection and inflammation, simple pneumonia and pleu-risy, major large- and small-bowel procedure, heart failure and shock, cerebral vascular disorder, and rehabilitation. Table 1 shows the distribution of the pa-tients in the most common DRG categories.
[image:2.612.75.530.76.388.2]Statistical analysis.The mortality rates represent all deaths among patients in the study and control groups; no averages were used for mortality rates. The
FIG. 1. Time line demonstrating work flow in control group (above the time line, in shaded boxes) and study group (below the time line).
on May 15, 2020 by guest
http://jcm.asm.org/
mortality rate is a crude rate. Means (averages) were used to calculate length of stay and costs for the study and control groups.
All analyses were performed with raw data by a doctorate-level biostatistician with the computer program SPSS (Statistical Package for Social Sciences, Inc., Chicago, Ill.). The severity rating system used the relative weights for the DRG categories from the Health Care Financing Administration (HCFA) published in theFederal Register(8). Higher numbers in this system indicate a more severe disease state. In analysis A, there was sufficient variation in severity between the study and control groups (5.4 for the control group and 2.4 for the study group) that a pairedttest was not appropriate. The more appropriate analysis for disparate groups was the Wilcoxon rank sum test. In analysis B, since the HCFA severity rating was so similar for the two groups, there was no statistical differ-ence in the severity or age of patients in the control or study groups, indicating that it was not necessary to control for these variables. Therefore, Fisher’s exact test was used to compare the two groups for mortality, andttests for indepen-dent groups were used for the other variables such as length of stay in the hospital and costs (2). Equal variances were not assumed.
RESULTS
Interventions. As expected by the design of the study, the
control group had fewer interventions than the study group. This is because for the study group no data had yet appeared on any written report, so the pharmacist knew that the physi-cian was probably unaware of a problem. For the control group, physicians were often aware of the findings on the susceptibility testing report even before the pharmacist, so
often the pharmacist did not perceive interventions to be cru-cial. This is because the physicians generally made their patient rounds between 6 and 10 a.m. and saw the microbiology results on the patient’s chart at that time. For the control group, the pharmacist was generally not able to examine the microbiology data and correlate them with pharmacy information before 10 a.m. (Fig. 1).
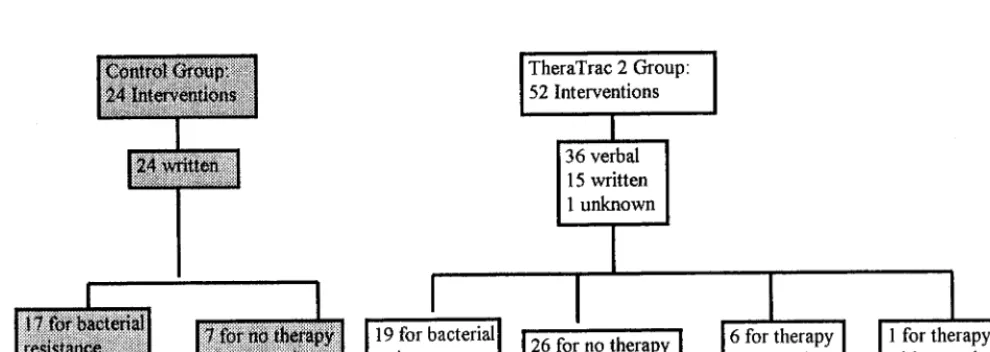
Among the patients in the control group there were 24 interventions, all of which were written (Fig. 2). Seventeen (71%) interventions involved patients with bacterial resistance to their current antimicrobial therapy and 7 (29%) interven-tions involved patients who were infected with a bacterial iso-late but who did not have an order for antimicrobial therapy. Acceptance of the recommendations for the control group occurred 17 times among the 24 interventions (71%). Of the 17 accepted recommendations, 13 (76%) were for patients in-fected with bacteria resistant to their current antimicrobial therapy and 4 (24%) were for patients who were infected with a bacterial isolate but who did not have an order for antimi-crobial therapy.
Among the patients in the study group there were 52 inter-ventions: 36 (69%) verbal (either by telephone or in person), 15 (29%) written, and 1 (2%) for which the mechanism of contact was unknown (Fig. 2). Nineteen (37%) of the inter-ventions were for patients infected with bacteria resistant to their current antimicrobial therapy, 26 (50%) interventions involved patients who were infected with a bacterial isolate but who did not have an order for antimicrobial therapy, 6 (12%) involved patients on therapy which was not tested, and 1 in-volved a patient who was on antimicrobial therapy but from whom no sample for culture had been taken. Seven of the 36 verbal interventions were made between 3 and 9 p.m.
[image:3.612.53.294.87.236.2]Acceptance of the recommendations in the TheraTrac 2 group occurred 41 times in the 52 interventions (79%). Of the 41 accepted recommendations, 17 (41%) were for patients infected with bacteria resistant to their current antimicrobial therapy, 21 (51%) were for patients who were infected with a bacterial isolate but who did not have an order for antimicro-bial therapy, and 3 (7%) were for patients on therapy which
[image:3.612.57.552.540.716.2]FIG. 2. Diagram of interventions. TABLE 1. Distribution of patients in the
most common DRG groups
DRG
No. of patients in: Control
group Studygroup
Cerebral vascular accident 3 9
Major large- and small-bowel procedure 7 10
Heart failure and shock 4 8
Kidney and urinary tract infection,⬎17 years of age,
with complications 11 9
Rehabilitation 16 9
Respiratory infection and inflammation,⬎17 years
of age 11 11
Septicemia 7 7
Simple pneumonia and pleurisy 11 9
on May 15, 2020 by guest
http://jcm.asm.org/
was not tested. Twenty-seven (66%) of the accepted interven-tions were verbally communicated.
Analysis A.All 24 patients in the control group and all 52
patients in the study group who had interventions were in-cluded in analysis A. Eight patients in the study group shared DRGs with eight patients in the control group; the remaining patients were unmatched. The average age of the patients in the study group was 64.7 years; the average age of the patients in the control group was 67.3 years (Table 2). The HCFA weight for the control group was 5.4; that for the study group was 2.4. The mortality rate for the study group was 7.7%; that for the control group was 12.5% (P⫽ 0.68) (Table 2). The study group had an average length of stay in the hospital of 16.5 days per patient; the control group had an average length of stay of 33.0 days per patient, a decrease of 16.5 days per patient in the study group (P⫽0.37). The study group had an average total standard cost of $21,189 per patient; the control group had an average total standard cost of $51,790 per pa-tient, a decrease of $30,601 per patient in the study group (P⫽ 0.41). The study group had an average total variable direct cost of $14,033 per patient; the control group had an average total variable direct cost of $34,919 per patient, a decrease of $20,886 per patient in the study group (P⫽0.38). The study group had an average variable direct pharmacy cost of $2,331 per patient; the control group had an average variable direct pharmacy cost of $5,931 per patient, a decrease of $3,600 per patient in the study group (P⫽0.31). The study group had an average variable direct radiology cost of $580 per patient; the control group had an average variable direct radiology cost of $1,105 per patient, a decrease of $525 per patient in the study group (P⫽0.70).
Analysis B.DRG-matched patients for whom susceptibility
testing was done were included in analysis B, regardless of whether they had an intervention. The HCFA severity rating for the study group was 2.2; the HCFA severity rating for the control group was 2.5. The average age of the 188 DRG-matched patients in the study group was 66.1 years; the average age of the 190 patients in the control group was 65.6 years (Table 3). Twenty patients in the study group and 11 patients in the control group had interventions. The mortality rate for the study group was 11.2%; that for the control group was 10.0% (P⫽0.741) (Table 3). The study group had an average length of stay in the hospital of 11.0 days per patient; the control group had an average length of stay in the hospital of 13.7 days per patient, a decrease of 2.7 days per patient in the study group (P⫽0.035). The study group had an average total standard cost of $13,294 per patient; the control group had an average total standard cost of $18,601 per patient, a decrease of $5,308 per patient in the study group (P⫽0.008). The study group had an average total variable direct cost of $5,889 per patient; the control group an average had total variable direct cost of $8,515 per patient, a decrease of $2,626 per patient in the study group (P⫽0.008). The study group had an average variable direct pharmacy cost of $1,227 per patient; the control group had an average variable direct pharmacy cost of $1,702 per patient, a decrease of $475 per patient in the study group (P⫽0.104). The study group had an average variable direct radiology cost of $233 per patient; the control group had an average variable direct radiology cost of $328 per patient, a decrease of $95 per patient in the study group (P⫽0.043).
Analysis C. All DRG-matched patients were included in
[image:4.612.59.553.83.194.2]analysis C, but severity-adjusted control values were used.
TABLE 2. Analysis A: summary of parameters examined for patients with interventions in study and control groups
Parameter Controlgroup groupStudy study and control groupsDifference between a SD for control groupSD for study group/ Pvalue 95% confidenceinterval
No. of patients 24 52 Not applicable
HCFA severity rating 5.4 2.4 3.0 6.1/2.1 0.14 ⫺4.9 to⫺1.1
Age (yr) 67.3 64.7 ⫺2.6 19.7/20.0 0.67 ⫺12.3 to 7.2
Mortality rate (crude rate) (%) 12.5 7.7 ⫺4.8 Not applicable 0.68 ⫺0.103 to 0.199
Average length of stay (days) 33.0 16.5 ⫺16.5 14.8/39.4 0.37 ⫺33.6 to 0.6
Average total cost ($) 51,790 21,189 ⫺30,601 20,688/68,817 0.41 ⫺60,132 to⫺1,070 Average variable cost ($) 34,919 14,033 ⫺20,866 13,866/46,398 0.38 ⫺40,794 to⫺979 Average variable cost in Pharmacy ($) 5,931 2,331 ⫺3,600 4,788/8,379 0.31 ⫺7,346 to 146 Average variable cost in Radiology ($) 1,105 580 ⫺525 1,683/824 0.70 ⫺1,267 to 216
aNegative numbers indicate a decrease compared with the value for the study group.
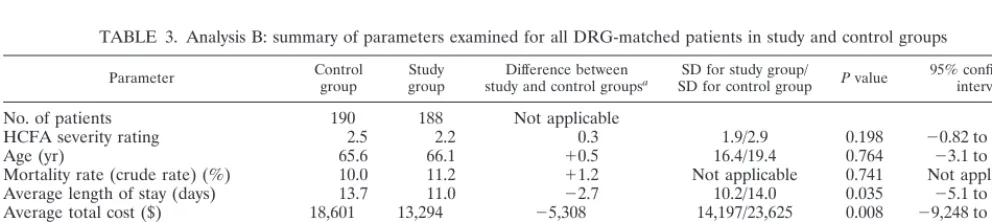
TABLE 3. Analysis B: summary of parameters examined for all DRG-matched patients in study and control groups
Parameter Controlgroup groupStudy study and control groupsDifference between a SD for control groupSD for study group/ Pvalue 95% confidenceinterval
No. of patients 190 188 Not applicable
HCFA severity rating 2.5 2.2 0.3 1.9/2.9 0.198 ⫺0.82 to⫺0.17
Age (yr) 65.6 66.1 ⫹0.5 16.4/19.4 0.764 ⫺3.1 to 4.2
Mortality rate (crude rate) (%) 10.0 11.2 ⫹1.2 Not applicable 0.741 Not applicable
Average length of stay (days) 13.7 11.0 ⫺2.7 10.2/14.0 0.035 ⫺5.1 to⫺0.19
Average total cost ($) 18,601 13,294 ⫺5,308 14,197/23,625 0.008 ⫺9,248 to⫺1,368 Average variable cost ($) 8,515 5,889 ⫺2,626 6,714/11,851 0.008 ⫺4,573 to⫺679 Average variable cost in pharmacy ($) 1,702 1,227 ⫺475 2,151/3,343 0.104 ⫺1,040 to 98
Average variable cost in radiology ($) 328 233 ⫺95 324/495 0.043 ⫺185 to⫺3
aNegative and positive numbers indicate a decrease and an increase compared with the value for the study group, respectively.
on May 15, 2020 by guest
http://jcm.asm.org/
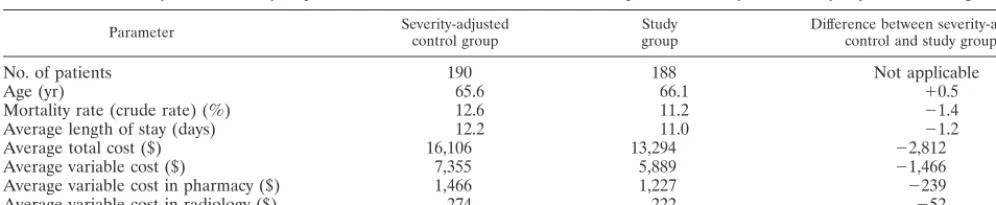
[image:4.612.54.550.607.718.2]Most hospitals do a process called “severity adjustment” to make two DRG-matched populations even more comparable. This method involves taking the means for each DRG for the control group and multiplying by the number of patients for the corresponding DRGs in the study group, summing all these products, and then dividing this number by the total number of study patients to obtain a severity-adjusted average for the control group. For instance, if the average length of stay of a given DRG (e.g., cerebral vascular accident) for control pa-tients is 8 days, and the number of papa-tients in that DRG in the study group is 9, the product (8⫻9) is 72. Given that the sum of all the products for each DRG group is 1,288.9 and the total number of all the patients in the study group is 188, this calculation would be performed for severity adjustment of the length of stay for the control group as follows: [(8⫻ 9) ⫹ (product of each other DRG) or 1,288.9]/188⫽12.2 days. This process abolishes potential bias from an uneven distribution of patients in the study and control groups with DRGs with dif-ferent severities. As can be seen in Table 1, the two groups share common diagnoses, but in one group a diagnosis group may be more heavily represented than it is in the other group. For instance, the control group has one-third the number of patients with a diagnosis of cerebral vascular accident that the study group has (Table 1). The process of severity adjustment gives a new number that is used as the severity-adjusted mean for the control group. This severity adjustment compensates for uneven numbers of control and study patients in each DRG group, thus neutralizing the unequal effect of DRG bias. Sta-tistical analysis cannot be performed with these numbers be-cause the control group has projected numbers and not actual patient data. (This is because the severity-adjusted numbers are projected ones, being the product of the actual mean for the control group for a given DRG and the number of patients in the study group for that DRG.) However, this severity ad-justment is so commonly used by hospital data management departments that we included these data for comparison. By this method, our data management team developed adjusted data for the control group (Table 4). The severity-adjusted mortality rate for the control group increased to 12.6%, now rendering a 1.4% decreased mortality rate for the study group. The control group had a (severity-adjusted) mean length of stay of 12.2 days in the hospital, an increase of 1.2 days per patient over that for the study group. The control group had a (severity-adjusted) variable cost of $7,355, an increase of $1,466 per patient over that for the study group. The control group had a (severity-adjusted) variable direct
pharmacy cost of $1,466, an increase of $239 per patient over that for the study group.
DISCUSSION
[image:5.612.54.552.83.185.2]The present study documents the impact of a program used to improve interventions involving antibiotic therapy. Three different approaches to the analysis of the data were used. Analysis A (which directly compared only patients with inter-ventions) had the advantage of comparing patients who had actual interventions in both the study and the control groups but had the disadvantage of comparing widely divergent pa-tients in terms of their diagnoses. Although there was a trend of benefit for patients in the study group, the differences were not statistically significant, so no conclusion can be drawn. Analysis B had the advantage of better assessing the overall impact of the program because it included the entire pool of patients for whom susceptibility testing data were available and compared patients who were similar because DRG matching was done. Statistically significant differences were found be-tween the two groups for length of stay, total costs, variable costs, and radiology costs, all benefiting the patients in the study group. Analysis C further narrowed the differences be-tween the DRG-matched patients in the study and the control groups by performing severity adjustment for the control group to make it more comparable to the study group. In analysis C, of particular note was the difference in variable costs of $1,466 less per patient in the study group compared to that per patient in the severity-adjusted control group. Administrators consider these severity-adjusted variable costs to be responsible for the actual cost savings realized by the hospital. Memorial Medical Center has approximately 2,000 inpatients each year for whom susceptibility testing is done. By using these severity-adjusted data (upon which the data management team relies), the esti-mated variable cost savings annually from the improvement of interventions is $2,932,000 (2,000 inpatients for whom suscep-tibility testing is done⫻$1,466). If the list price of TheraTrac 2 ($44,500) is subtracted from the expected annual cost sav-ings from the use of our program to improve interventions ($2,932,000), the resulting savings ($2,887,500) is still substan-tial in the first year. It should be noted that the numbers in analysis C were not analyzed by statistical methods because projected numbers were used for the severity adjustment. However, these data are included in the discussion because the numbers used in analysis C are those which our hospital uses for projected cost savings.
TABLE 4. Analysis C: summary of parameters examined for all DRG-matched patients in study and severity-adjusted control group
Parameter Severity-adjustedcontrol group groupStudy Difference between severity-adjustedcontrol and study groupsa
No. of patients 190 188 Not applicable
Age (yr) 65.6 66.1 ⫹0.5
Mortality rate (crude rate) (%) 12.6 11.2 ⫺1.4
Average length of stay (days) 12.2 11.0 ⫺1.2
Average total cost ($) 16,106 13,294 ⫺2,812
Average variable cost ($) 7,355 5,889 ⫺1,466
Average variable cost in pharmacy ($) 1,466 1,227 ⫺239
Average variable cost in radiology ($) 274 222 ⫺52
aNegative and positive numbers indicate a decrease and an increase compared with the value for the study group, respectively.
on May 15, 2020 by guest
http://jcm.asm.org/
Although the mortality rate for the study group in analysis B was higher than that for the control group, it was negligible (1.2%) and was likely due to chance alone (P⫽0.741). This unfavorable trend disappeared when the data were analyzed by the two other methods, analyses A and C.
The findings from analysis B indicate important benefits for the patients who had improved interventions. When the board of directors of Memorial Medical Center was told of the re-sults, it requested that the study be terminated so that all patients, not just patients whose last names began with the letters A to K, could be included in the study group. We did so. More studies involving more patients or a multicenter trial to confirm these findings would be ideal.
Previous studies involving faster turnaround times for aero-bic bacterial identifications and AST have shown clinical and financial benefits (1, 3). New computer programs now enable pharmacists to have access to these important data even faster, in real time. The pharmacists, in turn, can link this to their knowledge of the patient’s current therapy to facilitate sub-stantial improvements in patient care. Our findings are consis-tent with those of previous studies that showed the financial benefits of improved pharmacological interventions involving antimicrobial therapy (4–7, 9–11). Using a computerized deci-sion support program developed at their hospital, Evans et al. (5) found a 2.9-day decrease in the length of stay, a $8,968 decrease in total costs, and a 4% decrease in the mortality rate for the study group. Jozefiak et al. (7) using PharmLink, a commercially available software similar to TheraTrac 2, con-ducted a study using criteria for interventions similar to ours but with the addition of conversion of intravenous medications to oral medications and dose adjustments based on hepatic and renal dysfunction. They demonstrated a cost avoidance of ⬎$32,000 in a 6-month period in their study group. Schentag et al. (11), using a program that they developed at their hospital, showed that real dollar expenditures for antibiotics declined ⬎$20,000 annually due to their improved interventions.
The key to physicians’ acceptance of this program was that they were notified about information of which they had no previous knowledge. The antimicrobial susceptibility report was new information (it was not yet even printed) and was not previously available to the physician. Interventions in the study group offered a nonthreatening, convenient way for physicians (i) to learn of new, usually critical, antimicrobial susceptibility data and (ii) to easily change therapy because the pharmacist on the phone had access to a list of antibiotics more effective for that particular patient. On the other hand, for the control group the interventions were generally based on information which was available to the physician before it was seen by the pharmacist. Often, there was a disagreement between the phy-sician and pharmacist about the therapy. Hence, these inter-ventions were perceived as punitive, meddling, or at least un-welcome by the physician. This was because (on the basis of
common information) the therapeutic decision made by the pharmacist was different from that made by the physician. For the study group, this potential conflict never arose because physicians had no prior knowledge of the results of the AST report.
In addition to the financial benefits, this program promoted good antibiotic use stewardship by facilitating more prompt use of appropriate antimicrobial agents. Although switching from intravenous to oral medications and the use of antibiotics with more narrow spectra were not targeted in the present evaluation, these areas offer more opportunities for positive impacts.
Extra training and education of the pharmacists involving service training sessions about microbiologic issues and in-terpretations and the use of TheraTrac 2 were necessary. This was welcomed as a tool for staff development.
In summary, the present study demonstrates the financial benefits of improved interventions involving antimicrobial agents, namely, statistically significant differences in lengths of stay, total costs, variable costs, and radiology costs.
ACKNOWLEDGMENTS This study was funded in part by bioMerieux.
Special recognition goes to James Goodrich, Donald Graham, Nancy Khardhori, Cheryl Drake, and Jerry Lawhorn for help in de-signing the study.
REFERENCES
1.Barenfanger, J., C. Drake, and G. Kacich.1999. Clinical and financial ben-efits of rapid bacterial identification and antimicrobial susceptibility testing. J. Clin. Microbiol.37:1415–1418.
2.Dawson (-Saunders), B., and R. Trapp.1994. Biostatistics, 2nd ed. Appleton and Lange, Norwalk, Conn.
3.Doern, G., R. Vautour, M. Gaudet, and B. Levy.1994. Clinical impact of rapid in vitro susceptibility testing and bacterial identification. J. Clin. Mi-crobiol.32:1757–1762.
4.Evans, R. S., D. C. Klassen, S. L. Pestotnik, et al.1994. Improving empiric antibiotic selection using computer decision support. Arch. Intern. Med. 54:878–884.
5.Evans, R. S., F. L. Pestotnik, D. C. Klassen, et al.1998. Computer-assisted management program for antibiotics and other antiinfective agents. N. Engl. J. Med.338:232–238.
6.Gums, J. G., R. W. Wancey, C. A. Hamilton, et al.1999. A randomized prospected study measuring outcomes after antibiotic therapy intervention by a multidisciplinary consult team. Pharmacotherapy19:1369–1377. 7.Jozefiak, E. T., J. E. Lewicki, and W. P. Kozinn.1995. Computer-assisted
antimicrobial surveillance in a community teaching hospital. Am. J. Health-System Pharm.52:1536–1540.
8.Lorenz, L. (ed.).1997. St. Anthony’s diagnosis related group guidebook for 1997, Table 5. Health Care Services, St. Anthony’s Publishing Inc., Reston, Va.
9.Pestotnik, S. L., D. C. Klassen, R. S. Evans, et al.1996. Implementing antibiotic practice guidelines through computer-assisted decision support: clinical and financial outcome. Ann. Intern. Med.124:884–890.
10. Scarafile, P. D., B. D. Campbell, J. E. Kilroy, et al.1985. Computer-assisted concurrent antibiotic review in a community hospital. Am. J. Hosp. Pharm. 42:313–315.
11. Schentag, J. J., C. H. Ballow, A. L. Fritz, et al.1993. Changes in antimicrobial agent usage resulting from interactions among clinical pharmacy, the infec-tious disease division and the microbiology laboratory. Diagn. Microbiol. Infect. Dis.16:255–264.