Multivariate prediction of electricity consumption in Iran
2025 after statement with great countries of UN Security
Council
Arash Zare Talab
a,
Fahimeh Kianian
a,b, Hamidreza Shahabi Haqhiqhi
a*1a) Department of Industrial Technology, Amirkabir University of Technology. 424. Hafez St. Tehran. Iran b) Niroo Research Institute (NRI). Shahrak Qodes. Tehran. Iran.
Abstract- Today among the various energies conspicuous, electric power is a significant source of industrial energy that is important for industries, agriculture and household use. Therefore, this article aims to study the trend of probable power generation i n Iran, its state of consumption following Iran’s vision plan in the year 2025. Although, there are some studies on Iran’s electricity demands; the researchers studied on the relation between electricity consumption and GDP in a bi-variable assumption. Thus, this study focused on a multi-variable model to predict efficiently the electricity need for Iran 2025. During the recent years following sanctions, development of electricity power industry in Iran has been faced to some problems. Therefore, if the capacity of power plants in Iran would not be increased, it is anticipated that the relative probable power outages control would be unavoidable in the country, especially during peak hours. Accordance with international agreements made between Iran and effective United Nations Security Council members, Iran’s electricity industry is going to prepare a development plan for increasing the present capacity. The most significant methods of domestic power generation in Iran include combined cycle, steam, gas, hydroelectric and other renewable methods. The generation rate of these methods is considered a target variable for predicted processes. The article has used a methodology based on the electricity power generated in different methods annually as the variables to plan the use of multilayer neural network for anticipating the future power generation and the required investment. Also, trend of some important parameters affecting the rate of electricity demand were investigated i.e. GDP, Steel production, Urban population and oil production in Iran. The performed research study in this paper is focused on production trend and diverse power generation methods in the country during the various years up to 2025, and the analysis of this report is based on this classification.
Key words: Electricity generation, Iran, Neural network, Prediction, Security Council.
I. INTRODUCTION
Global power industry has become more significant due to urban life and auto industrial development. Nowadays, develop of equipment and machines that work with electricity increasingly need the suitable power supply to answer the requirements of people and also the industries. Anticipating the electricity need is an important issue thus there are lots of studies focused on this area [1-6]. Although, there are some studies on Iran’s electricity demands [1, 2]; the researchers studied on the relation between electricity consumption and GDP in a bi-variable assumption. Thus, this study focused on a multi-variable model to predict efficiently the electricity need for Iran 2025. Iran, having the population of about 78 million and the area more than 1.6 million square kilometers is known as a developing country [7]. In accordance to International Energy Agency, this country supplies more than 90% of energ y from fossil fuel; the main reason is the capacity of Iran’s crude oil and natural gas production equal to 162 Mtoe and 134 Mtoe respectively as the world seventh and forth rank [8]. Since domestic power supply requirements in any country is one essential factor in sustainable development, prediction of required electricity in the coming years is indispensable. Accurate prediction is a significant issue in the supply and demand management since it cannot be saved and expected to be used immediately. That is why numerous studies have been performed on power supply and demand predictions.
Since accurate prediction of power consumption is specifically essential for countries’ energy plans, during the previous decades new techniques have been used to predict the power consumption to anticipate the accurate requirements for the future. Artificial Neural network frequently were used as a suitable method to forecast the energy consumption. In a survey carried by Kaytez et al. [9] the LS-SVMs method based on regression analysis and Artificial Neural Networks (ANN) was used to predict the electricity consumption in Turkey. In the model the installed capacity and the population rate in Turkey from 1970 to 2009 were considered as the independent variables. Zhang and Wang [10] based on daily electricity consumption in China, assert that in view of high increasing of demand energy, normal regression model does not provide accurate energy consumption prediction. Therefore, they applied the Fuzzy Wa ve Neural Network (FWNN) to combine experts’ knowledge with target properties to overcome the disadvantages of forecasting methods in power consumption anticipation. Saravanan et al. [11] used the ANN and linear regression analysis to specify annual consumption
1
predictions during the years 2011 to 2020 in India. For this purpose, population and GDP were used as input variables and anticipated power consumption as output variables were generated. The authors concluded that ANN model is quite flexible and it can provide the optimal solution of future demand anticipation. Marwala and Twala [12] used the Auto Regressive Moving Average (ARMA) neural networks and fuzzy neural models for future consumption anticipation in South Africa. The input data were used from the past records collected monthly from January 1985 up to December 2011. The results revealed that fuzzy neural model is more capable than other used methods; also they concluded that the neural network is better than ARMA. Azadeh et al. [13] used the Artificial Neural Network (ANN) for prediction of annual electricity consumption in high energy consumption industries. In this survey, chemical substances, metal bases and non-metal mineral industries were defined as the high energy consuming industrial sectors. Azadeh et al. used the actual data of industrial energy consumption collected between the years 1979-2003 in Iran. The authors concluded that the normal regression model for prediction of energy consumption of high energy consuming industries is not precise and accurate because the energy consuming in these industries changes unpredictably. Although artificial neural networks are generally used for short term consumption anticipation, this article express that the ANNs can be used for long-term anticipation as well. Also, in another study performed by Azade et. al. [14] the artificial neural networks (ANNs) for modeling of demand prediction of electricity power in power supply sectors were applied for Iran’s demand as well. They compared the results obtained from ANN and those obtained from the simulated based ANN model. The used data is related to Iran's national electricity demand from 1994 to 2005. Also, Ringwood and Bofelli [15] developed an artificial neural networks (ANNs) for modeling of demand prediction of electricity power in power supply sectors. The used data is related to Republic of Ireland's national electricity demand. The article is focused on three various time scales: annual (fifteen years ahead), weekly (coming three years) and hourly (up to the next twenty-four hours).
Since residential power consumption in most developed countries has increased remarkably during the past years and especially during the summer, studies on the relation of electricity demand and electrical consumers (especially air conditioner) are significantly important. That is why a survey was carried by Marvuglia and Messineo [16] using a model based on Artificial Neural Network (ANN) for short term prediction of family electricity consumption (an hour) performed in neighboring of suburban area o f Palermo (Italy). Hassan et al. [17] aimed to evaluate various algorithms cumulative efficiency for forecasting demand market in Australian energy market (AEMO) and New York Independent Site (NYISO). The authors used the single neural network models in a group. The research is formed of a 100 heterogeneous Neural Network Model structure group to create random order parameters. The NN models output is combined with three various cumulative algorithms. Observations indicate that cumulative algorithm have better performance and higher accuracy in comparison with individual NN models.
In another research carried by Xiufeng and Jian [18] five layer Fuzzy Neural Network (FNN) were introduced. The aim was to optimize network structure, introduce new methods of knot and promote the algorithm skill. Also, to learn the network of real data, Chinese data from 1980 till 2006 were applied in the study. In review and comparison of the results using real data of power consumption in 2006 and predicted data using FNN authors concluded that the method used is a high performance method and also accurate to anticipate the results up to 96.7%. Jia-hai and Xing-ping [19] using an improved neural network (BP) presented an adaptive learning method for power consumption forecast in China. The GDP, electricity energy consumption growth and the growth rate of the secondary industry were considered as input variables and in subsequence the power consumption of future year was predicted as the output. Simulated model of BP neural network improved the flexibility of conventional method of BP neural network in the presented article.
During the recent years, power industry in Iran is not sufficiently developed to reply the countries’ present and future needs due to extensive sanctions. However, Iran and great countries’ statement in UN Security Council has furnished the ground for various industrial development including electricity power industries. The issue has provided mutual opportunities for Iran on one side and global investors on the other side; that is why this article attempts to envision the investment requirements in this sector for the next ten years, in line with Iran ending 2025 vision documentary using a neural network prediction model. Iran’s government urge to reach the objectives set in 2025 vision documentary, thus in this research capacity of electricity production in year 2025 is anticipated. In our survey, a multilayer neural network was applied based on the significant parameters like GDP, urban population and urban population growth and also oil production (as the most significant foreign exchange earnings in Iran) steel production and its consumption (as an important factor that shows the rate of development) to distinguish the future electricity consumption in Iran 2025.
II. METHODOLOGY
ARTIFICIAL NeuralNETWORK (ANN)
methods are exigent to solve these issues. Here, the process of determining optimal of weighting and their value adjusts is mainly recursive. For this purpose, the rules and the known data are applied to educate the network thus network competence is acquired and miscellaneous algorithms are need to be proposed. All striving mentioned in this approach is used to make a network to anticipate the ideal output.
+ weights
Thresholder
Output Input
FIG.1–AN ARTIFICIAL NEURON SCHEME
MULTI-LAYER PERCEPTRON (MLP)
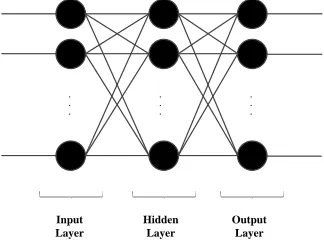
In order to use the ANN, in this research a Multi-Layer Perceptron (MLP) was applied as followed. In fact, one simple and at the same time effective proposed arrangements to be utilized in modeling of real nerve is Multi-Layer Perceptron (MLP). These arrangements are made up of an input layer, one or more hidden layers and an output layer. In this structure all neurons in one layer are connected to the neurons of subsequent layers. This arrangement is called a network with full connectivity comprises.
Fig. 3 manifests three layer perceptron network schemes. It can simply be concluded that the number of neurons of each layer is independent from the number of neurons in other layers. It should be noted that in Fig. 2 each aggregated circle represents aggregated operation and thresholding. In fact, each solid circle in this figure is a model of collector and block thresholding. It is shown in the below form as well to ease the display.
Input Layer
Output Layer Hidden
Layer .
. .
. . .
. . .
FIG.2-THREE-LAYER PERCEPTRON NETWORK SCHEME
Learning via Artificial Neural Network (ANN)
The main idea was propounded by Warren McCulloch and Walter Pitts [20] whom were simulated by the functions of neurons of human brain. The neural network is trained to solve the problems and in fact there are no preplans. Actually adjusting the weights of input of each neuron proportionally learn the network. The regulation is based on the model that shall incur with or without supervision.
In this article analysis of dependent variables are initially specified. For this reason, in addition to consider of total power generation during various years in Iran, different methods were studied separately. As a result, our target variables were selected as below: 1. Electricity generation by steam & Electricity generated by gas & Electricity generated by Combined Cycle (response 1) 2. Electricity produced by hydroelectric method & nuclear energy (response 2)
3. Total generation of electricity by other methods
The total power generation is higher than the existing set in form 1 & 2 because power generation in Iran can be applied in other methods.
[image:3.612.186.432.121.203.2] [image:3.612.225.387.385.507.2]be studied. Due to this, a list of candidate variables for studying the rate of dependency to power generation in Iran were examined as mentioned below:
a) GDP per capita in Iran b) Crude Oil Production in Iran c) Urban population in Iran d) Urban population growth in Iran e) Steel Consumption in Iran f) Steel Production in Iran
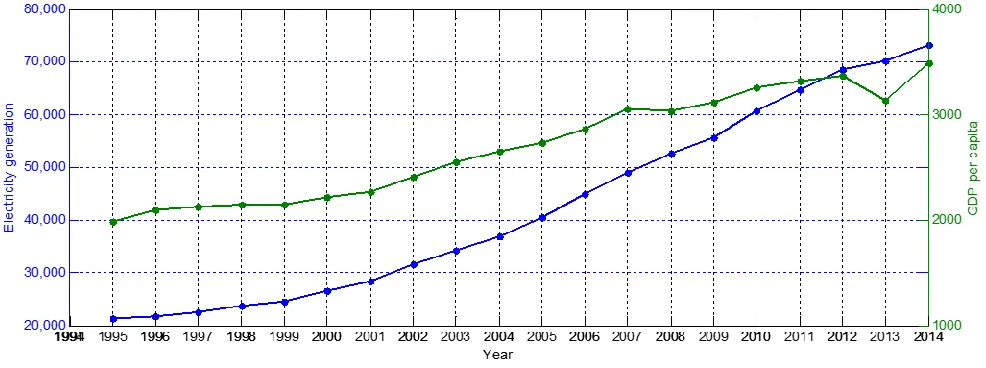
Bennouna and Hebil [21] discussed on close relation between GDP per capita and power consumption in Morocco. Also, Apergis and Tang [22] based on study on the statistical data from 85 countries showed that there is a close correlation between GDP and energy consumption in Iran and lots of other countries investigated in their study. Our data from Iran proves the relation between GDP and electricity generation in year 1995 up to 2014 as well. Figure 3 shows comparison between GDP per capita in Iran and the electricity generation. The R-squared i.e. coefficient of determination is about 94.8
FIG.3–RELATIONSHIP BETWEEN ELECTRICITY GENERATION AND GDP PER CAPITA
One important parameter effects on Iran’s income is the oil production rate yearly. Therefore, the correlation between oil production in the country and the electricity consumption was investigated as well. The result shows that there is a close relation between oil production and electricity consumption because r-squared is about 0.91. Also, the correlation between electricity consumption and four different parameters i.e. urban population, rate of urban population growth, steel consumption and steel production in Iran were studied as well. The results show that there are close relation between electricity consumption and the above parameters because the r-squared determined for these parameters are between 0.94 and 0.99
To evaluate the association of each variable over other response variables the rate of correlation is calculated. Based on this, in order to determine each variable as an input variable the neural network method is applied too.
The next stage, by utilizing the determined input, the neural network designed is learned to obtain regulated network parameters for future year predictions. Since the objective of this article is prediction of target variables in the horizons of 2025 the concerned network input shall be used for predictions in the same year. For this purpose, it is assumed that until 2025 war, earthquake and other force major events that may alter the overall pattern of results would not occur, so the overall pattern of data preserved is stable. On this basis, the nonlinear regression equation of each dependent and independent variable as inputs and outputs of the neural network can be obtained. These equations show the created transformations for each data during various years without observation of other variables impacts over them. Keeping the assumption of constant pattern data based is the advantage of these equations when they apply using the required input for power generation prediction up to 2025.
Table 1 exhibit the collected data of electricity generated by Ministry of Energy of Iran [23]. All data are arranged by electricity generation method in Iran during 1995 up to 2014 separately. Certainly, power generation can also occur using other methods such as atomic energy, wind power plant, solar power plant and combined cycle; the power generation with mentioned methods is totally shown in the last column.
TABLE1.THE RESULTS OF POWER GENERATION IN IRAN USING DEFERENT METHODS DURING 1995 TILL 2014(MW)
[image:4.612.61.554.221.405.2]Total Other method Response 2 Response 1 21256 0 1953 19303 1995 21758 0 1969 19789 1996 22580 0 1999 20581 1997 23821 0 1999 21822 1998 24631 0 1999 22632 1999 26655 0 1999 24656 2000 28411 11 1999 26401 2001 31518 503 3028 27987 2002 34328 509 4420 29399 2003 36808 25 5012 31771 2004 40539 37 6043 34459 2005 44870 47 6572 38251 2006 48995 63 7422 41510 2007 52526 63 7672 44791 2008 55756 92 7703 47961 2009 60794 95 8486 52213 2010 64805 116 9745 54944 2011 68503 181 10745 57577 2012 70250 590 11265 58395 2013 73152 631 11785 60736 2014
Production Method Selection
Production method selection varies according to demand and regional conditions. Each power plant has its own advantages and disadvantages. Although rapid technological development makes the hope to reduce the costs of various power plants, some governments, which are the great oil and coal producers, prefer to use the coal, gas and oil for electricity power plant. However, energy production in industrial regions is more economical, and the largest world energy supply resources for electricity include: coal, natural gas, hydroelectric (hydropower), nuclear energy, oil and derivatives; other resources are placed in the same last row. Due to environmental pollution issues, power plants are usually established far from urban and residential areas. When there is high requirement and instant need for electrical energy the power cannot be supplied from some renewable energy such as sunlight and wind power. Further, the type of power used is also important to choose the type of power plant. As an example, gas source can easily be reduced or increased in load; also nuclear power plants can generate high scale of electrical energy easily; and hydropower is usually installed in areas where the ability of water movement from higher attitude to the lower level exists in capacity to drive the turbines. However, this type of power plant is not feasible in Iran because water storage capacity is limited in this country and during the year the consumption load is existed. Iran’s capacity of producing the crude oil and gas is high and in fact its export them to other countries as the 8th producer in the world. Although the renewable energies protect the environment for future generations, the Iranian investors assume that the renewable energy resources such as hydro power, solar power, wind power, tidal etc. in view of present existing technologies are highly costly. Therefore, in a long term the investors in Iran have mostly preferred to produce the electricity via oil and gas resources.
Analysis of Effective Factors on Production Process
In this section, Iran’s collected data in various fields effective on energy consumption are reviewed. The variables used in this study for predicting the future demand of electricity in Iran are as follows:
• GDP per capita
• Oil production (as the main source of Iran’s income) • Urban population (as the main electricity consumer) • Urban population growth (as the stimulus of consumption) • Steel consumption (as the factor of development)
• Steel production (as the main electricity consumer)
and 2014 that rise the electricity consuming. In addition, one of the most electricity consuming industries in Iran is steel factories that affect the electricity demand. Finally, steel consuming from both sources of internal producing and imported one can affect the electricity demand. Thus these factors were chosen as the variable of this study. Table 2 reveals Iran annual statistics for each of these factors. As observed, the presented statistics indicate the increasing trend in general. Even if at times there were some falls in an area, once again it regained and returned to be increased.
TABLE 2–ANNUAL STATISTICS OF EXTERNAL FACTORS
Steel Production (KT) Steel Consumption (KT) Urban population growth (%) Urban population Crude Oil Production (MT) GDP per capita (US $) Year 4696 5370 2.772 36423717 3643 1984.17 1995 5415 6764 2.998 37532395 3686 2091.42 1996 6322 7410 3.023 38684432 3664 2124.13 1997 5602 6500 3.036 39876941 3634 2142.23 1998 6070 6500 2.941 41067266 3557 2145.10 1999 6600 10296 2.746 42210756 3696 2219.42 2000 6916 11412 2.538 43295660 3724 2268.29 2001 7321 12068 2.383 44339692 3444 2407.45 2002 7869 15773 2.267 45356387 3743 2548.03 2003 8682 16139 2.207 46368386 4001 2646.73 2004 9404 17386 2.187 47393548 4139 2737.11 2005 9789 16276 2.171 48433711 4028 2864.78 2006 10051 21191 2.078 49450701 3912 3053.12 2007 9964 16517 2.038 50468799 4050 3034.84 2008 10908 19535 2.048 51513162 4037 3116.58 2009 11995 21720 2.068 52589754 4080 3259.40 2010 13197 23268 2.093 53702091 4054 3314.36 2011 14463 20199 2.113 54849058 3387 3369.12 2012 15422 18592 2.094 56009792 3113 3131.80 2013 15946 21670 1.900 56812925 3471 3488.00 2014
One of the main descriptions in statistics is defining the correlation and the relation between two variables. In general, the intensity of dependency of two variables with each other is called correlation and there is a possibility that in addition to dependency intensity the researcher may also need to be informed of correlation direction. In statistics there are a number of various correlation coefficients that each measures the rate of correlation between two variables taking into accounts the type of data and the conditions of variables. In general correlation coefficient varies from -1 to 1; the relation between two variables can either be positive or negative. There is some significance in correlation coefficient that must be mentioned. Correlation coefficient is a symmetrical relationship, the more the correlation coefficient proximate one the higher rate of variable dependency. However, it should be observed that this dependency is not to the significance of cause and effect and correlation coefficient does not definitely mean cause and effect. However, if other variables effect the dependent variable then there is a probability that each covariance shares an independent variable and have wrong effect on correlation coefficient with independent variable. Generally, in correlation coefficient this can be studied for the existence of nonlinear relation between two correlated variables while correlation coefficient shows this inaccurately.
From among correlation coefficient types, Pearson’s, based on covariance of two variables and their standard deviation was applied for this research to evaluate and calculate in accordance with Pearson correlation coefficient.
y x
y
x
P
)
,
cov(
In this section, initially the issue is studied to discover the effect of changes on independent variables over changes on dependent variables; in order to perform the investigations, the data in Table 3 were categorized such that each column belong to one variable. Next, independent variables correlation was compared with dependent variables. The following Table represents the corresponding values of correlation (C) and P-value (P):
0.0000 0.9809
0.0000 0.9780
0.0000 0.9776
Steel Production
0.0000 0.9769
0.0000 0.9721
0.0000 0.9763
GDP per capita
0.0000 -0.8591
0.0000 -0.8620
0.0000 -0.8554
Urban population growth
0.9847 -0.0046
0.9906 0.0028
0.9942 0.0017
Crude Oil Production
0.0000 0.9807
0.0000 0.9680
0.0000 0.9806
Urban population
Discussion & Conclusion Analysis
The inputs of neural network used in this research are shown in table 4. It is important that in this study using available data and the considerations of time series for each target variable, the rate of produced energy for the current year and the previous year were also added to select inputs in the previous section.
TABLE 4.THE INPUTS AND OUTPUT OF NEURAL NETWORK IN THIS STUDY
Input 7 Input 6
Input 5 Input 4
Input 3 Input 2
Input 1 Output
Urban population in this year Urban
population growth in this year GDP per
capita in this year Steel
Production in this year Steel
Consumption in this year Power
consumption
in the
previous year Power
consumption in this year Power
consumption in the next year
The number of input nodes and also the neural network output can be determined via offered network mapping. In this research since there are seven independent variables and one dependent variable, the number of nodes in the input layer is 7 and the number of nodes in the output layer is one. However, a suitable method to determine the numbers of hidden layers and nodes in each layer and also the type of transfer function is use of trial and error; such that if the numbers of hidden layers and neurons of each layer are insufficient the network will not present right optimal converge solution and if the numbers are more than what required, the network becomes unstable.
FIG.4-DEMONSTRATION OF TEST & TRAINING DATA PROCESS AND HEATER POWER GENERATION METHOD
In Figure 5 a survey on test & training data collection for establishing neural network (ANN) is presented. In designing this information network, the total national power generation is utilized and Figure 8b shows the combination of all data for different power generation methods
FIG.5-DEMONSTRATION OF TEST & TRAINING DATA PROCESS FOR ALL METHODS OF POWER GENERATION IN IRAN
-1 -0.5 0 0.5 1
(a
1)
TrainData TrainNet
-1 -0.5 0 0.5 1
(b
1)
TestData TestNet
-1 -0.5 0 0.5 1
-1 -0.5 0 0.5 1
TrainData
Tr
a
in
N
e
t
(a2)
-1 -0.5 0 0.5 1
-1 -0.5 0 0.5 1
TestData
Te
s
tN
e
t
(b2)
-1 -0.5 0 0.5 1 1.5
(a
1)
TrainData TrainNet
-1 -0.5 0 0.5 1 1.5
(b
1)
TestData TestNet
-1 -0.5 0 0.5 1
-1 -0.5 0 0.5 1 1.5
TrainData
Tr
a
in
N
e
t
(a
2)
-1 -0.5 0 0.5 1
-1 -0.5 0 0.5 1 1.5
TestData
Te
s
tN
e
t
(b
In all prediction methods the error and the uncertainty is unavoidable. Therefore, to establish a predicted model and select of the best model among various existing ones in a time series an index is required to find the certainty of acceptance or rejection of adopted predicted model. In general, the more proximity of actual series (yt) to predicted value (y^t) shows the more model accuracy. Therefore, the quality of a model is evaluated on the basis of predicted error as follows:
t t
t
y
y
e
^
Prediction error is caused by ignore of one or more components of time series predictions like trend, seasonal and cyclical effects. Also, the error could be due to irregular and erratic fluctuations in data source. In this case, total errors that can be observed by a prediction method is determined as follows:
] [
1
^
n
t
t
y y
y SE
where n is the number of observed duration.
This error can be determined in a different method using the mean squared error (MSE) as follows:
n
y
y
MSE
n
t
t
y
]
[
1
^
In Table 5 the obtained MSE for each test and training data is demonstrated. It is worth mentioning that test and training dataset is randomly selected thus data set 3, 7 and 17 are selected as data test and the rest are considered as training data. Results in Table 5 shows that the determined error using the test data is acceptable.
TABLE 5–MSE VALUES OBTAINED FROM TEST AND TRAINING DATA
Test MSE
Train MSE
Method
0.0029
7.6028e-05
Response 1
0.0023
9.7939e-05
Response 2
0.0086
9.6952e-04
Total
Using the network designed in this study and based on real data collected in 18 years, the feasibility of the types of energy production and the rate of production for the coming year is anticipated. Table 6 indicates the predicted values for the generation methods of electricity in Iran in 2015.
TABLE 6.PREDICTED VALUES OF 2014 FOR ELECTRICITY GENERATION METHODS (KW).
2015
Method
60148.3031
Response 1
11696.8009
Response 2
72826.0896
Total
As in the methodology used was explained, for predicting the energy producing with various methods in 2025, data pattern should be assumed steady i.e. without a significant change up to 2025. Therefore, a proper regression method can be used to estimate the input data for neural network.
It must be noted that when an equation is solely used for predictions there may not necessary to have a cause and effect relation. In this case, it is required to have the reliable data relevance to use a proper regression model. The followings methods are used as the Multi-purpose regression models:
• Data description
• Evaluation of parameters • Prediction & estimation • Control
2 2 1 0
)
(
x
b
b
x
b
x
f
TABLE 7.COEFFICIENT FOR EACH EQUATION
Adjusted R-square R-square b2 b1 b0 Method 0.9901 0.9912 72.75 870.6 17180 Response 1 0.9716 0.9746 19.91 159.7 1156 Response 2 0.9926 9933 94.18 1017 18400 Total 0.9662 0.9608 0.06988 81.34 1833
GDP per capita
0.9027 0.9129 -35.53 1690 2084 Steel Consumption 0.9825 0.9843 25.29 47.29 5257 Steel Production 0.8633 0.8777 0.003002 -0.1225 3.24
Urban population Growth
0.9997 0.9997 -2637 1123000 35400000 Urban population
In this study the coefficient of determination, denoted R squared, is used to indicate how well the input data are fitted to the introduced statistical model. Table 7 shows that the regression models in this study are accurate because the R-squares and Adjust R- squares determined are higher than 0.87 and 0.85 relatively.
Figures 6 (a-e) and 7 (a-e) clearly show the fitness of data and curves obtained from regression equations are fairly adequate.
FIG.6–REGRESSION EQUATION FOR EFFECTIVE VARIABLES ON POWER GENERATION PROCESS (A)STEEL CONSUMPTION (B)STEEL
PRODUCTION (C)GDP PER CAPITA (D)URBAN POPULATION GROWTH (E)URBAN POPULATION
0 10 20
0 0.5 1 1.5 2 2.5x 10
4 (a)
0 10 20
0.4 0.6 0.8 1 1.2 1.4 1.6 1.8x 10
4 (b)
0 10 20
1800 2000 2200 2400 2600 2800 3000 3200 3400 3600 (c)
0 10 20
1.8 2 2.2 2.4 2.6 2.8 3 3.2 (d)
0 10 20
3.5 4 4.5 5 5.5
6x 10
7 (e)
0 5 10 15 20 1 2 3 4 5 6 7x 10
4 (a)
0 5 10 15 20 0 2000 4000 6000 8000 10000 12000 14000 (b)
0 5 10 15 20 1 2 3 4 5 6 7 8x 10
FIG.7–REGRESSION EQUATION FOR VARIOUS POWER GENERATION METHODS (A)RESPONSE 1(B)RESPONSE 2(C)TOTAL
Using the inputs obtained from regression models, the electricity generations between 2015 and 2025 are estimated by the developed neural network. The results of power generation methods in the predicted decade are presented in Table 8.
TABLE 8.THE ELECTRICITY GENERATION PREDICTED IN 2025 USING THE DEVELOPED NEURAL NETWORK (KW).
2025 Method
103022.546 Response 1
22531.6043 Response 2
128584.462 Total
Since Iran is an arid country with low precipitation, the increase of hydropower electricity is not probable. Also, past experiences and prolongation of nuclear power plant operation in Iran (34 years) state that increase of power generation using the atomic method during the following decade is not easily feasible. Also, the presented information by the Iran Ministry of Energy [23] states that during 1967 – 2014 capacity of power generations using renewable methods (non-atomic) limited to 193 MW. Consequently, it is anticipated that within the next future decade the tendency to develop the power generation in Iran using the renewable resources is still constrained because the fossil energy in Iran is quiet cheap.
Thereupon, the share of production increase in hydropower sectors and the two other methods of gas and steam turbines are subdivided. In consideration of the fact that by looking at Table 8 the ratio of heater to gaseous is 0.2290 and also since it is assumed that the rate of hydropower and other methods will remain stable, Table 9 in respect to power generation anticipation will be then replaced to Table 8.
TABLE 9.POWER GENERATION PREDICTION FOR THE YEAR 2025(KW)
2025 Method
113769.150 Response 1
11785 Response 2
128584.462 Total
Nowadays Iran is producing the electricity using different resources i.e. gaseous, steam, nuclear and renewable resources. However, the low price of fossil fuel in Iran and the time consuming of some power plant constructing affect the outcome of investment in future of power plan in the country in the remaining time of vision documentary. On the words, it seems that fossil fuel is inexpensive and highly in access in Iran. This may have developed the urge of investment on Iran power generation using oil and gas; the said sole 0.1% of total national capacity was generated using various methods like solar energy, wind energy and geothermal [15]. That is why the present study endeavors to estimate the required costs of investment on power industry principally on the basis of fossil fuels. Needed Estimated Investment to Generate Electricity
Based on estimated prices in [19, 20] for electricity generation, the require investment for various methods per kilowatt is demonstrated in Table 10.
TABLE 10.THE INVESTMENT FOR PRODUCING ONE KILOWATT ELECTRICITY IN USDOLLARS
Response 2 Response 1
18.65 29.4150
Using Tables 9 & 10 the total investment for electricity generation in Iran 2025 is estimated as shown in Table 11.
TABLE 11.REQUIRE INVESTMENT FOR ELECTRICITY IN YEAR 2025 IN USDOLLARS
Response 2 Response 1
219790.25 3346519.547
CONCLUSION
Economy of Iran is growing due to having the young and educated people who want to use and enhance the great potentials of mining and industries of Iran. Therefore, Iran is going to increase generation capacity of electricity, and this issue depends highly on extensive investments in this term. In the absence of necessary investment, the country must resort to energy import or otherwise Iran will face to a large-scale blackout. In view of the fact that most neighboring countries are politically unstable and insecure, the energy import is not reliable for the future decade in terms of industry, agriculture and household use. Therefore, this survey, by application of developed methodology, is aimed to determine the required investment in electricity generation in Iran. Therefore, initially the effective factors of Iran power generation were identified based on the rate of dependency to target variable factors. These factors are GDP per capita, urban population (as the main electricity consumer), urban population growth (as the stimulus of consumption), steel consumption (as the factor of development) and steel production (as the main electricity consumer)
A neural network was used combining with a regression method. The considered inputs in designing the neural network were prepared using the identified factors and trends of electricity production data during the last 18 years in Iran. The developed neural network in this study combining with the regression equations predicts the power generation for year 2025 as the vision of Iran. The past overview of investment in Iran electricity industry demonstrates the analysis of national power generation. Based on this analysis the generation of electricity using the atomic energy in the next decade is not feasible because ten years is not adequate to construct a new atomic power plant. In addition, other renewable sources of energies in Iran are not actually economic because fossil fuels are fairly cheap in Iran. Hence, investment process of coming decade is tended to gas and steam power generation in electricity industry. Therefore, the investment equivalent to 32526411.48 US $ must be considered by Iran’s government in the power plant for the next decade.
REFERENCE
[1] Alireza Askarzadeh, Comparison of particle swarm optimization and other metaheuristics on electricity demand estimation: A case study of Iran, Energy, Volume 72, 2014, Pages 484–491.
[2] Elham Pourazarm, Arusha Cooray, Estimating and forecasting residential electricity demand in Iran, Economic Modelling, Volume 35, 2013, Pages 546–558.
[3] Anwar Hussain, Muhammad Rahman, Junaid Alam Memon, Forecasting electricity consumption in Pakistan: the way forward, Energy Policy, Volume 90, 2016, Pages 73–80.
[4] Fatih Karanfil, Yuanjing Li, Electricity consumption and economic growth: Exploring panel-specific differences, Energy Policy, Volume 82, 2015, Pages 264– 277.
[5] Hector Pollitt, Seung-Joon Park, Soocheol Lee, Kazuhiro Ueta, An economic and environmental assessment of future electricity generation mixes in Japan – an assessment using the E3MG macro-econometric model, Energy Policy, Volume 67, 2014, Pages 243–254.
[6] Chor Foon Tang, Muhammad Shahbaz, Mohamed Arouri, Re-investigating the electricity consumption and economic growth nexus in Portugal, Energy Policy, Volume 62, 2013, Pages 1515–1524.
[7] http://www.worldbank.org/en/country/iran/overview.
[8] http://energyatlas.iea.org.
[9] Kaytez, F., Taplamacioglu, M. C., Cam, E., &Hardalac, F. (2015). Forecasting electricity consumption: A comparison of regression analysis, neural networks and least squares support vector machines. International Journal of Electrical Power & Energy Systems, 67, 431-438.
[10] Zhang, P., & Wang, H. (2012). Fuzzy wavelet neural networks for city electric energy consumption forecasting. Energy Procedia, 17, 1332-1338.
[11] Saravanan,S. Kannan,S.Thangaraj,C.(2012). Forecasting India's Electricity Demand Using Artificial Neural Network. International Conference on Advances in Engineering, Science and Management (ICAESM -2012).79-83.
[12] Marwala,L. Twala,B.(2014). Forecasting electricity consumption in South Africa:ARMA, Neural networks and Neuro-fuzzy systems. 2014 International Joint Conference on Neural Networks (IJCNN) July 6-11, 2014, Beijing, China.3049-3055.
[13] Azadeh,F. Ghaderi,S.F. Sohrabkhani,S.(2008). Annual electricity consumption forecasting by neural network in high energy consuming industrial sectors. Energy Conversion and Management 49 (2008) 2272–2278.
[14] A. Azadeh, S.F. Ghaderi, S. Sohrabkhani, A simulated-based neural network algorithm for forecasting electrical energy consumption in Iran, Energy Policy, Volume 36, Issue 7, July 2008, Pages 2637–2644.
[15] Ringwood. J. V, Bofelli, D (2000). Forecasting Electricity Demand on Short, Medium and Long Time Scales Using Neural Networks. Journal of Intelligent and Robotic Systems 31: 129–147, 2001.
[16] Marvuglia,A. Antonio Messineo,A.(2011). Using Recurrent Artificial Neural Networks to Forecast Household Electricity Consumption. Energy Procedia 14 (2012).45-55.
[17] Hassan, S., Khosravi, A., &Jaafar, J. (2015). Examining performance of aggregation algorithms for neural network-based electricity demand forecasting. International Journal of Electrical Power & Energy Systems, 64, 1098-1105.
[18] Xiufeng, S., &Jian, Z. (2011). Electric power consumption forecast of life energy sources based on fuzzy neural network. IT in Medicine and Education (ITME), International Symposium on (Vol. 1, pp. 309-312).IEEE.
[19] Xing-ping, Z., &Jia-hai, Y. (2008, November). Electricity Consumption Forecasting Based on Improved BP Neural Network. In Risk Management & Engineering Management, 2008.ICRMEM'08. International Conference on (pp. 357-360). IEEE.
[20] Warren S, McCulloch, Walter H, Pitts (19943). A Logical calculus of the ideas immanent in nervous activity. Bulletin of mathematical biophysics, Vol. 5, 115-133
[21] Amin Bennouna , Charaf El Hebil (2015) Energy needs for Morocco 2030, as obtained from GDP-energy and GDP-energy intensity correlations, Energy policy, Vol. 88, 45-55.
[22] Nicholas Apergis, Chor Foon Tang (2013). Is the energy-led growth hypothesis valid new evidence from a sample of 85 countries, Energy Economics 38 (2013) 24–31.
AUTHORS
First Author – Arash Zare Talab, Department of Industrial Technology, Amirkabir University of Technology. 424. Hafez St. Tehran.
Iran. [email protected].
Second Author – Fahimeh Kianian, Niroo. Niroo Research Institute (NRI). Shahrak Qodes. Tehran. Iran.
Third Author -Hamidreza Shahabi Haghighi, PHD, Department of Industrial Technology, Amirkabir University of Technology. 424. Hafez St. Tehran. Iran. [email protected].