Energy Efficient Data Transmission using PID based
Data Prediction System
Akshay Joshi
M.E. Student
Department of E & TC Engineering IET, DAVV, Indore
Dhiiraj Nitnawwre
Assistant Professor
Department of E & TC Engineering IET, DAVV, Indore
ABSTRACT
In the recent years of medical science, we have to see that the wireless body sensors are used everywhere. These technologies have made our life secure and comfortable. These sensors are widely used because of its weight is very light and size is very small. To design body sensor networks we have to face the main issue of energy efficient data transmission. The continuous data transmission is an important part of the network due to need of continuous attention. To reduce the heavy traffic on the network, prediction-based data transmission approach may be use for transmission. This technique combines a dual prediction flowchart and a low-complexity prediction algorithm that takes advantage of PID (Proportional Integral Derivative) control. The energy gain and RMSE are use as performance parameters.
Keywords
WBSN,PID,RMSE,WSN
1.
INTRODUCTION
In recent years wireless sensor networks are used in many different-different areas like wide area monitoring, military application, commercial application and also in biomedical history. It is used in wide areas because of it is low power microscopic sensors with wireless communication capability. These sensors are in a small physical size so it can be embedded in the physical environment [1, 2]. With an increasing number of wireless sensors becoming commercially available, WSNs have been enabling abroad range of novel applications, among which human health monitoring is a typical example. Continuous health monitoring is a key technology for realizing the transition of current healthcare systems to more proactive and affordable healthcare, especially for the elderly. Wireless communications, especially the personal area networking standards such as IEEE 802.15.1 (Bluetooth), 802.15.4 (Zigbee), and 802.15.6 (the work-in-progress body area network protocol), many physiological sensors have transformed into wireless sensors in possession of sensing, computing, and (wireless) communication capabilities [2].
Wireless body sensors are getting to be prominent in health awareness applications. Since they are either worn or embedded into human body, these sensors must be little in size and light in weight. A typical body sensor network with wireless communication is shown in the figure 1.
2.
BODY
SENSOR
NETWORKS
Body sensor networks constitute an exceptional class of Wireless sensor networks. Like ordinary remote sensors, body sensors are regularly involved four principle segments, a sensing unit, a processing unit, a communication unit (i.e. transceiver), and a power supply unit[3, 4].
Fig.1. Wireless Body Area network scheme [9]
A BSN comprise of various wireless body sensor nodes, which measure assorted physiological phenomena of a human body, for example blood oxygen, electrocardiography (ECG), electroencephalography (EEG), electromyogram (EMG), central venous pressure (CVP), respiratory impedance, pulmonary arterial pressure (PAP), and temperature. For the most part, there is an extra base station (also called sink) perhaps worked by a cell telephone or a PDA (Personal Digital Assistant), etc. Healthcare systems based upon BSNs can possibly change how people’s health is monitored, and how the damages of acute events are minimized. For instance, health data collection is traditionally conducted intermittently [8]. A BSN often contains a certain number of body sensor nodes and a base station. Each sensor node, either wearable or implanted into the human body, monitors a certain physiological parameter. It transmits (via a wireless link) sampled data to the base station, which is responsible for collecting the data from all sensor nodes and in some cases forwarding them to a remote data center on the Internet through a WLAN (wireless local area network) or cellular network [7, 8].
3.
PID
BASED
DATA
PREDICTION
FOR
TRANSMISSION
20 The basic role of the controller is to adjust the manipulated
[image:2.595.64.281.132.218.2]variable u with respect to the control error e such that the system output (i.e. controlled variable) y will approach the setpoints. The control error is the difference between the setpoint and the actual system output, i.e., e=r −y.
Fig. 2. PID based data communication
As the name implies, a PID controller is comprised of three components: proportional, integral and derivative control. The input/output relation for an ideal PID controller can be written mathematically as:
u = e + +
Where is the proportional gain, the integral gain, the derivative gain and, t is the point of time, with the first three coefficient called controller parameters. From a functionality perspective, the proportional component produces a control action proportional to the control error; the integral component mitigates steady-state errors through low-frequency compensation by an integrator; the derivative component improves transient response through providing the controller with an anticipative ability.
As described above, the original PID algorithm is devised for feedback control. In order to apply it to data prediction, some modifications must be made. The prediction algorithm used in this work is given by:
= f ( , ,…………, )
Like the PID controller, the above prediction algorithm consists of three components:
• The ‘proportional’ term attempts to track the changes in the sampled values quickly by assuming that the current value will remain close, to some extent, to the last record. The dependency between the predicted value and the last record is determined by the proportional gain .
• The ‘integral’ term
considers a longer history of
the records than the proportional term. It is based on the point of view that the current value will be close to the mean of the previous M consecutive samples. This term contributes to mitigate the impact of measurement noise but makes the predictor to response more slowly to changes.
The ‘derivative’ term ( ) assumes that the rate
of change (in the values of the physiological parameter) is likely to remain the same as in the last interval. This term represents a prediction of the change in value.
We record the root mean squared error (RMSE), which is calculated as:
RMSE =
4.
SYSTEM
DESCRIPTION
[image:2.595.321.554.199.327.2]The data predication based transmission is shown in figure 3. The data sources are medical data. The M length queue has been used for initial data. Up to length M no prediction on the data [5, 6].
Fig. 3 Data transmission scheme of system
5.
RESULT
There are 3 biological data has been used in this paper. The data type is given below
5.1
ECG DATA (electrocardiography)
ECG signal has four data features P, Q, R, S.
Fig.4 Signal (P-feature)
[image:2.595.327.541.416.697.2] [image:2.595.81.264.474.527.2]
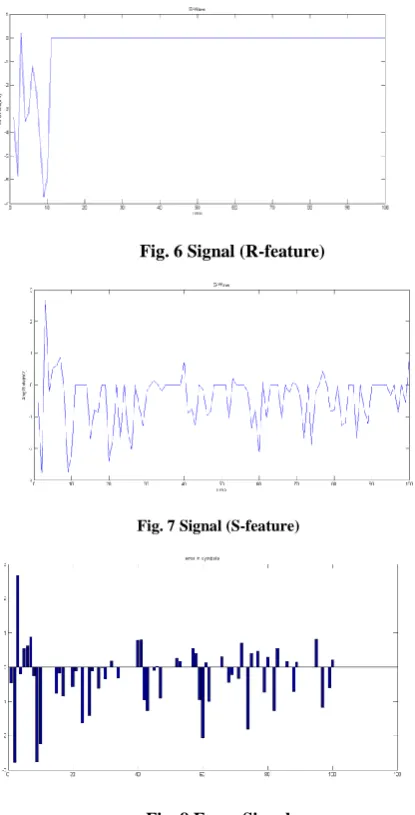
Fig. 6 Signal (R-feature)
Fig. 7 Signal (S-feature)
[image:3.595.331.532.71.499.2]Fig. 8 Error Signal
Table 1: Values of P, Q, R, S Feature for ECG Signal
P Q R S
Error Rate 0.618261 1.846441 1.318843 0.758710 Mean
Absolute Error
0.382246 3.409343 1.739347 0.575641
Energy of the Transmissi
on
259.8980 22
259.8980 22
259.8980 22
259.8980 22
Energy of Prediction based Transmissi
on
189.7838 61
275.7132 10
248.4113 62
165.2160 24
Energy Gain
70.11416 1
15.81518 9
11.48666 0
94.68199 7 Percentage
Gain in Energy
26.97756 6
6.085152 4.419680 36.43044 2
5.2
EEG DATA (electroencephalography)
EEG data has six data features Delta, Theta, Alpha, Beta, Gamma, Mu (µ).
Fig. 9 Signal (Delta-feature)
Fig. 10 Signal (Theta-feature)
Fig. 11 Signal (Alpha-feature)
Fig. 12 Signal (Beta-feature)
[image:3.595.62.270.73.481.2] [image:3.595.48.296.510.714.2]22
Fig. 14 Signal (Mu (µ)-feature)
Fig. 15 Error Signal
Table 2: Values of Delta, Theta, Alpha, Beta, Gamma, Mu (µ)
Delta Theta Alpha Beta Gamma Mu(µ) Error Rate 0.7684 0.8862 1.0850 0.8360 0.7285 0.8774
Mean Absolute
Error
0.5905 0.7855 1.1772 0.6990 0.5307 0.7699
Energy of the Transmission
178.684 178.684 178.684 178.684 178.684 178.684
Energy of Prediction based Transmission
92.959 103.50 62.965 99.993 98.630 87.342
Energy Gain 85.725 75.180 115.71 78.691 80.054 91.342 Percentage
Gain in Energy
47.975 42.074 64.761 44.039 44.802 51.119
5.3 PAP (pulmonary arterial pressure)
[image:4.595.80.284.73.342.2]PAP has Two Features Systolic and Diastolic.
[image:4.595.312.522.75.336.2]Fig. 16 Signal (Systolic-feature)
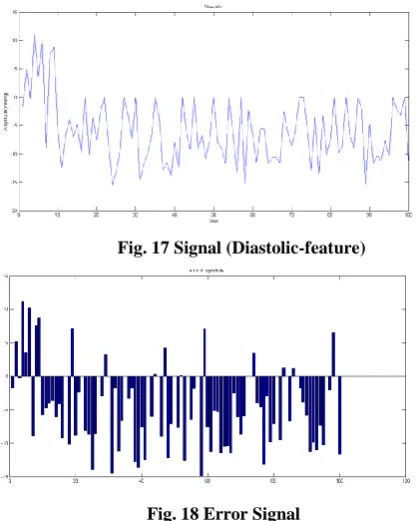
Fig. 17 Signal (Diastolic-feature)
Fig. 18 Error Signal
GUI (Graphical User Interface)
Fig. 19 GUI for Evaluating Signal
Table 3: Value for Systolic and Diastolic feature for PAP
Systolic Diastolic
Error Rate 6.847459 7.289190
Mean Absolute Error 46.887697 53.132290 Energy of the
Transmission
10319.797651 10319.797651
Energy of Prediction based Transmission
4341.117433 4483.771023
Energy Gain 5978.680218 5836.026628 Percentage Gain in
Energy
57.934084 56.551754
6.
CONCLUSION
[image:4.595.59.264.586.696.2]prediction based method. There is possibility to optimize the PID coefficient further to reduce the error and enhance the energy gain.
7.
ACKNOWLEDGEMENT
I acknowledge HOD, for their valuable guidance and support. I acknowledge my colleagues for their support during my work.
8.
REFERENCES
[1] Mark A. Hanson, Harry C. Powell Jr., Adam T. Barth, Kyle Ringgenberg, Benton H. Calhoun, James H. Aylor, John Lach, Jan.2009 "Body Area Sensor Networks: Challenges and Opportunities," IEEE Computer, vol. 42, no. 1, pp. 58-65.
[2] E. Jovanov, C.Y. Poon, G.Z. Yang, Y.T. Zhang, November 2009 “Guest Editorial Body Sensor Networks: From Theory to Emerging Applications,” IEEE Transactions on Information Technology in Biomedicine, Vol.13, Issue 6, pp. 859- 864.
[3] Andrew D. Jurik, Alfred C. Weaver, Jan./Feb.2009 "Body Sensors: Wireless Access to Physiological Data," IEEE Software, vol. 26, no. 1, pp. 71-73.
[4] S. Xiao, A. Dhamdhere, V. Sivaraman, and A. Burdett, Jan 2009, "Transmission Power Control in Body Area Sensor Networks for Healthcare Monitoring", IEEE Journal on Selected Areas in Communications, Special Issue on Body Area Networking, 27(1):37-48.
[5] Y.-Ä. Le Borgne, S. Santini and G. Bontempi, 2007 “Adaptive Model Selection for Time Series Prediction in Wireless Sensor Networks”, Signal Processing, 87 (12): 3010–3020.
[6] A. Jain, E.Y. Chang, Y.-F. Wang,June 13–18, 2004, “Adaptive stream resource management using Kalman filters”, in: Proc. ACM International Conference on Management of Data (SIGMOD2004), Paris (France), pp. 11–22.
[7] D. Tulone, S. Madden, 2006 “PAQ: time series forecasting for approximate query answering in sensor networks”, in: Proc. 3rd European Conference on Wireless Sensor Networks (EWSN06), February 21–37.
[8] D. Chu, A. Deshpande, J.M. Hellerstein, W. Hong, April 3– 8, 2006 “Approximate data collection in sensor networks using probabilistic models”, in:Proc22ndInternational Conference on Data Engineering (ICDE06), Atlanta, GA.
[9] Jamil Y. Khan, Mehmet R. Yuce, and Farbood Karami, , 2008 “Performance Evaluation of a Wireless Body Area Sensor Network for Remote Patient Monitoring” , Engineering in Medicine and Biology Society 30th Annual International Conference of the IEEE.
[10]K.H. Ang, G.C.Y. Chong, and Y. Li, 2005 “PID control system analysis, design, and technology”, IEEE Transactions on Control Systems Technology, 13 (4): 559-576.
[11]