http://dx.doi.org/10.4236/ojbm.2014.22014
Measuring the Correlation between
Commercial and Economic States of
Countries (B2G Relations) and the
E-Government Readiness Index by
Using Neural Networks
Mehmet Sinan Başar
1, Hande Küçükönder
21Open Education Faculty, Ataturk University, Erzurum, Turkey
2Faculty of Economics and Admninistrative Sciences, Bartın University, Bartın, Turkey
Email: [email protected], [email protected]
Received 23 January 2014; revised 23 February 2014; accepted 27 March 2014
Copyright © 2014 by authors and Scientific Research Publishing Inc.
This work is licensed under the Creative Commons Attribution International License (CC BY). http://creativecommons.org/licenses/by/4.0/
Abstract
The E-government Readiness Index is a composite index created from the Neural Index, the Tele-communication Infrastructure Index and the Human Resources Index. Calculated annually by the World Bank, this index offers information on such issues as the provision of public services and the use of these services by individuals and institutions. In this study, we examine whether the E-government Readiness Index provides information on the compliance of the business lives of countries with an e-government structure by using neural networks.
Keywords
Neural Networks; E-Government; E-Government Readiness Index; E-Commerce; Information Technologies
1. Introduction
process cannot be regarded as complete with the compliance of citizens in this process. Institutions that interact with each other also have to comply with the relevant e-government structure. Consequently, public institutions, business environments, non-governmental organizations, and citizens should reorganize themselves, and tradi-tional approaches should be restructured with information and communication technologies. As in conventradi-tional government structures, different individuals and institutions might perceive e-government in different ways. In this sense, the concept of e-government is related to how individuals perceive e-government. The definition of e-government might be different for people of different positions and jobs.
To measure countries’ state of readiness for e-government and their position among other countries, a scale was developed. This scale, which is assessed and announced by the United Nations, is called the E-government Readiness Index. This composite index is assessed based on Web site assessment, telecommunication infra-structure, and human resources endowment. For the Web site index the level of development of services pro-vided on public Web sites is measured particularly by health, education, social security, and finance, which is in the first place. The Telecommunication Infrastructure Index is calculated based on six basic infrastructural indi-cators. These indicators are: PC’s per 1000 persons, Internet users per 1000 persons, Telephone Lines per 1000 persons, Online population, Mobile phones per 1000 persons and TV’s per 1000 persons. The Human Capital Index is measured based on two indicators. These are: adult literacy and the rate of students enrolled in primary, secondary, and higher education institutions [4]. Once this E-government Readiness Index has been calculated using the above-mentioned indicators, countries can figure out where they stand in this process by looking at former samples. Reaping the benefits of their services provided within a plan is a justifiable source of pride for countries as a representation of their technological competitive power and development level, because e-gov- ernment structuring not only keeps up with technology but with technological improvement. Fundamentally, it is a system demanded and structured via social, economic, and cultural development. Thus, the E-government Rea- diness Index is not only a technological index but also an indicator of development in all fields.
The E-government Readiness Index can be an indication of the delivery of public services and the utilization of these services by individuals and institutions as well as an indication of whether social, commercial, and cul-tural lives, for example, are organized in compliance with e-government or not. However, assessing the degree of this relation requires a separate study for each variable.
2. Materials and Method
2.1. Neural Networks
Neural networks (NN) are a kind of computer software, which is inspired by the working mechanism of the hu-man brain and which is composed of a set of process elements, each of which has its own memory and processes data. A neural network is composed of three main structures. These are neurons, neuron connections and learn-ing algorithms. Also in neural networks, which are designed by imitatlearn-ing the characteristics of biological neural nerve cells, the processing mechanism of the data is designed as input, interlayer, and output [5]. The structure of an artificial neuron is shown in Figure 1.
The structure that artificial neurons make up as layers and in parallel with each other constitutes the overall structure of NN. These layers have three components: input, interlayer, and output. The overall structure of neural networks is shown in Figure 2.
Figure 1. Structure of an artificial neuron [5].
Figure 2. Overall structure of neural networks [6].
2.2. Data
The data used as independent variables in this study are taken from the World Bank’s Enterprise Survey’s Indi-cators data set [7]. Enterprise Surveys provide the world’s most comprehensive company―level data in emerg-ing markets and developemerg-ing economies. Data are used to create indicators that benchmark the quality of the business and investment climate across countries. The dependent variable E-government Readiness Index values of the study are acquired using World Bank data [8].
After the table creating with the values of all variables and removing the lines with missing data, E-govern- ment Readiness Index values of 60 countries and 13 independent variables included in the model.
The independent variables used in this study are listed below:
• Average wait, in days, experienced to obtain import license from the day the establishment applied for it to the day it was granted.
• Average number of days to clear direct exports through customs.
• Average number of days to clear imports from customs.
• Percentage of establishments that consider Access to Finance as a major obstacle.
• Percentage of establishments that consider Access to Land as a major obstacle.
• Percentage of establishments that consider Licenses & Permits as a major obstacle.
• Percentage of establishments that consider Customs & Trade Reg as a major obstacle.
• Percentage of establishments that consider Electricity as a major obstacle.
• Percentage of establishments that consider Inadequately educated workforce as a major obstacle.
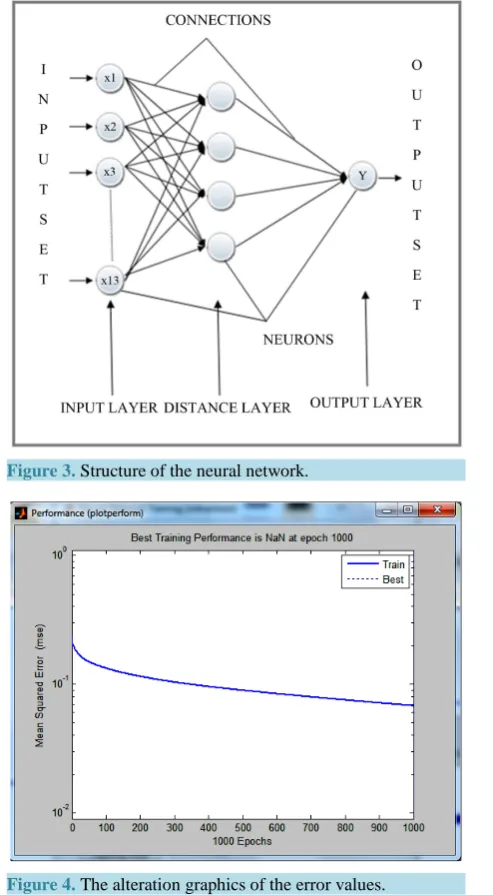
recasting” models [9]. Similarly, based on MAPE value [8] classified models as “best” (less than 10%), “good” (10% - 20%), “acceptable” (20% - 50%) and “false” more than 5012 different parameters were defined to e-government data as input data; the interlayer number was set as 1; and the number of neurons in the interlayer was set as 4 in the neural network. And in that case, the network architecture was designed as 13-4-1. Gradiant Descent Algorithm (GD) was used as the learning algorithm of the network. The training of this designed net-work was done in 1000 iterations. The training of the netnet-work ended with the completion of iteration and the following results were obtained.
Gradiant Descent Algorithm (GD)
The number of variables (Input Layer) 13
The number of Distance Layer 1
Neuron Per Distance Layer 4
Transfer Function of Input Layer Tangent Sigmoid
Transfer Function of Distance Layer Tangent Sigmoid
The number of variables (Output Layer) 1
Transfer Function of Output Layer Tangent Sigmoid
Learning Algorithm Gradiant Descent
MAE Training 18.84
MAE Test 143.76
MAE Validity 63.22
MAPE Training 0.0854
MAPE Test 0.2716
MAPE Validity 0.154
RMSE Training 0.1068
RMSE Test 0.2716
RMSE Validity 0.1775
The structure of the Neural Network is shown in Figure 3.
Output graphics of error values calculated according to GD algorithm is shown in Figure 4.
4. Results
Figure 3. Structure of the neural network.
Figure 4. The alteration graphics of the error values.
sults obtained converged the minimum error to actual observation values. It can be said that in this instance, NN provided rather successful results. Thus, it can be concluded that the commercial and economic life in countries where the E-government Readiness Index value is high, is better organized, and those countries have more ef-fective relations with public institutions than those countries where index values are low.
References
[1] Maeve, P. (2006) Local E-Government and Devolution: Electronic Service Delivery in Northern Ireland. Local Gov-ernment Studies, 32, 41-53.
[2] Roy, J. (2006) E-Governmnet in Canada: Transformation for Digital Age. Ottawa University of Ottawa Press, Ottawa, 69.
[3] Silcock, R. (2001) What Is E-Government. Parlimentary Affairs. 54, 88 http://dx.doi.org/10.1093/pa/54.1.88
[4] http://unpan3.un.org/egovkb/egovernment_overview
[5] Haykin, S. (1999) Neural Networks, a Comprehensive Foundation. 2nd Edition, Prentice-Hall Inc., New Jersey.
![Figure 2. Overall structure of neural networks [6]](https://thumb-us.123doks.com/thumbv2/123dok_us/8040017.771183/3.595.196.431.175.449/figure-overall-structure-of-neural-networks.webp)