Efficient Data Management in Wireless Sensor
Network using Source Location Privacy
S. Usha Rani1, Mr. R.Marthandan2
1
PG student, 2Assistant Professor, Department of Electronics and communication Adhiyamaan college of Engineering,Hosur
Abstract--Wireless sensor networks (WSNs) have been gained worldwide attention for use in different applications. In this paper we present efficient data gathering technique that assures the Qos and following network performance metrics in WSN: 1) The minimum total energy consumption 2) minimum unit data transmitting energy consumption; and 3) maximum utilization efficiency defined as network lifetime per unit deployment. Sensor node close to the sink node fails early due to heavy traffic destined to the sink node. Hence key point is to adopt lower reliability requirement and shorter transmission distance for nodes nearer to sink node and higher reliability requirement for longer to sink. The simulation result obtained shows that optimal approach improves the network lifetime, network utility.
Index Terms: Wireless sensor network, end-to-end data collection, source location privacy,
I. INTRODUCTION
Wireless sensor networks (WSNs) have been plays a crucial role in wide range of applications. The nodes are spatially distributed over a large area of interest to sense, measure, and gather information and transmit the data to the user. The main aim of WSNs is to sense the environmental condition and to collect and forward data to the sink node through multi-hop communication. So, efficient data management is important issues for WSNs. WSNs deploy several tiny and low-power sensor that have limited resources including sensing power, data storage and radio transmission. The nodes processing involves is limited energy consumption, and use the unreliable links. It is significant challenge to ensure Quality of service (QoS)-aware data collecting for industrial applications. The important and challenging task is to optimize the network performance. Firstly, sensor nodes usually has limited energy source by batteries, it is very important or challenging to replace or recharge batteries after deployment. In addition bit error during the data transmission in WSN is challenging issue to guarantee the applications such as environment (temperature, humidity), agriculture (Water tank, irrigation) with each packet of data delivered to sink.
The improved network performance can be obtained by optimizing network parameters. These parameters include the node number N*, node placement d* and node transmission structure p*. The optimized the network performance is due to network layer, physical layer or both of them. The protocol utility based on the optimization. The utilization efficiency is defined as network life time per unity deployment cost and the end-to- end delay which is considered separately in literature. The summarized of this paper is to mathematically prove the optimal node number N*; node placement d* and node transmission structure p* which achieve minimum energy consumption for data collection and unit data transmitting wireless sensor network .We proposed an optimal approach which maximizes utilization efficiency.
The rest of paper is organized as follows. Section 11.Describes the system model and problem statement. Section 111.Described the optimization design. Section 1V. gives to output of simulation result and Section V. concludes by a recount of the obtained results
II. THE SYSTEM MODEL AND PROBLEM STATEMENT
A. Energy Consumption Model
The energy consumption for one packet Ep is consists for three parts: transmitter Et, the receiver Er and the acknowledgement packet Eac
(1)
Technology (IJRASET)
(2) The receiver energy model equation:
(3) The energy expenditure model of an acknowledgement is given by:
(4) While:
(5)
Where Pt is the transmission power, N head is the number of the bits of synchronization packet in physical layer, and R code is code rate. τ ack is the ratio between the length of an ACK packet and that of DATA packet. Nack is the number of bits of overhead in a ACK. The other parameters are shown in table.
The energy model for each bits is
(6)
Where Eb,Ec and Kl are respectively the total, the constant and variable energy consumption per bit. Put (1)-(4) into (6), we get:
(7)
Where:
(8)
B. Problem Statements
To the total energy consumption for transmitting one bit to the sink as Etot.
To observe the energy consumption rate ξ as transmitting one bit to the sink with energy consumption Etot divided by the number of nodes (n) participating in transmission,
(9)
We define the network life time ℓ and utilization efficiency ɳ divided by the number of deployment sensor N,
(10)
placement d*, and transmission structure P* to minimize and maximize the utilization efficiency ɳ ,I.e.,
(11)
III. OPTIMIZING DESIGN
A. Single Source Linear Network
In single-source linear network consist only one source node Sn that generating data. Since apply the high energy consumption gives to long distance communication and reduce the communication reliability. Fig 1 shows single source linear network.
FIGURE1. illustration of the line network only one source node
The forwarding data between the nodes S1,S2,…….Sn is the sink node. Have been considering the node number is n,and the total energy consumption is Etot and each node energy consumption is ξ. Achieving the optimization goal is minimize energy
consumption and maximize the network utility efficiency ɳ, than ξ =Etot/n. It denote same energy consumption of each node.
Network life time ℓ = SN ,N = 1.The optimizing design in single-source linear networks
Single source linear network energy consumption using Rayleigh fast fading and distance between the two nodes is dhop, data is sent to the sink via D/dhop to meet the better reliability. Considering the network Rayleigh fast fading channel transmitting power Pt as follows.
(12)
Total energy consumption for one bit source node data to the sink.
(13)
To achieves the highest efficiency in the network design the energy consumption is balance and distance between the two nodes is same.
B. Multi-Source Linear Network
Technology (IJRASET)
FIGURE 2.illustration of the linear network of each node as source.
To the sink nearest node is S1 n-data packets are load, to the node S2 it is n-1 data packets,…..,and to the node Sn, the data load is one data packet. Multi source achieve optimization goals. Consider multi source linear network number of nodes n equidistantly deployed. Then energy consumption for node is :
(14)
The total energy consumption when nodes are equidistantly deployed :
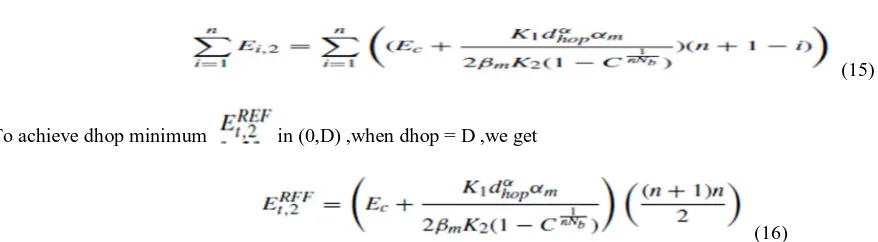
(15)
To achieve dhop minimum in (0,D) ,when dhop = D ,we get
(16)
Multi source network next goal is maximize ξ , which is to minimize unit node energy consumption defined as
(17)
Network utilization can be optimized .Network lifetime is determined by the nearest to the sink that has maximum energy consumption while multi-source network. Decrease node energy consumption ,it is needed to decrease the transmission distance dhop. Have been determined how to decrease dhop for nodes near the sink and increase dhop for far from the sink. The network life time is maximum ,all node energy consumption is equal and achieve same energy consumption for all nodes. While
(18)
We need Ei=Ej(i ≠ j) and d1+d2+….+dn = D, then using set of equation and we balanced energy consumption
(19)
C. Grid Network
FIGURE 3.Grid network
In grid network is transmission direction is restricted in downward or leftward with probability is same. The symmetrical network structure, nodes in a row or column are optimized, the lifetime network are maximized and load the data are
(20)
Grid network under Rayleigh fast fading channels, the maximum energy consumption of nodes in first row or column is balanced. Reduce the energy consumption and reliability near the sink and increase node reliability far from the sink to achieve total reliability.
(21)
IV. SIMULATION RESULT
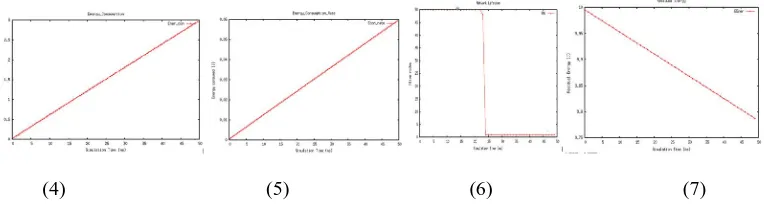
The existing and proposed systems are simulated using network simulator NS2.The network performance shows in single source linear network provides and calculate Energy consumption, Total network energy consumption rate, residual energy and network lifetime.
[image:6.612.119.501.548.652.2](4) (5) (6) (7)
Technology (IJRASET)
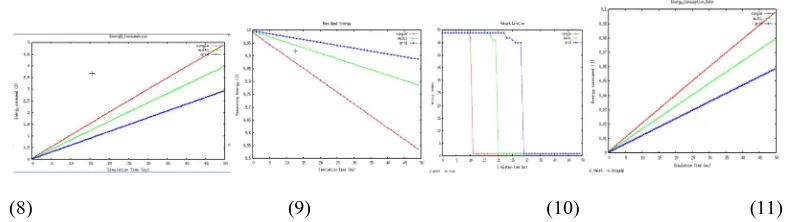
[image:7.612.108.511.77.188.2](8) (9) (10) (11)
Figure : 8. Energy consumption. , 9. Residual Energy ,10. Network lifetime ,11. Energy consumption rate
V. CONCLUSION
In this paper ,we proposed an optimal approach to achieve an optimal utility and guarantee the end-to-end reliability. The optimal approach is optimized the single-source linear network, Multi-source linear network and Grid network. The Grid network provide the better performance of single and multi-source network. Grid network improve the maximize network life time and data transmission to use in less energy, Utility and residual energy more in the network.
REFERENCES
[1] M. Alaei and J.M. Barcelo- ordinas, ” A collaborative node management scheme for energy –efficient monitoring in wireless multimedia sensor networks”, Wireless Net., vol.19,no.5,PP.636-659,2013.
[2] Chen,C,-N . Cheran and Q.Z hao., ”Network configuration for optimal utilization efficiency of wireless sensor networks ”,Ad Hoc Net., vol.6,no.1,PP.92-107,2008.
[3] M. Dong, K. Ota ,X. Shen ,S. Guo , and M. Guo, ” HARVEST : A task- objective efficient data collection scheme in wireless sensor and actor networks,” in ploc . 3rd Ink, Communication. Mobile Compute .(CMC) , Apr .2011.,PP.485 -488.
[4] M .Dong , K Ota , M. Lin, Z. Tang, S. Du, and H. Zhu, “VAV-Assisted data Gathering in Wireless sensor network,” Supercomputer., Vol.70,no.3,PP.1142-1155,2014.
[5] S. He, J. Chen , P .Cheng , V. Gu ,T. He , and Y. Sun , “ Maintaining quality of sensing with actors in Wireless sensor networks”, IEEE Trans . Parallel Distrib,. Syst., Vol .23,no. 9,99.1657-1667,Step.2012.
[6] G .Han , J. Jiang, L. Shu, J. Niu, and H,-C. Chau, ”Management and applications of trust in wireless sensor networks : A Survey .” J. comput. syst.sci., vol.80 , no.3,PP.602-617,2014.
[7] A. –F .Liu , P. –H. Zhang , and Z. –G . Chen, ” Theoritical analysis of the lifetime and energy hole in cluster based Wireless sensor networks,” J .Parallel Distrib . comput ., Vol .71, no.10,PP . 1327- 1355, 2011.
[8] L. Jiang , A. Liu, Y. Hu and Z. Chen , ” Lifetime maximization through dynamic ring-based routing scheme for correlated data collecting in WSNs,” Comput . Elect .Eng., Vol.41, no.1,PP.191-215,2015.
[9] S. Satry , T. Radeva , J. Chen ,and J .L. Welch, ”Reliable networks with unreliable sensors, ” Pervasive mobile Comput ., Vol.9,no.2, pp.311-323,2013. [10] N. Salman, M. Ghogho, and A.H. Kemp, ”Optimized low complexity Sensor node positioning in WSNs”, IEEE SensorJ., Vol.14, no.1,PP.39-46, Jan.2014. [11] K. Ota, M. Dong, X. Chen, A. Liu, and Z. Chen , ”Cross layer optimal design for Wireless sensor networks under Rayleigh fast fading channels ,” in Proc
.IEEE 10th HPCl / Euc . Nov, 2013, PP.183-189.
[12] J. Wang, Y. Liu, and Y. Jiao , ”Building a trusted route in a mobile ad hoc network considering communication reliability and path length ,”J. New. comput . Appl., Vol.34,no.4, PP.1138-1149,2011.