Experimental stress analysis & Finite element
analysis of T-Joint under Tensile and Bending
Loading
Miss R B, Sonawane1, Prof. Mankar R.L,Prof.2 , Prof.Hredeya Mishra 3,
1
P.G. Scholar, 2, 3 Assistant Professor, Mechanical Department, JCOE, Kuran, Maharashtra, India
Abstract: Welded joints are widely found in almost all applications like construction structures, automotive, industrial roofs and many more applications. Tensile, Bending , tortional and multi axial loads acts on various welded joints during operations' joints are used for various members coming together at same location joints behaviour at tensile and bending loading is investigated in this. Catia V5 software is used for modelling T joint of standard dimension. Discretiztion ( Meshing ) and finite element analysis is carried out using ANSYS package joints is welded with holding fixture for carrying out experimental analysis. Experimental Stress analysis is carried out using strain gauge for measuring strain values and UTM for applying gradual loads. Load of similar values were applied on T Joint in tensile and bending manner. Results were validated by comparative analysis using FEA and strain gauge values. Experimental and FEA correlation was in linear relation. It was concluded that T joints are stronger in tensile as compared to that of bending loading conditions.
Keywords: material, welding, specimen, fillet.
I. INTRODUCTION
Technological improvements in composite materials have been accompanied by an improvement in structural adhesives. As a result, the use of bonded joints has supplemented or replaced the use of traditional mechanical fasteners in composite and metallic structures.
Miss R.B. Sonawane is PG Scholar at Jaihind College of Engineering Kuran with Mechanical Design as specialization (E-mail:[email protected]).
Mr. R.L. Mankar is Assistant Professor at Jaihind College of Engineering Kuran. (E-mail: [email protected])
II. LITERATURE SURVEY
Peter A. Gustafson studied analytical and experimental methods for adhesively bonded joints subjected to high temperatures studied recent advances in material systems have expanded the temperature range over which adhesively bonded composite joints can be used. In this work, several tools are developed for use in modeling joints over a broad range of temperatures. First, a set of dimensionless parameters is established which can be used for analysis of joint performance for an orthotropic symmetric double lap joint. A critical dimensionless ratio of mechanical and thermal loads is identified. The ratio predicts characteristics of the resulting stress distribution. [1]
Sinjo Jose, M. James Selvakumar studied an Overview of Fillet Weld Joints Subjected to Tensile and Compressive Loads in which Mechanical assemblies and parts that are in service may be subject to high stresses and different types of loads such as fatigue loads, tension loads, compression loads. In this study, finite element analysis software, ANSYS, is used for a parametric study to research the effect of weld toe radius in fillet welded joint on compression strength and tensile strength. In metal constructions, machine assemblies, shipbuilding and other heavy industries, fillet joint is a widely used structural member. There are different types of loads acting on the fillet weld joints. There are various application of fillet weld joints .We can use fillet weld joints in steel bridge girder, building structures, machine assemblies etc. [2]
Lucas F.M. Silva, J.P.M. Gonc studied multiple-site damage in riveted lap-joints: experimental simulation and finite element prediction The multiple-site damage (MSD) phenomenon is discussed, and exemplified by the behaviour of riveted lap-joint specimens of aluminium alloy 2024-T3 alclad. The tests performed, on which the paper is based, are part of the contribution of IDMEC to a project on the fatigue behaviour of ageing aeronautical structures—the BRITE-EURAM project ‘SMAAC’, partially funded by the European Union. The study involves fatigue testing under constant amplitude loading of 1.6-mm-thick riveted lap-joints, and includes examination of the specimens during and subsequent to testing (post-mortem analysis of the fracture surface in a scanning electron Microscope) in order to determine the time of occurrence, location and extent of fatigue damage. Crack growth rates are determined from periodic crack length measurements with a travelling microscope. [3]
III. PROBLEM STATEMENT
Welded joints are widely found in almost all applications like construction structures, automotive, industrial roofs and many more applications. Tensile ,Bending ,tortional and multi axial loads acts on various welded joints during operations' joints are used for various members coming together at same location joints behavior at tensile and bending loading needs to be investigated
IV. OBJECTIVES
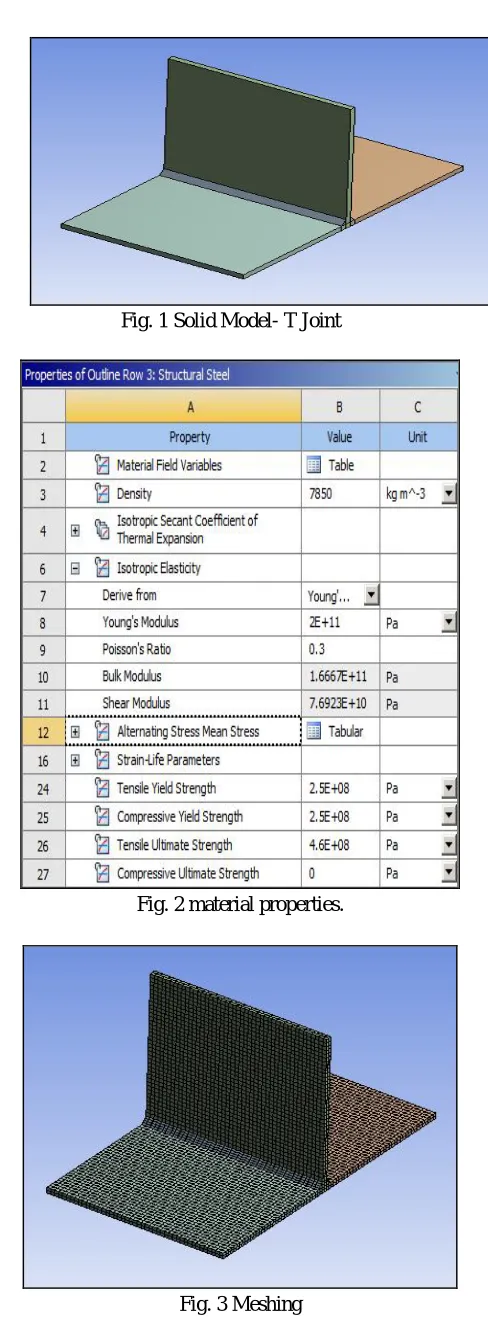
A. Catia V5 software is used for modeling T joint of standard Dimension.
B. Discretiztion (meshing) and finite element analysis is carried out using ANSYS package.
C. T joint is welded with holding fixture for carrying out experimental analysis.
D. Experimental stress analysis is carried out using strain gauge for measuring strain values and UTM for applying gradual loads.
A. Solid Model- T Joint
Fig. 1 Solid Model- T Joint
[image:4.612.205.443.90.220.2]Fig. 2 material properties.
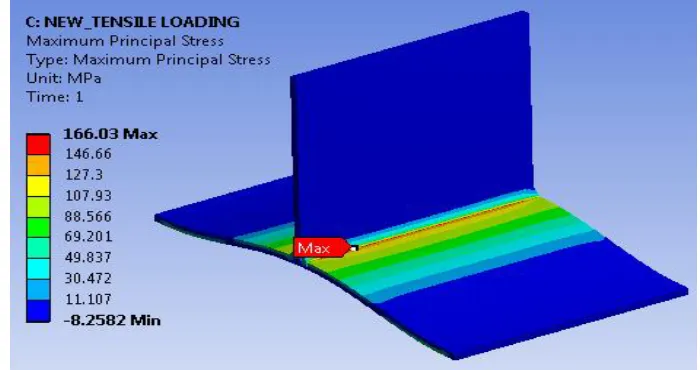
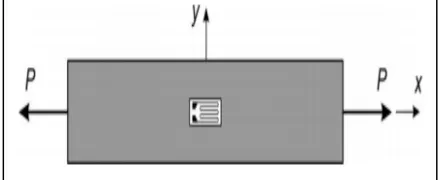
[image:4.612.200.422.245.518.2]B. Tensile loading.
Fig. 4 Tensile Loading (Boundary condition- Force=1000N)
[image:5.612.132.485.327.483.2]C. EQVI – Von Misses Stress
Fig.5 Tensile Loading
D. Maximum Shear Stress
[image:5.612.134.484.528.713.2]E. Deformation
Fig. 7 Tensile Loading
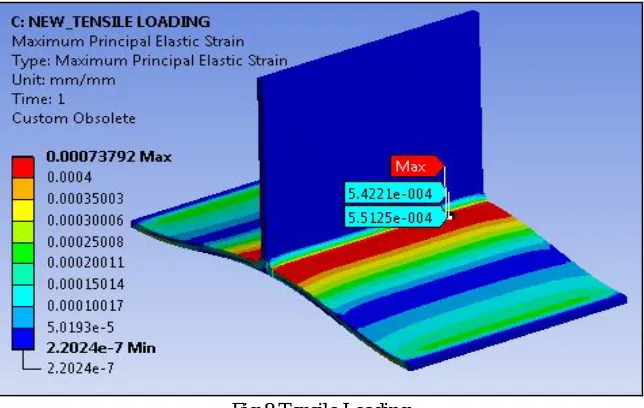
[image:6.612.151.473.284.488.2]F. Max principal strain
Fig.8 Tensile Loading
G. Strain gauge will be placed in nearby feasible location during fatigue life curve.
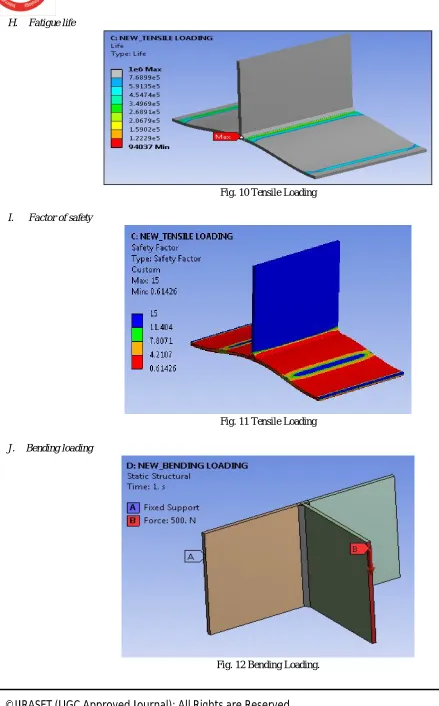
[image:6.612.140.484.520.715.2]H. Fatigue life
Fig. 10 Tensile Loading
[image:7.612.43.482.60.766.2]I. Factor of safety
Fig. 11 Tensile Loading
J. Bending loading
[image:7.612.144.476.91.245.2]K. EQVI – Von Misses Stress
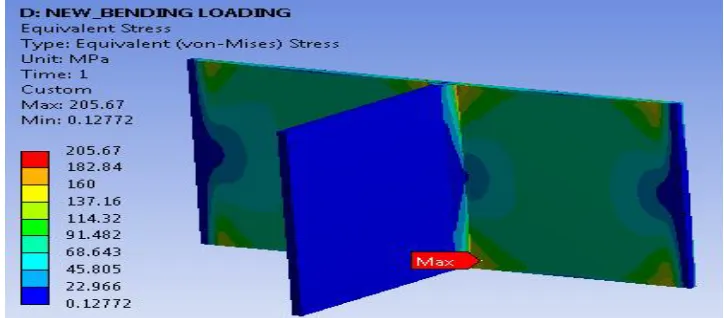
Fig. 13 Bending Loading
[image:8.612.141.483.294.480.2]L. Maximum Shear Stress
Fig. 14 Bending Loading
[image:8.612.148.472.525.709.2]M. Deformation
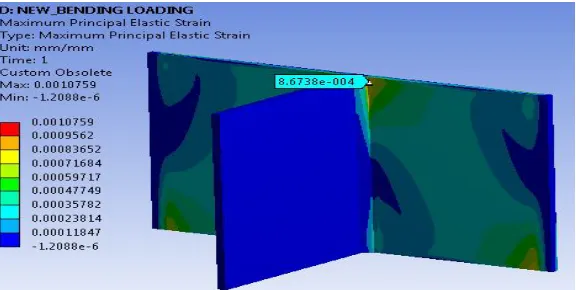
N. Max principal strain
Fig. 16 Bending Loading
[image:9.612.171.453.277.470.2]O. Fatigue life curve
Fig. 17 SN – curve for fatigue life calculation
[image:9.612.162.454.508.713.2]P. Fatigue life
Q. Factor of safety
Fig. 19 Bending Loading.
VI. EXPERIMENTAL STRESS ANALYSIS
There are various types of experimental methods to analyze strains and stresses at a point. Strain gauge methods use either electrical or mechanical means to measure strains. In these types of strain gauges, electrical resistance strain gauges are the most accurate and widely used ones. This experiment consists of three parts, all utilizing electric resistance strain gauges. You will perform three experiments.
Historically, the development of strain gauges has followed many pathsand various methods have been developed based on mechanical, optical, electrical, acoustic and pneumatic principles. In spite of the very wide variations in the strain gauge designs, they all have four basic common characteristics. These are gauge length, gauge sensitivity, measuring range, and, accuracy and reproducibility. Gauge Length: Strains cannot be measured at a point with any type of gauge, and as a consequence non-linear strain fields and local high strainsare measured with some degree of error being introduced. In these cases, the error will definitely depend on the gauge length Lo. In selecting a gauge for a given application, gauge length is one of the most important considerations. Gate Sensitivity: Sensitivity is the smallest value of strain which can be read on the scale associated with the strain gauge. Range: It represents the maximum strain which can be recorded without resetting or replacing the strain gauge. Accuracy: Accuracy is the closeness to an accepted standard value or set of values, and is numerically equal to the referred error value. Reproducibility: Reproducibility is the closeness or agreement between two or more measurements of the same quantity taken at different times. There are different types of commercial strain gauges; these are:
A. Unbounded wire gauges
B. Bonded wire gauges
C. Bonded foil gauges
D. Piezo-resistive gauges
E. Semi-conductive gauges
The first three of these types are very similar and they are based on Lord Kelvin's findings. The major differences between them are based on the design concepts rather than principles. The last two are entirely new concepts and are based on the use of a semiconductor as the strain sensing element.
[image:10.612.201.422.620.710.2]Bonded foil gauges is the very common gauge type. This strain gauge is one of the important electrical measurement technique applied to the measurement of mechanical quantities. As their name indicates they are used for the measurement of strain. The strain of a body is always caused by an external influence or internal effect such as force, pressure, moment, heat, structural change of the material etc. The strain gauge must be mounted on the surface of specimen on which the stress shall be determined. This is normally done with the aid of special bonding agents or glues. The two dimensional state of stress existing on the surface of the specimen can be expressed in terms of three Cartesian strain components through Hooke’s law. In general, it is necessary to measure three strains at point to completely define the strain field. In certain special cases, the state of strain may be established with a single strain gauge.
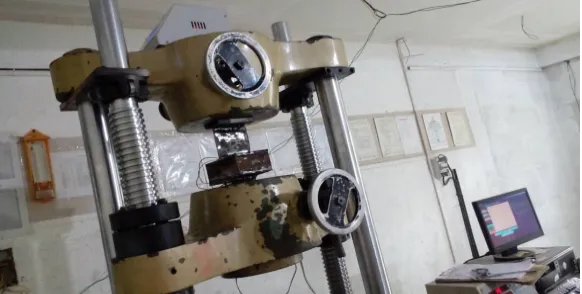
[image:11.612.200.425.347.521.2]Fig. 21 Tensile Loading on T-Joint
Fig. 22 Strain gage output 556 micro strains
[image:11.612.178.445.545.723.2]Fig. 24 Strain gage output 818 micro strains
VII. RESULT TABLE
FEA and Experimental strains are in good correlation with each other which validates thesis work.
LOADING EXPERIMENTAL
STRAIN
FEA STRAIN
BENDING 818 ms 867 ms
TENSILE 556 ms 551 ms
VIII. CONCLUSION
T Joints are stronger in tensile loadings as compared to bending loadings.
IX. ACKNOWLEDGMENT
It is of immense pleasure to me in expressing sincere and deep appreciation towards my guide Prof. R.L. Mankar., for priceless execution of steering this contribution all the way through this work with soft suggestions, embedded supervision and invariable advocacy. Special thanks to the principal and teaching staff of JCOE Kuran, for needful support and encouragement throughout the course.
REFERENCES
[1] Peter a., Gustafson, “Analytical and experimental methods for adhesively bonded joints subjected to high temperatures”. [2] Sinjo jose, m. James selvakumar, “an overview of fillet weld joints subjected to tensile and compressive loads”
[3] S .N Pilare , Dr. D.V. Bhope, “FE Modeling & Analysis of Arc Welded T-Joint”, International Journal of Engineering Science and Technology (IJEST), Vol. 4 No.06 June 2012, ISSN
[4] Practical Ideas for the Design Professional by Dune K. Miller, Sc.D.,P.E. “Designing Welded Lap Joints”, Welding Innovation Vol. XVIII, No.3,2001 [5] H. Bisadi1, M. Tour1, A. Tavakoli, “ The Influence of Process Parameters on Microstructure and Mechanical Properties of Friction Stir Welded Al 5083 Alloy