Open Access
Vol 10 No 1
Research
Imposed work of breathing during high-frequency oscillatory
ventilation: a bench study
Marc van Heerde
1, Huib R van Genderingen
2, Tom Leenhoven
3, Karel Roubik
4, Frans B Plötz
5and
Dick G Markhorst
51Fellow of Pediatric Intensive Care, Pediatric Intensive Care, Department of Pediatric Intensive Care, VU University Medical Center, Amsterdam, The
Netherlands
2Medical Physicist, Department of Physics and Medical Technology, VU University Medical Center, Amsterdam, The Netherlands
3Biomedical Engineer, Department of Pediatric Intensive Care, Wilhelmina Children's Hospital/University Medical Center, Utrecht, The Netherlands 4Biomedical Engineer, Faculty of Biomedical Engineering, Czech Technical University, Prague, Czech Republic
5Pediatric Intensivist, Department of Pediatric Intensive Care, VU University Medical Center, Amsterdam, The Netherlands
Corresponding author: Marc van Heerde, [email protected]
Received: 24 Oct 2005 Revisions requested: 30 Nov 2005 Revisions received: 22 Dec 2005 Accepted: 11 Jan 2006 Published: 1 Feb 2006
Critical Care 2006, 10:R23 (doi:10.1186/cc3988)
This article is online at: http://ccforum.com/content/10/1/R23 © 2006 van Heerde et al.; licensee BioMed Central Ltd.
This is an open access article distributed under the terms of the Creative Commons Attribution License (http://creativecommons.org/licenses/by/2.0), which permits unrestricted use, distribution, and reproduction in any medium, provided the original work is properly cited.
Abstract
Introduction The ventilator and the endotracheal tube impose additional workload in mechanically ventilated patients breathing spontaneously. The total work of breathing (WOB) includes elastic and resistive work. In a bench test we assessed the imposed WOB using 3100 A/3100 B SensorMedics high-frequency oscillatory ventilators.
Methods A computer-controlled piston-driven test lung was used to simulate a spontaneously breathing patient. The test lung was connected to a high-frequency oscillatory ventilation (HFOV) ventilator by an endotracheal tube. The inspiratory and expiratory airway flows and pressures at various places were sampled. The spontaneous breath rate and volume, tube size and ventilator settings were simulated as representative of the newborn to adult range. The fresh gas flow rate was set at a low and a high level. The imposed WOB was calculated using the Campbell diagram.
Results In the simulations for newborns (assumed body weight 3.5 kg) and infants (assumed body weight 10 kg) the imposed WOB (mean ± standard deviation) was 0.22 ± 0.07 and 0.87 ± 0.25 J/l, respectively. Comparison of the imposed WOB in low
and high fresh gas flow rate measurements yielded values of 1.63 ± 0.32 and 0.96 ± 0.24 J/l (P = 0.01) in small children (assumed body weight 25 kg), of 1.81 ± 0.30 and 1.10 ± 0.27 J/l (P < 0.001) in large children (assumed body weight 40 kg), and of 1.95 ± 0.31 and 1.12 ± 0.34 J/l (P < 0.01) in adults (assumed body weight 70 kg). High peak inspiratory flow and low fresh gas flow rate significantly increased the imposed WOB. Mean airway pressure in the breathing circuit decreased dramatically during spontaneous breathing, most markedly at the low fresh gas flow rate. This led to ventilator shut-off when the inspiratory flow exceeded the fresh gas flow.
Conclusion Spontaneous breathing during HFOV resulted in considerable imposed WOB in pediatric and adult simulations, explaining the discomfort seen in those patients breathing spontaneously during HFOV. The level of imposed WOB was lower in the newborn and infant simulations, explaining why these patients tolerate spontaneous breathing during HFOV well. A high fresh gas flow rate reduced the imposed WOB. These findings suggest the need for a demand flow system based on patient need allowing spontaneous breathing during HFOV.
Introduction
Maintenance of spontaneous breathing in mechanically venti-lated patients augments ventilation perfusion matching and cardiopulmonary function, reduces sedative requirement and
shortens the intensive care stay [1-6]. High-frequency oscilla-tory ventilation (HFOV) is a useful ventilaoscilla-tory mode for neona-tal application [7,8] and it is gaining interest in both pediatric and adult intensive care [9-12]. Neonatal and small pediatric
patients can easily breathe spontaneously during HFOV. Mus-cular paralysis is avoided and only mild sedation needs to be applied to tolerate ventilation and reduce stress. In larger chil-dren and adults, however, spontaneous breathing during HFOV is usually not well tolerated because of patient discom-fort. The sedation level often has to be high and even muscular paralysis may be necessary [13]. We speculate that this dis-comfort is caused by a high imposed work of breathing (WOB). The imposed WOB is the work added to the physio-logic WOB when patients breathe through a breathing appa-ratus. This includes work to overcome resistance added by the endotracheal tube, the breathing circuit and the humidification device, and work required to trigger the ventilator demand flow system. A physiologic WOB of 0.3–0.6 J/l is considered nor-mal in a healthy adult [14]. Depending on the ventilator set-tings, the imposed WOB can contribute as much as 80% to the total work of breathing [15]. The imposed WOB is greatest during continuous positive airway pressure, where the patient performs all the effort required to ventilate [16]. HFOV may in this respect be regarded as super-continuous positive airway pressure.
In a physical sense, work is performed when a transmural pres-sure (PTM) changes the volume (V) of a distensible structure: W = ∫PTM·dV, most often expressed as Joules per liter (J/l).
Applied to a breathing apparatus, the imposed WOB is calcu-lated by integrating the pressure measured at the tracheal end of the endotracheal tube (PETT) times the volume change:
imposed WOB = ∫PETT·dV. As inspiration is active and expira-tion is usually passive, only the inspiratory imposed WOB is generally considered. In a SensorMedics HFOV ventilator (3100 A or 3100 B; SensorMedics, Yorba Linda, CA, USA), the imposed WOB is directly related to the breathing-related difference between the set mean airway pressure (MAP) and the PETT; the greater the difference, the greater the imposed WOB and thus patient effort. MAP is regulated by a continu-ous fresh gas flow rate and an expiratory balloon valve. During inspiration of a patient, air is inhaled from the ventilator and the PETT level drops. The magnitude of this drop is influenced by
the fresh gas flow rate, the endotracheal tube size and the inspiratory flow rate [14].
[image:2.612.57.557.365.647.2]In order to find a solution to better tolerate spontaneous breathing during HFOV in large pediatric and adult patients
Figure 1
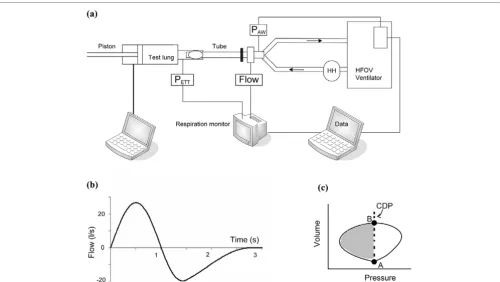
Schematic drawing of the experimental set-up
we performed a bench test, in which the inspiratory imposed WOB and pressure fluctuations in MAP were assessed for newborn to adult simulations. We evaluated which factors contributed to the imposed WOB in the SensorMedics HFOV ventilator: fresh gas flow rate, endotracheal tube size or inspir-atory flow rate.
Materials and methods
Bench test set-upA custom-made artificial lung was used to simulate a sponta-neously breathing subject with variable age (Figure 1a). This test lung consisted of a tube 10 cm in diameter with a compu-ter-controlled piston. A sinusoid flow simulated inspiration of spontaneous breathing, exponential decelerating flow expira-tion (Figure 1b). The test lung was connected to a HFOV ven-tilator (3100 A or 3100 B; SensorMedics) with an endotracheal tube (Rüschelit, Rüsch, Kernen, Germany). Dif-ferent patient circuits were used for each HFOV ventilator (3100 A or 3100 B; SensorMedics). The same heated humid-ifier was used for both ventilators (MR225 humidification chamber; Fisher and Paykel, Auckland, New Zealand).
The inspiratory airway flow and the expiratory airway flow in the endotracheal tube were measured with a hot-wire anemome-ter (Florian; Acutronic Medical Systems AG, Hirzel, Switzer-land). The tidal volume (VT) of spontaneous breathing was calculated by flow integration. The PETT value was measured using the Florian respiration monitor. The pressure at the Y-piece in the ventilator circuit was measured using the
unfil-tered electronic signal of the internal pressure sensor of the HFOV ventilator. Flow and airway pressures were sampled at 100 Hz and were stored on a laptop computer for off-line anal-ysis.
HFOV was set to a specific patient size as prescribed by the operator's manuals for management of acute respiratory dis-tress syndrome [17,18]. We tested five patient weight ranges, from newborn to adult (Table 1). The ventilator fresh gas flow rate was set at two different levels: low and high. For all differ-ent patidiffer-ent sizes, three VT levels of normal spontaneous breath-ing were simulated. The peak inspiratory flow rates that were generated with these VT levels are also presented in Table 1. Three different sizes of endotracheal tubes were used for each patient size (Table 1). In total, 90 different settings were tested.
Imposed work of breathing
For each experimental condition, 12–20 breaths were recorded. The inspiratory imposed WOB was calculated for each simulated spontaneous breath, based on the modified Campbell diagram (Figure 1c) [19,20]:
Imposed WOB = ΣINSP (CDP - MAPETT)·∆V (1)
[image:3.612.58.555.108.353.2]where CDP is the continuous distending pressure or set MAP level on the SensorMedics oscillator, and MAPETT is the mean airway pressure in the test lung. This was calculated by low-pass filtering (Butterworth filter with a cutoff frequency of 10 Table 1
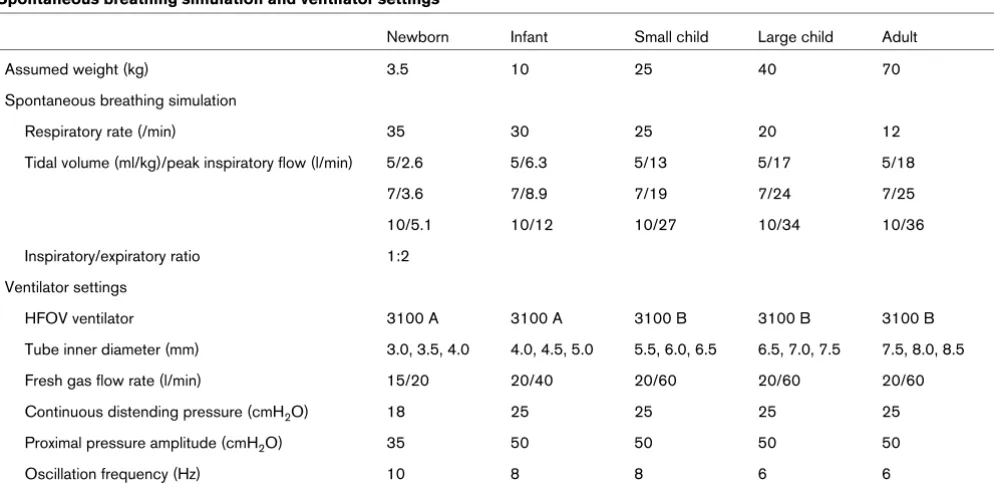
Spontaneous breathing simulation and ventilator settings
Newborn Infant Small child Large child Adult
Assumed weight (kg) 3.5 10 25 40 70
Spontaneous breathing simulation
Respiratory rate (/min) 35 30 25 20 12
Tidal volume (ml/kg)/peak inspiratory flow (l/min) 5/2.6 5/6.3 5/13 5/17 5/18
7/3.6 7/8.9 7/19 7/24 7/25
10/5.1 10/12 10/27 10/34 10/36
Inspiratory/expiratory ratio 1:2
Ventilator settings
HFOV ventilator 3100 A 3100 A 3100 B 3100 B 3100 B
Tube inner diameter (mm) 3.0, 3.5, 4.0 4.0, 4.5, 5.0 5.5, 6.0, 6.5 6.5, 7.0, 7.5 7.5, 8.0, 8.5
Fresh gas flow rate (l/min) 15/20 20/40 20/60 20/60 20/60
Continuous distending pressure (cmH2O) 18 25 25 25 25
Proximal pressure amplitude (cmH2O) 35 50 50 50 50
Oscillation frequency (Hz) 10 8 8 6 6
Hz) of the PETT signal to eliminate pressure changes on
account of oscillations. The imposed WOB was averaged over all breaths (expressed as J/l).
Airway pressure
Swings of the pressure in the ventilator circuit due to oscilla-tions were removed by low-pass filtering. As a result, all changes in airway pressure were attributable to the settings chosen to mimic spontaneous ventilation. Pressure fluctua-tions due to spontaneous breathing (∆MAP) are expressed as the deviation from CDP (in cmH2O). ∆MAPINSP is the maximum
deviation from the mean airway pressure during inspiration, and ∆MAPEXP is the maximum deviation from the mean airway pressure during expiration. ∆MAPINSP and∆MAPEXP were
cal-culated separately as the inspiratory and expiratory flow pat-terns of spontaneous breathing differed.
Statistical analysis
Data are expressed as the mean ± standard deviation. Com-parison of means for normally distributed data was performed with an independent t test. P < 0.05 was considered statisti-cally significant. Linear regression was performed to explore relations between the imposed WOB, the endotracheal tube size, the fresh gas flow rate and the peak inspiratory flow. Sta-tistical analyses were performed using SPSS 11.5 for Win-dows (SPSS Inc., Chicago, IL, USA).
Results
Imposed work of breathing
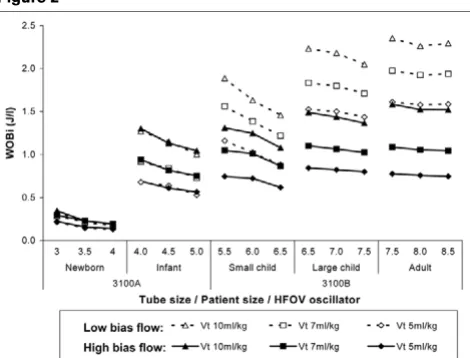
The imposed WOB was 0.22 ± 0.07 J/l for all measurements in the newborn (assumed body weight 3.5 kg) simulations and was 0.87 ± 0.25 J/l in the infant (assumed body weight 10 kg) simulations (Figure 2). Linear regression showed that a high or a low fresh gas flow rate did not independently influence the
imposed WOB in these measurements (P = 0.64 for new-borns and P = 0.94 for infants) (3100 A oscillator; Sensor-Medics). An independent contributor to the imposed WOB was the peak inspiratory flow; a higher peak inspiratory flow increased the imposed WOB (P < 0.001). The tube size did not independently contribute to the imposed WOB (P = 0.92 for newborns and P = 0.92 for infants).
The imposed WOB for the larger pediatric and adult patient size simulations (3100 B oscillator; SensorMedics) was signif-icantly higher in the low fresh gas flow rate condition in com-parison with the high fresh gas flow rate condition. The results for the imposed WOB for low flow versus high flow were 1.63 ± 0.32 versus 0.96 ± 0.24 J/l (P = 0.01) in the small child (assumed body weight 25 kg) simulation, were 1.81 ± 0.30 versus 1.10 ± 0.27 J/l (P < 0.001) in the large child (assumed body weight 40 kg) simulation, and were 1.95 ± 0.31 versus 1.12 ± 0.34 J/l (P < 0.001) in the adult (assumed body weight 70 kg) simulation. Independent contributors to the imposed WOB were the fresh gas flow rate (P < 0.001) and the peak inspiratory flow (P < 0.001). A high fresh gas flow rate decreased the imposed WOB, and a high peak inspiratory flow increased the imposed WOB. The tube size did not inde-pendently contribute to the imposed WOB (P = 0.07).
Airway pressure
The MAP in the ventilator circuit decreased dramatically during spontaneous breathing, most markedly at a low fresh gas flow rate (Figure 3). In this example the MAP in the ventilator circuit even becomes negative. This effect was observed when the fresh gas flow rate was low and with a VT of 7 or 10 ml/kg for the large child and adult patient simulations. In these simula-tions the peak inspiratory flow exceeded the fresh gas flow
Example of fluctuations in pressure in the ventilator circuit for both low and high fresh gas flow rates
Example of fluctuations in pressure in the ventilator circuit for both low and high fresh gas flow rates. PAW, unfiltered airway pressure; PAW fil-tered, mean airway pressure (MAP) calculated by low-pass filtering of the PAW signal. Example of the changes in PAW and PAW filtered during the simulation for a large child (assumed body weight 40 kg, tidal vol-ume 280 ml), for both low and high fresh gas flow rates. Note that pres-sure changes decrease with a higher fresh gas flow rate and thus the imposed work of breathing decreases. In this example at the low fresh gas flow rate, the pressure in the ventilator circuit becomes negative as the inspiratory flow exceeds the fresh gas flow rate (arrow). Insp, inspi-ration; Exp, expiration.
Imposed work of breathing (WOBi) for all simulations
[image:4.612.58.293.90.269.2]rate. This triggered the automatic ventilator shut-off, a safety feature of the SensorMedics oscillator.
∆MAPINSP and ∆MAPEXP for all measurements in the newborn
(assumed body weight 3.5 kg) simulations were not signifi-cantly different comparing low and high fresh gas flow rates (Table 2). In the infant (assumed body weight 10 kg) simula-tions the ∆MAPINSP value was significantly lower in the high fresh gas flow rate condition in comparison with the low fresh gas flow rate testing (P = 0.002). There was no difference in ∆MAPEXP measurements (3100 A; SensorMedics). For
pediat-ric and adult simulations (3100 B oscillator; SensorMedics)
the ∆MAPINSP and ∆MAPEXP values were significantly lower in
the high fresh gas flow rate condition in comparison with the low fresh gas flow rate condition (Table 2).
Discussion
The main result of this study is that the imposed WOB can be markedly increased during HFOV in pediatric and adult patients, especially at low fresh gas flow rates. This can be a good explanation for the discomfort seen in patients breathing spontaneously during HFOV. The fresh gas flow rate and peak inspiratory flow are both strongly related to the imposed WOB. The MAP is not maintained in the breathing circuit when inspiratory flow exceeds the fresh gas flow rate, and this can even lead to ventilator shutdown.
Work of breathing
Compared with the WOB of a healthy adult (0.3–0.6 J/l), the imposed WOB is high if spontaneous breathing is simulated during HFOV [14]. As the physiologic WOB is not considered in this bench test, the total WOB is even higher in a patient breathing spontaneous during HFOV. An elevated WOB level results in dyspnea and discomfort [21,22]. The optimal
work-load for critically ill patients is unclear. Research focuses mainly on WOB in the weaning phase [23,24]. A WOB level in the physiologic range (approximately 0.5 J/l in adults) seems to correspond with an optimal workload. Full unloading (for instance, reducing the WOB to zero) induces loss of respira-tory muscles. Excessive respirarespira-tory muscle loading may cause muscle fatigue and weaning failure [25]. The workload of 0.5 J/l seems to occur not only optimal during weaning, but also in the acute phase of respiratory failure [26,27].
In the pediatric and adult simulations, the imposed WOB exceeded the normal physiologic WOB by as much as 200%. There are very few studies reporting normal WOB values for pediatric patients. WOB in healthy children and adolescents (6–18 years) ranges between 0.1 and 0.6 J/l [28]. In healthy preterm and full-term infants the WOB range is 0.02–0.2 J/ l[29]. The optimal WOB during mechanical ventilation for these patients is even more unclear.
[image:5.612.59.555.117.280.2]Our results show that the level of imposed WOB is high during spontaneous breathing in HFOV. A high fresh gas flow rate in simulations for pediatric and adult patients reduces the imposed WOB, but not within the physiologic range of WOB. It seems logical to aim at a level of imposed WOB in the phys-iologic WOB range. However, there are no data to support this. An effective way to reduce imposed WOB in HFOV is desirable. Although we did not simulate this condition, a pos-sible solution is to set the fresh gas flow rate to a higher rate. Another solution is the use of a demand flow system instead of the continuous fresh gas flow rate. In order to reduce the imposed WOB, the fresh gas flow rate has to far exceed the peak inspiratory flow. A reasonable suggestion would be the possibility to generate peak fresh gas flow rates comparable Table 2
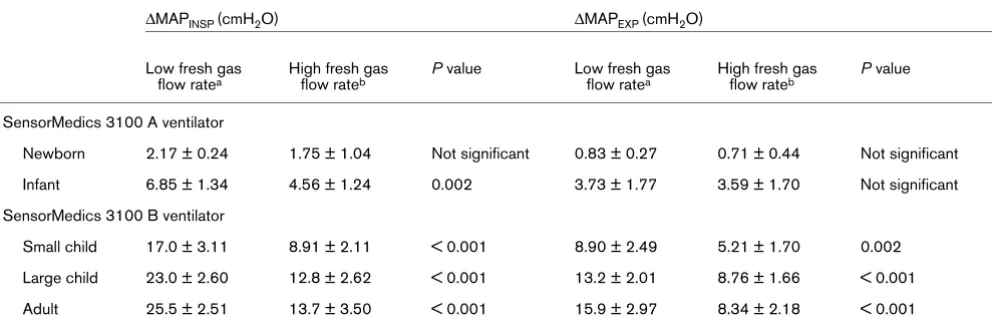
Maximum deviation of the mean airway pressure from the set continuous distending pressure during inspiration and expiration
∆MAPINSP (cmH2O) ∆MAPEXP (cmH2O)
Low fresh gas flow ratea
High fresh gas flow rateb
P value Low fresh gas flow ratea
High fresh gas flow rateb
P value
SensorMedics 3100 A ventilator
Newborn 2.17 ± 0.24 1.75 ± 1.04 Not significant 0.83 ± 0.27 0.71 ± 0.44 Not significant
Infant 6.85 ± 1.34 4.56 ± 1.24 0.002 3.73 ± 1.77 3.59 ± 1.70 Not significant
SensorMedics 3100 B ventilator
Small child 17.0 ± 3.11 8.91 ± 2.11 < 0.001 8.90 ± 2.49 5.21 ± 1.70 0.002
Large child 23.0 ± 2.60 12.8 ± 2.62 < 0.001 13.2 ± 2.01 8.76 ± 1.66 < 0.001
Adult 25.5 ± 2.51 13.7 ± 3.50 < 0.001 15.9 ± 2.97 8.34 ± 2.18 < 0.001
with conventional ventilation (approximately 140 l/min) depending on patient need.
Since the imposed WOB does not reflect the isovolumetric breathing effort, the pressure time product per breath was also calculated (data not included). As expected, results for the pressure time product per breath and the imposed WOB were identical. This is explained by the lung model we used for spontaneous breathing, in which the inspiratory and expiratory flows were programmed. The volume changes were imposed, so isovolumetric contraction did not occur.
For the simulations for newborns and infants, the imposed WOB was not influenced by the fresh gas flow rate. This may be explained by the chosen small difference in levels of low and high fresh gas flow rate. Simulations for newborns show a low level of imposed WOB. This is in agreement with the fact that these patients tolerate spontaneous breathing during HFOV. Various factors define the imposed WOB. The endotracheal tube, the breathing circuit, the humidification device and the trigger settings impose the workload. Endotra-cheal tubes have the greatest effect on flow-resistive work [23]. This seems in contrast with our results, and is explained by the small differences in tube sizes used in our experiments, relative to the large variations in peak inspiratory flow.
Airway pressure
Large fluctuations in the MAP in the breathing circuit are responsible for a high imposed WOB. They may also lead to unwanted alarms of the ventilator during HFOV, or even to shutdown. Upper and lower alarm limits are routinely set 3–5 cmH2O above and below the desired MAP [17,18]. This is a
safety precaution against unnoticed MAP changes due to changes in respiratory system compliance, which may lead to alveolar derecruitment or overdistension. Airway pressure fluc-tuations exceeded the alarm limit of 5 cmH2O in all simulations on the SensorMedics 3100 B ventilator. In the simulations for smaller patient size, alarm limits of 3 cmH2O above and below
the CDP were sufficient to avoid alarms – although in most other measurements the alarm limits had to be set wide to stop alarms, interfering with patient safety in a clinical setting.
If the peak inspiratory flow exceeded the fresh gas flow rate, this led to ventilator shutdown. This triggered the automatic ventilator shut-off, a safety feature of the SensorMedics oscil-lator.
Limitations of the study
The imposed WOB is strongly related to the choice of VT,
res-piratory rate, breathing pattern and tube size. In this in vitro study we aimed to choose realistic test conditions. However, in vivo conditions may differ from our bench test. In the lung model used only the imposed WOB can be evaluated. Patient or total work cannot be assessed. During HFOV the lungs can expand to high levels of end expiratory lung volume near the
total lung capacity. At high levels of end expiratory lung volume the work of breathing will increase as a result of an increase in elastic work. The VT levels used for simulations were fixed. The
VT level that a patient can generate is influenced by the level of end expiratory lung volume. Only shallow breathing is possible at levels of end expiratory lung volume near the total lung capacity. In this lung model we are not able to evaluate these effects on patient WOB and on total WOB. These findings need validation in clinical practice.
Conclusion
The imposed WOB is considerable in spontaneous breathing in pediatric and adult patients during HFOV and is a good explanation for observed patient discomfort. A high fresh gas flow rate decreased the imposed WOB, but not sufficiently. Large swings in airway pressure complicate the setting of safe alarm limits and can even lead to ventilator malfunction. In clin-ical practice it is reasonable to consider the level of the fresh gas flow rate. In order to minimize the imposed WOB and to allow at least shallow spontaneous breathing during HFOV, the fresh gas flow rate has to be set at a maximum level.
Competing interests
The authors declare that they have no competing interests.
Authors' contributions
MvH designed the study, conducted the bench study, ana-lyzed the results and drafted the manuscript. HRvG, TL and KR assisted in designing the study and participated in interpreting the results. FBP participated in interpreting the results and drafting the manuscript. DGM discovered the phenomenon under clinical conditions, assisted in designing the study, and participated in interpreting the results and drafting the manu-script. All authors read and approved the final manumanu-script.
Acknowledgements
The authors wish to thank John Arnold, Division of Critical Care Medi-cine, Department of Anesthesia, Children's Hospital, Boston, MA, USA, for critically reviewing the manuscript.
Key messages
• In a bench test, simulated spontaneous breathing dur-ing HFOV results in a high level of the imposed WOB.
• The high level of imposed WOB explains the discomfort seen in patients breathing spontaneously during HFOV.
• A high fresh gas flow rate reduces the imposed WOB, but not to an acceptable level.
• Fluctuation of the MAP, on account of spontaneous breathing, interferes with safety settings.
References
1. Cereda M, Foti G, Marcora B, Gili M, Giacomini M, Sparacino ME, Pesenti A: Pressure support ventilation in patients with acute lung injury. Crit Care Med 2000, 28:1269-1275.
2. Hering R, Peters D, Zinserling J, Wrigge H, von Spiegel T, Putensen C: Effects of spontaneous breathing during airway pressure release ventilation on renal perfusion and function in patients with acute lung injury. Intensive Care Med 2002, 28:1426-1433.
3. Neumann P, Wrigge H, Zinserling J, Hinz J, Maripuu E, Andersson LG, Putensen C, Hedenstierna G: Spontaneous breathing affects the spatial ventilation and perfusion distribution during mechanical ventilatory support. Crit Care Med 2005, 33:1090-1095.
4. Putensen C, Mutz NJ, Putensen-Himmer G, Zinserling J: Sponta-neous breathing during ventilatory support improves ventila-tion–perfusion distributions in patients with acute respiratory distress syndrome. Am J Respir Crit Care Med 1999, 159:1241-1248.
5. Putensen C, Zech S, Wrigge H, Zinserling J, Stuber F, Von Spiegel T, Mutz N: Long-term effects of spontaneous breathing during ventilatory support in patients with acute lung injury. Am J Respir Crit Care Med 2001, 164:43-49.
6. Sydow M, Burchardi H, Ephraim E, Zielmann S, Crozier TA: Long-term effects of two different ventilatory modes on oxygenation in acute lung injury. Comparison of airway pressure release ventilation and volume-controlled inverse ratio ventilation. Am J Respir Crit Care Med 1994, 149:1550-1556.
7. Bollen CW, Uiterwaal CS, van Vught AJ: Cumulative metaanaly-sis of high-frequency versus conventional ventilation in pre-mature neonates. Am J Respir Crit Care Med 2003, 168:1150-1155.
8. Froese AB, Kinsella JP: High-frequency oscillatory ventilation: lessons from the neonatal/pediatric experience. Crit Care Med 2005, 33:115-121.
9. Bollen CW, van Well GT, Sherr T, Beale RJ, Shah S, Findlay G, Monchi M, Chiche JD, Weiler N, Uiterwaal CS, et al.: High fre-quency oscillatory ventilation compared with conventional mechanical ventilation in adult respiratory distress syndrome: a randomized controlled trial [ISRCTN24242669]. Crit Care
2005, 9:R430-R439.
10. Derdak S, Mehta S, Stewart TE, Smith T, Rogers M, Buchman TG, Carlin B, Lowson S, Granton J: High-frequency oscillatory venti-lation for acute respiratory distress syndrome in adults: a ran-domized, controlled trial. Am J Respir Crit Care Med 2002, 166:801-808.
11. Singh JM, Ferguson ND: Is it time to increase the frequency of use of high-frequency oscillatory ventilation? Crit Care 2005, 9:339-340.
12. Slee-Wijffels FY, van der Vaart KR, Twisk JW, Markhorst DG, Plötz FB: High-frequency oscillatory ventilation in children: a single-center experience of 53 cases. Crit Care 2005, 9:R274-R279. 13. Sessler CN: Sedation, analgesia, and neuromuscular blockade
for high-frequency oscillatory ventilation. Crit Care Med 2005, 33:209-216.
14. Banner MJ, Jaeger MJ, Kirby RR: Components of the work of breathing and implications for monitoring ventilator-depend-ent pativentilator-depend-ents. Crit Care Med 1994, 22:515-523.
15. Kirton OC, DeHaven CB, Morgan JP, Windsor J, Civetta JM: Ele-vated imposed work of breathing masquerading as ventilator weaning intolerance. Chest 1995, 108:1021-1025.
16. Kacmarek RM, Hess D: Basic principles of ventilator machinery. In Principles and practice of mechanical ventilation Edited by: Tobin MJ. New York: McGraw-Hill, Inc.; 1994:65-110.
17. SensorMedics: 3100 A High Frequency Oscillatory Ventilator Operator Manual Yorba Linda, CA: SensorMedics; 1993. 18. SensorMedics: 3100 B High Frequency Oscillatory Ventilator
Operator's Manual Yorba Linda, CA: SensorMedics; 1999. 19. Campbell EJ: The Respiratory Muscles and the Mechanics of
Breathing Chicago, IL: Year Book Medical; 1958.
20. Agostini E, Campbell EJ, Freedman S: Energetics. In The Respi-ratory Muscles Edited by: Campbell EJ, Agostini E, Newsom Davis J. Philadelphia, PA: Saunders; 1970:115-137.
21. Chiumello D, Pelosi P, Croci M, Bigatello LM, Gattinoni L: The effects of pressurization rate on breathing pattern, work of
breathing, gas exchange and patient comfort in pressure sup-port ventilation. Eur Respir J 2001, 18:107-114.
22. Vitacca M, Bianchi L, Zanotti E, Vianello A, Barbano L, Porta R, Clini E: Assessment of physiologic variables and subjective comfort under different levels of pressure support ventilation.
Chest 2004, 126:851-859.
23. French CJ: Work of breathing measurement in the critically ill patient. Anaesth Intensive Care 1999, 27:561-573.
24. Girault C, Breton L, Richard JC, Tamion F, Vandelet P, Aboab J, Leroy J, Bonmarchand G: Mechanical effects of airway humidi-fication devices in difficult to wean patients. Crit Care Med
2003, 31:1306-1311.
25. MacIntyre NR: Respiratory mechanics in the patient who is weaning from the ventilator. Respir Care 2005, 50:275-286. 26. MacIntyre NR, Cook DJ, Ely EW, Epstein SK, Fink JB, Heffner JE,
Hess D, Hubmayer RD, Scheinhorn DJ: Evidence-based guide-lines for weaning and discontinuing ventilatory support: a col-lective task force facilitated by the American College of Chest Physicians; the American Association for Respiratory Care; and the American College of Critical Care Medicine. Chest
2001, 120:S375-S395.
27. Putensen C, Hering R, Muders T, Wrigge H: Assisted breathing is better in acute respiratory failure. Curr Opin Crit Care 2005, 11:63-68.
28. Zapletal A, Samanek M, Paul T: Lung Function in Children and Adolescents Basel: Karger; 1987.