Using Indicators of Technical Analysis to Predict
the Prices of Shares: Study of a Sample of Banks
Listed on the Iraqi Stock Exchange
Dr. Salim Sallal Rahi Al-hisnawy1
1
Assist. Prof Department of Banking and Finance College of Management and Economics - University of Qadisiyah - Iraq
Abstract: The study aims to identify the extent of using the investor in the Iraqi Stock Exchange for technical analysis through the knowledge of the extent understanding of the investor for the technical analysis and the extent of his dependence on this analysis in taking investment decisions from to enter or exit the market . technical analysis is an important tool in global financial markets through its impact on investor decisions for the determination of stock prices and trends in the future . To prove the hypothesis of research, some companies in the banking sector listed in the Iraqi Stock Exchange were selected to be a research community, as a sample was selected Composed of six banks to be a field of research. The research was based on a set of analysis indicatorused in the forecasting process towards stock prices by (Simple average, rate of change, momentum, relative strength) in addition to some statistical tests such as Livens test, T test and F test according to the statistical program SPSS 20. The research reached a number of conclusions from the most important ones that revolve around the existence of the statistical significance of the reliability of these indicators in the process of forecasting towards stock prices for the banking. Keywords: Technical Analysis, Simple Moving Average, Rate of change , Momentum.
I. INTRODUCTION.
The investment in stocks is fraught with many risks, and making it more difficult to measure these risks diversity of options available to the investor, making the wrong investment decision to open losses that lead to the accumulation ofbankruptcy, Therefore, investors resort to different approaches in order to try to predict the future of stock prices, The most important of these approaches is the technical analysis approach, which focuses on the study and analysis of the share price movement over time by adapting different statistical methods for this purpose , By processing historical data of the stock price in previous periods, the investor gets information about the future development of the price of this stock, technical analysis is an important tool to support the investment decision,Not only in stocks but also in terms of the values transferred in general, because it gives a scientific character to investment decisions taken by investors and is considered to be a less complex method than basic analysis.The technical analyst is studying the impact of price action. The question that is always asked by everyone who is interested in the basic analysis of financial markets is "Why does the price move in a certain direction?" While technical analysts pose very different questions : What then ? , to where? , till when? ",In other words, the technical analysis of securities focuses on the study of price movements in the market in an attempt to determine the times of entry into and exit from the market. It also aims to identify indicators that confirm the trend of price movement in the stock market,and these indicators or signals are reached through some methods that depend on a range of variables are the direction of price, and historical movement, , and trading volumes accompanying this movement . For the purpose of briefing the research was divided into four axes, the first of which included the methodology of research and some previous studies,, while the second axis focused on the theoretical framework of the research, and dealt with the third aspect of the application, while the fourth and final axis was devoted to the most important conclusions reached by the research and some recommendations.
II. RESEARCH METHODOLOGY AND SOME PREVIOUS STUDIES.
A. Research problem
The problem of research can be understood by the following questions :
1) Is there statistical significance in the possibility of relying on the index of the Simple Average in the process of forecasting thedirection of prices of shares of the banking sector listed in the Iraqi market for securities?
) Is there statistical significance in the possibility of relying on the Momentum Index in the process of forecasting the direction of 3
prices of shares of the banking sector listed in the Iraqi market for securities?
4) Is there statistical significance in the possibility of relying on Relative Strength Index in the process of forecasting the price trend of the banking sector listed in the Iraqi Stock Exchange?
B. Importance of Research
Since technical analysis is an important tool to support investment decision, not only in stocks but also in terms of the values transferred in general, because it gives a scientific character to investment decisions taken by investors. It is also a less complex method compared to basic analysis , Therefore, the importance of the study is based on the following points:
1) Recognize the importance of technical analysis to investors that they seek to achieve the highest return using several methods that can guide their investment decision .
2) Increase investor confidence in technical analyst.
3) Clarify the importance of the management of the financial market, as the Iraqi market for securities seeks to develop and revitalize the market itself through the support of investors technically and administratively and work to rationalize their decisions.
C. Research Objectives Are as follows:
1) Predicting the trends of the Iraqi market for securities using the technical analysis entrance and determining whether these trends are in the case of a rise or fall.
2) Provide the appropriate climate for investment in technical analysis techniques through the disclosure of strengths and weaknesses in them.
3) Provide a pilot guide for investors looking for information on future market trends using technical analysis indicators.
D. Hypotheses of the study
Based on the problem of research and how to predict the prices of shares of the banking sector in the Iraqi market for securities using the indicators of technical analysis, so the research is based on the following assumptions:
1) There is a statistical significance in the possibility of relying on the index of the Simple Average in the process of forecasting the direction of prices of shares of the banking sector listed in the Iraqi market for securities.
2) There is a statistical significance in the possibility of relying on the indicator of the Rate of Change in the process of forecasting the direction of prices of shares of the banking sector listed in the Iraqi market for securities.
3) There is statistical significance in the possibility of relying on the Momentum Index in the process of forecasting the direction of prices of shares of the banking sector listed in the Iraqi market for securities.
4) There is statistical significance in the possibility of relying on Relative Strength Index in the process of forecasting the price trend of the banking sector listed in the Iraqi Stock Exchange .
E. Statistical methods used
The practical side of the study was based on a number of statistical methods 1) Indicators: including
Simple Moving Average: *
This indicator is one of the most common indicators in the technical analysis, since the price path is determined by an easy and accurate mathematical equation. The Simple Moving Average can be calculated according to equation (1). (Stevenson &Jenning, 1981, 207) (Bodie, ed, 1998, 425) .
equation (1).
....
SMA = …..
As follows :
SMA : Simple Moving Average
CP : Close price n :Number of time periods
* Change rate index:
Another measure of price momentum is that the momentum and the rate of change are very similar oscillators under one
indicators are an early warning of changing the trend .It is calculated according to equation (2):
) . Murphy,1991:165 (
. (Francis, 1983, 454)
The rate of change = 100 (last price / price for the number of days earlier)... equation (2)
RC = 100 (LP) /Pe
As follows:
RC: The rate of change LP : last price
Pe: price for the number of earlier days * Momentum:
The momentum can be calculated by recording each period and calculating the differences between prices for each period according to equation(3). (Al-Muhaili, 2006: 173) (Francis, 1983, 453) .
Momentum = last closing price-closing price prior to the number of day…equation(3)
M =LCP – CPP
As follows:
M: Momentum
LCP: last closing price
CPP: closing price prior to the number of days Relative Strength Index: * It is calculated in two steps as follows:
Step 1 - Calculate Relative Strength RS: is the average price of locks that rose divided by the average closing prices that landed for a certain period and as in Equation (4) (Murphy,1991:169) , (Francis, 1983, 453) .
… equation (4)
As follows:
AG: Average Gain
AL :Average Losses
TG : Total Gains
TL : Total Losses
n :The number of days
Step 2: RSI: Calculated according to equation (5): -
equation (5)
.
...
RSI = 100 – ( )
As follows:
RS : Relative Strength.
2. Livens test. 3. Test (T).
4. Test (F).
E. Data collection and analysis methods
The study included two aspects, the first of which is based on the theoretical side, which was based on a collection of Arabic and foreign books as well as studies, research and articles available in libraries and the Internet. The applied side of the study was based on the digital data of the selected sample obtained from the electronic market, Monthly reports issued by the Iraqi market for securities and available statistics cornerstone in this study as well as the contribution of the Internet (Internet) in enriching the study in this regard.
F. Limitations of the study
1. Spatial boundaries: The study was conducted for some banks listed in the Iraqi market for securities. 2. Time limits: The financial statements have been adopted for a period of two years for the period (1/1/2013 to 31/12/2014)
G. Study Sample
The sample of the study was (6) banks, which constituted 28.57% of the total of the banking sector companies and the number of 21 banks.
III. SOME PREVIOUS STUDIE
This study deals with the presentation of some of the previous studies related to the variables of the study. The previous studies are one of the main pillars in building the structure of the theoretical and field aspects of any research through testing and analysis and revealing the degree of homogeneity between them and the most important findings.
Study: Neftci, 1991: The study entitled "Trading rules in the financial markets" aimed to investigate the statistical characteristics of technical analysis to determine whether there is any basic objective of the methods used in the study society represented in the American market. The study was conducted on the Dow Jones Industrial Index data, - The study used the scientific statistical method .The analysis concluded that the technical analysis gives a buy or sell signal identical to that generated by one of the forms of algorithm extraction . The study recommended the formation of an official model of technical analysis, which is a high degree of informal prediction rules .
(Menkhoff, and Taylor, 2006) Study : The study titled "Technical Analysis of Foreign Currency Trading," aims at finding out why technical analysis is used as a systematic tool by highly professional foreign exchange traders. The study was conducted on employees in the foreign exchange market in London, UK .The study used the statistical method and concluded that it was impossible to accept the hypothesis that "the large use of technical analysis is illogical," compared to the practical fact that professional forex traders rely on technical analysis as a predictive tool, even small, and that technical analysis is important, The analysis of the foreign exchange market, and the technical rules applied over a period of time, often lead to a positive indicator of increased returns. The study concluded that technical analysis is a tool that simulates market information and is still an issue of concern to many investors . The study recommended that the investor should use both technical and fundamental analysis in the forecasting processes, that the use of the same technical analysis methods should be diversified, and the currency pairs should be diversified. The study recommended that academic institutions not neglect technical analysis as an economic tool operating within the macroeconomic system .
And from Arabic studies : (Abu Assi, 2006) Study which entitled "The Effectiveness of Using Technical Analysis Techniques on the Saudi Stock Market", a field study for the period 2004 - (2005), aims at determining the efficiency of the use of technical analysis methods on the Saudi stock market and determining their ability to generate additional revenue, Dealing with buying and selling and identifying Saudi stocks or companies that give a positive additional return when using technical analysis methods when trading. The study community included all the companies traded in the Saudi stock market during the years 2004-2005. Where it has been tested of (40) methods of technical analysis applied to the market (Japanese candlestick, Momentum, RSI, ...) . The study concluded with several conclusions, the most important of which are: that there are specific methods that achieved the highest positive returns such as the simple average, and that not all technical methods are applicable to all Saudi companies. Some technical methods have caused losses with some companies such as triangles. Technical analysis is not 100% accurate and needs to be diversified to confirm each other. The study also recommended the use of technical analysis in determining the times of purchase and sale of shares, as well as the use of more than a technical method to support investment decision and rationalization, and it is necessary to use the basic analysis when choosing stocks or sectors.
It is also Arab studies ,(Fateh, 2008) Study , entitled "The role of technical analysis in rationalizing the investment decision : a field study of the Saudi stock market for the period 2007-2008" aims to know the role of technical analysis in rationalizing the investment decision of individuals investors in the Saudi stock market through the use of a set of indicators and technical tools for technical analysis such as (Japanese candlesticks, averages, triangles) and their impact on investor decisions in the financial market, The study used the statistical method and concluded that the method of technical analysis can be used for trading in financial markets, while the basic analysis method cannot be relied upon alone without taking the technical analysis aspect of the market into consideration. In addition to a set of advantages that characterize the technical analysis on the basic analysis, which we can provide below (flexibility and adaptation of technical analysis, application of technical analysis in different markets, application of technical analysis in different time frames) . . The study recommended that there is no possibility of dispensing with the technical input and its application to know the price movement of these shares in the market and determining the appropriate time to make a rational decision in buying, selling or holding these shares .
IV. THEORIETICAL FRAMEWORK FOR RESEARCH.
A. The concept of technical analysis
Edward and Magee (1992) also mentioned that technical analysis relates to the study of price movements in the market using graphs and quantitative techniques for forecasting price trends, which is usually a method of recording (in the form of graphs) the trading date of a particular financial instrument (stocks, futures contracts , Currencies) and on this basis it anticipates possible future trend. (Murphy, 1999: 1) argues that technical analysis is the study of market movement mainly through the use of graphs, or the study of market movement based on historical stock price data to predict future price trends. The term price movement includes three basic sources of information available In the technical analysis (price, Trading and open rights) that are used in option contracts or futures contracts, so it is the art of reading the market or the art of reading stock market shares and the art of predicting stock market trends by studying the behavior and movements of stocks during specific periods. ( Murphy, 2000: 48)sees that the technical approach to investment is to study the development of the market, relying mainly on the base (curves, maps) in order to predict future trends, and see (Sharpe & Bailey, 2000: 288) that technical analysis is easy and fast. Once the technical method or technique that the technical analyst will determine in the price prediction is determined, it becomes automatically applied" to any number of shares and technical analysis techniques are easily learned and applied by any investor regardless of the level of culture and that the information needed by the analyst on the price and financial transactions are available daily "regularly in the daily reports appearing in specialized newspapers and the Internet.
B. The philosophy of technical analysis
In their decisions, technical analysts rely on the examination of previous price, volume and trading data to determine past market trends in which the future behavior of the market as a whole and individual securities can be forecasted. Several key assumptions support this view of price movements . , It summarized the following: (Francis, 1983, 434) ) (Indian, 2005: 61): -1) The market value of the securities shall be determined in the light of the interaction of supply and demand forces only. 2) Many factors control the supply and demand, including rational factors and other irrational factors. Including rational factors( financial information on the stock), which is reflected in the behavior of investors in the market, and factors that are not rational (such as opinions, moods, guessing, etc.), and the market to balance these factors automatically and continuously to determine the appropriate prices. 3) Securities prices tend to have relatively long periods of movement, although they may fluctuate slightly from time to time. 4) The change in the supply-demand relationship leads to a change in the direction of prices, and changes can be observed sooner or
later in market movement without the need to know the reasons.
C. Strengths and weaknesses in technical analysis
1) Strengths in Technical Analysis: The strengths of technical analysis can be distinguished by a set of points (Didi, 2003: 64): Focus on the price: The policy of investment in stocks of buying and selling decisions depends on the share price forecast. If the expectation of the share price increase, the investment decision will be the purchase and vice versa, and the stock market is seen as a basic indicator of the economy, Its indicators are ahead of the actual situation of the economy by six to nine months.
2) Determining the forces of supply and demand through price analysis: The use of data (opening price, highest price, lowest price and closing price) when analyzing the price direction of a stock may mean nothing if used separately,but together reflect the forces of supply and demand.
3) Support / Resistance: The charts show the balance of the supply and demand forces of a stock., When prices affect this range down or break through it, it indicates that one of them overcomes the other, breaking the upper limit (resistance) means increasing demand and breaking the minimum limit (support) means increasing the supply. 4) Price History Illustrator: Price charts make it easy to read the previous date at certain time intervals and are much easier to read than the tables. In most stock charts you find the columns of quantities at the bottom of the chart. Assistance in determining the time of entry and exit from the market: Technical analysis is used to determine the best time to enter or exit the market.
given to two technical analysts may read each of the different way and draws a different scenario, both will support reading the points of support and logical resistance, Break points and breakage as well.
3) Technical analysis signals are delayed: technical analysis is too late; the direction of the movement of the stock is not determined until after a significant portion of the movement has already occurred. Therefore, after this large move, the return to risk ratio has fallen significantly and lost part of the opportunity. It is also a catch on Dow's famous theory.
V. THE APPLIED SIDE OF THE RESEARCH
This focus focuses on the results of the test of the technical analysis indicators, in addition to discussing the results of the test of these indicators of the shares of banks sample study in order to test hypotheses of the study.
A. Simple average index
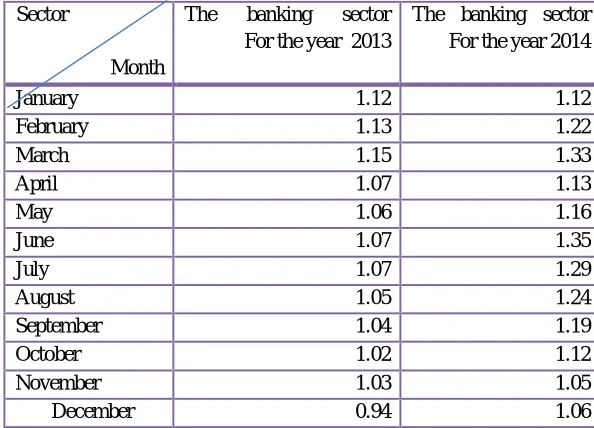
Table (1) presents the results of the monthly averages of the simple average index of the banking sector and for 2013 (2014), which confirms the validity of the hypothesis of relying on the simple average index in the future forecast of the trend of stock prices in the Iraqi market for securities. The table shows that the trend of the market movement of the banking sector was a downward trend. The sector started with an average price of 1.12 and ended with an average price of 0.94 in 2013. In 2014 it started with a price average of 1.12 and ended with an average price of (1.06).
Table( 1) Monthly averages of the simple average index of the banking sector
The banking sector For the year 2014
The banking sector
For the year 2013
Sector Month 1.12 1.12 January 1.22 1.13 February 1.33 1.15 March 1.13 1.07 April 1.16 1.06 May 1.35 1.07 June 1.29 1.07 July 1.24 1.05 August 1.19 1.04 September 1.12 1.02 October 1.05 1.03 November 1.06 0.94 December
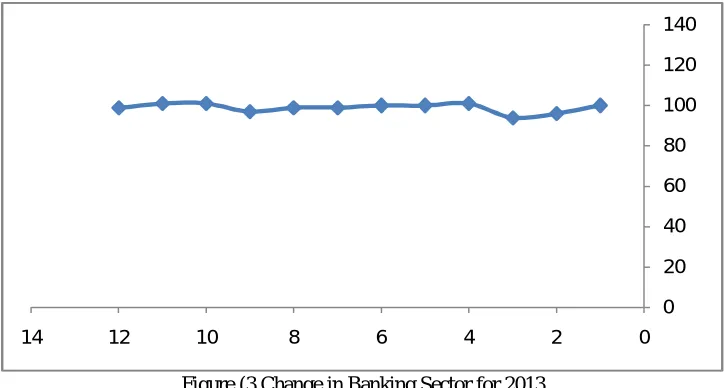
Figures 1 and 2 show the direction of the market movement of the banking sector and the two years of research figure (1)
Market movements Trends of the Banking Sector for 2013
Figures (1) and (2) confirm Table (1) of the ascending and descending stock movements shown in the chart of the figure
.
[image:7.612.155.452.295.509.2]
Using the SPSS program to test results, the following results were obtained:
Table (2)Test the Simple Average index of the banking sector F * T * Standard Deviation Simple Average Data Year 5.281 -3.815 05578 1.0625 12 2013 -3.815 09971 1.1883 12 2014
* significant level 5%
The results of the statistical analysis in Table 2 show that the value of the significant value of the Levine test is (0.03), which is less than (0.05) indicating that there is great homogeneity between the sample data represented by the two research years 2013/2014. The calculated T value of the simple average index (-3.815)With a significant level of 5% acceptance of the hypothesis of the study that there is a statistical significance in the possibility of predicting the direction of stock prices using the simple average of the banking sector in the Iraqi market for securities), which confirms these results F test its statistical acceptance; it was calculated (5.281) at a significant level (5%) and at freedom degree (22).
B. Change rate index
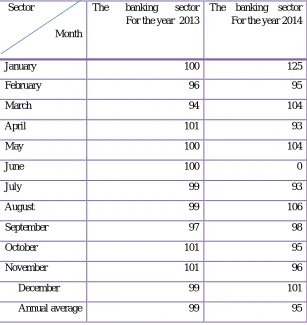
Table (3) presents the results of the monthly averages of the rates of change for the banking sector and for the years 2013 -2014 . The table shows that the rate of speed of the price trend of the banking sector in the year 2013 was (99%), which is very close to the rate of speed of the trend of prices for the banking sector for the year 2014 , amounting to (95%) and this confirms the validity of the hypohesis,
Table(3)
Monthly averages of change rates for the banking sector (%)
The banking sector For the year 2014
The banking sector
For the year 2013
[image:8.612.153.460.396.721.2]Figures (3, 4) show the direction of the market movement of the banking sector and the two years of research.
Figure (3 Change in Banking Sector for 2013
Figures (3) and (4) confirm Table (3) of the ascending and descending stock movements shown in the chart of the figure.
Figure (4 Change Rate in Banking Sector for 2014
Using the SPSS program to test results, the following results were obtained:
Table (4) Test the Change Rate Index of the banking sector
F * T *
Standard Deviation Simple Average
Data
Year
129 4.123
2.19331 98.9167
12 2013
4.123 2.90637
94.5833 12
2014
* significant level 5%
The results of the statistical analysis in Table 4 show that the value of the significant value of the Levine test is (0.01 ), which is less than (0.05) indicating that there is great homogeneity between the sample data represented by the two research years 2013/2014. The calculated T value of the Change rate index( 4.123) With a significant level of 5% acceptance of the hypothesis of the study that there is a statistical significance in the possibility of predicting the direction of stock prices using the Change rate of the banking
0 20 40 60 80 100 120 140
0 2
4 6
8 10
12 14
0 20 40 60 80 100 120 140
0 2
4 6
8 10
[image:9.612.125.489.89.283.2] [image:9.612.121.487.311.502.2]sector in the Iraqi market for securities , which confirms these results F test its statistical acceptance; it was calculated (5.281) at a significant level (5%) and at freedom degree (22).
C. Momentum index
Table 5 shows the monthly averages of momentum rates for the banking sector and for the years 2013 -2014 . Following the results, we note that the trend ofchange in banking sector prices for 2013 is a downward trend, starting with an average of 0.27 in January and ending with an average change rate of 0.02 in January. The banking sector for 2014 was also an extension of the previous year (a downward trend) The year started with a change rate of 0.09 in January and the year ended with a change rate of 0.01 in December .
Table (5 Monthly averages of momentum rates for the banking sector)
The banking sector For the year 2014
The banking sector
For the year 2013
Sector
Month
0.09 0.27
January
-0.07 -0.04
February
0.10 -0.04
March
-0.09 0.01
April
0.04 0.01
May
1.32 0
June
-0.09 -0.21
July
0.84 -0.01
August
0.20 -0.04
September
-0.06 0.03
October
0.04 0.22
November
0.01 0.02
December
Figure (5) (6) confirms Table (5) of the ascending and descending stock movements shown in the chart of the figure.
Figure (5) The momentum of the banking sector for the year 2013
-0.3
-0.2
-0.1 0 0.1 0.2 0.3
0 2
4 6
8 10
12 14
[image:10.612.154.455.216.431.2] [image:10.612.125.488.458.713.2]
Figure (6 The momentum of the banking sector for the year 2014
Using the SPSS program to test results, the following results were obtained:
Table (6) Test the of momentum rate index of the banking sector F * T * Standard Deviation Simple Average Data Year 9.636 -2.379 .04144 0.242 12 2013 -2.379 .08912 0917. 12 2014
* significant level 5%
The results of the statistical analysis in Table 6 show that the value of the significant value of the Levine test is (0.05 ), which is equal to (0.05) indicating that there is homogeneity between the sample data represented by the two research years 2013/2014. The calculated T value of the momentum rate index (-2.379) with a significant level of 5% acceptance of the hypothesis of the study that there is a statistical significance in the possibility of predicting the direction of stock prices using the of momentum rate of the banking sector in the Iraqi market for securities , which confirms these results F test its statistical acceptance; it was calculated (9.636 ) at a significant level (5%) and at freedom degree (22).
D. Relative Strength Index
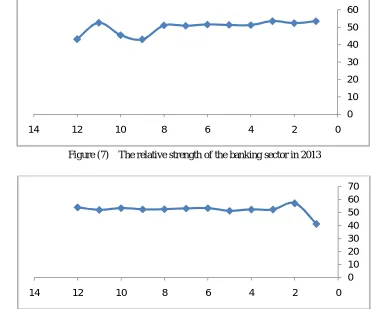
Table (7) shows the rates of relative strength of the banking sector for the year 2013-2014 and by observing the annual average rate of the banking sector for the year 2013 we note that it reached (50) which is very close to the year 2014 reached (52) indicating that
investment in the sector during 2013-2014 requires A very cautious process, which confirms the validity of the hypothesis.
Table (7)Relative strengths of the banking sector
The banking sector For the year 2014
The banking sector
For the year 2013
[image:11.612.125.487.89.272.2] [image:11.612.124.502.332.408.2] [image:11.612.158.453.582.726.2]52.70 51.06 August 52.55 43.01 September 53.52 45.47 October 52.17 52.61 November 54.11 43.15 December 52 50 Annual average
This can be illustrated in Figures( 7 )and( 8) , and Figure( 7 )(8) confirms Table (7) of the rising and descending stock movements illustrated in the figure chart
Figure (7) The relative strength of the banking sector in 2013
Figure (8) The relative strength of the banking sector in 2014
Using the SPSS program to test results, the following results were obtained:
Table (8) Test the relative strength index of the banking sector F * T * Standard Deviation Simple Average Data Year 7.211 -2.461 3.82662 49.9758 12 2013 -2.461 1.72538 52.9583 12 2014
* significant level 5%
The results of the statistical analysis in Table 8 show that the value of the significant value of the Levine test is (0.01 ), ), which is less than (0.05) indicating that there is homogeneity between by the two research years 2013/2014. The calculated T value of the relative strength index (-2.461) with a significant level of 5% acceptance of the hypothesis of the study that there is a statistical significance in the possibility of predicting the direction of the banking sector in the Iraqi market for securities , which confirms these results F test its statistical acceptance; it was calculated (7.211 ) at a significant level (5%) and at freedom degree (22
[image:12.612.158.456.77.165.2] [image:12.612.112.489.203.512.2] [image:12.612.119.504.577.641.2]VI. CONCLUSIONS AND RECOMMENDATIONS
Conclusions
.
A
1) Technical analysis is an important tool in the financial markets through its influence on investor decisions regarding the determination of stock prices and trends in the future, as well as the purchase decision, the sale decision or even the stop loss decision.
2) The technical analysis is clear and easy to use, and the understanding and understanding of the technical analysis and its importance and degree of dependence are not affected by the investor's personal data such as (the scientific qualification, the investment entity, the value of the invested capital), but is influenced by the number of years of investment that increase the development of their predictive capabilities.
3) The results showed that technical analysis tools can be used to obtain the best outlook for ordinary shares based on historical data. The statistical test proved the existence of statistical significance in the possibility of relying on the indicators of the simple average and the rate of change and momentum and the relative strength in the prediction of share prices of banks listed in the Iraqi market Securities.
4) The index of the simple medium and the rate of change and momentum and relative strength of the most technical indicators used and most versatile in use and the best models that can be adopted in the future prediction in light of what reflected the results of tests for a period of (360) days, although the degree of accuracy in some, But their ability to take into consideration all possible market changes in the values of actual indicators within the market.
B. Recommendations
Guided by the analysis of the results and the conclusions that are consistent or separated partially or completely with the accumulation of knowledge in the process of analyzing the behavior of ordinary stock prices using technical analysis tools can be identified some recommendations that the investor whether the individual or institutions to be guided and benefit from them can be explained as the following :
1) The need for the Iraq Stock Exchange to strengthen the position of technical analysis as a qualitative tool used to improve the investor's decision and increase the ability to analyze and forecast,, And this can be done through the Commission's request to provide a technical analyst in the brokerage companies, and the work of seminars and courses and competitions to serve this goal.
2) Technical analysis techniques, especially the index of moving averages and relative strength, have a good degree of credibility, as it enabled us to know the timing and signals that indicate the sale or purchase, and these signals appear before the event in short periods,By knowing these signals, we will be able to accurately track the operations, thus maximizing the potential profit. 3) Urging academic institutions to increase the visibility of technical analysis by encouraging research and studies, and opening the
specialization of financial markets.
4) The results of this research should be treated with caution because of the small size of the market and the relatively small size of the sample, in addition to the abnormal situation experienced by the Iraqi economy, not to mention the low efficiency of the market compared to developed financial markets. 5) Repeat the conduct of such a study on other companies to confirm the results reached, especially with companies that were not included in the research sample.
REFERENCES
[1] Abu Asi, Ayedah Adnan, "The Effectiveness of Using Technical Analysis Techniques on the Saudi Stock Market", A Field Study for 2004-2005, Master Thesis, University of Science and Technology, Yemen, 2006.
[2] Al-Muhaili, Abdul Majid, "Technical Analysis of Financial Markets", Al-Balagh for Printing, Publishing and Distribution, 5th edition, 2006. [3] Badawi, Mohammed Ibrahim, Stock Trading (www.Sandroses.com), 2003. 4- Bodei, Zvi, Alex kane and Alan J. Marcus, 1998, “Essentials of investment”, Irwin, McGraw–Hill, 3rd Ed .
[5] Chen, James, "Essentials of Technical Analysis forFinancial Markets Hoboken", John Wiley &Son,.Common Shares,2010. 6- D. R. Edwards, J. Magee, "Technical analysis of stock trends", 7th edition, John Magee Inc Chicago, Illinois, 1992.
[7] Edwards, Robert D.& Magee, John, "Technical Analysis of Stock Trends", Ninth Edition, United States of America: Taylor Francis Group, 2007. 8] Fatih, Manna, "The role of technical analysis in the rationalization of investment decision, a field study of the Saudi
stock market, Master Thesis, University of Mentori, Algeria 2008.
[9] Francis, Jack Clark, , “Management of investment”, McGraw–Hill, Inc., International Student Edition, 1983.
[10] Hindi, Mounir Ibrahim, "Investment Tools in the Capital Markets - Securities and Investment Funds", Modern Arab Office, Alexandria, Egypt, 2005. [11] Murphy, John J," Charting Made Easy", Copyright © Marketplace Books for portions of the text, 2000.
[12] MURPHY John J, “Technical Analysis Of The Financial Markets”. New York institute of finance, New York, 1999.
[14] Menkhoff, and Taylor, The Obstinate Passion of Foreign Exchange Professionals: Technical Analysis, 2006.
[15] Neftci ,Naive Trading Rules in Financial "Markets:" A Study of (Technical Analysis),1991.
[16] Osler, Currency Orders and Exchange Rate Dynamics: An Explanation for the Predictive success of Technical Analysis, 2002.
[17]Pring M.J., "Technical Analysis Explained", McGraw-Hill Co., 1991
[18] Pring, Martin J. Technical Analysis Explained, The Successful Investor's Guide to Spotting Investment Trends and Turning Points, Fourth Edition, New York: McGraw-Hil,l2002.
[19] Sharpe, William & Bailey, Jeffery "Investment" john Wiley &sons, 2000.
[20] Stevenson, Richard A. and Jennings, Edward H., “Fundamentals of Investments” , 2nd .ed ., N.Y : West Publishing Co.,1981. [21] Yaqoot, Nawal Mahmoud, "The Effectiveness of Technical Analysis in Forecasting Foreign Exchange Rates, The Scientific Journal of the Faculty of Commerce, No. 17, Al-Azhar University, Cairo, Egypt, 2000.