Adaptive Cuckoo Search based Image Segmentation
M.S.R. Naidu1, P. Rajesh Kumar2
Department of Electronics and communication Engineering
1
Aditya institute of technology and management (AITAM), Tekkali, Andhrapredesh, India
2
A.U.College of engineering (A), Andhra university, Visakhaptnam, Andhrapredesh, India
Abstract: Image segmentation is a method of segregating the image into required segments/regions. Image thresholding being a simple and effective technique, mostly used for image segmentation and these thresholds are optimized by optimization techniques by maximizing the Shannon and Fuzzyentropy. However, as the two level thresholding is extends to multi-level thresholding, the computational complexity of the algorithm is further increased. So there is need of evolutionary and swarm optimization techniques. In this paper, first time optimal thresholds are obtained by maximizing the Shannon and Fuzzyentropy by using novel adaptive cuckoo search algorithm (ACS). The proposed ACS algorithm performance of image segmentation is tested using natural and standard images. Experiments shows that proposed ACS is better than firefly algorithm (FA) and cuckoo search (CS).
Keywords: image segmentation, image thresholding, Shannon and Fuzzy entropy, cuckoo search, firefly algorithm
I. INTRODUCTION
In this paper, first time we applied ACS based image thresholding for image segmentation by optimizing the Shannon and Fuzzy entropy and compared the results with other optimization techniques such as FA and CS. For the performance evaluation of proposed ACS based image thresholding we consider objective function value, Misclassification errorand Structural Similarity Index (SSIM). In all parameters the proposed algorithm performance is better compared than FA and CS.
II. CONCEPT OF SHANNON AND FUZZY ENTROPY
A. Concept of Shannon Entropy
Entropy is the compressive procedure of information which results higher rate of compression and high speed of transmission which
compresses the required number of bits depending on the observation of repetitive information/message. If there are N = 2n (if N =
8) messages to transmit, n (n = 3) bits are required, then for each of N messages, number of bits required is log2N bits. If one
observes the repetition of same message from a collection of N messages as well as the messages can be assigned a non-uniform probability distribution, it will be possible to use fewer than logN bits per message. This is introduced by Claude Shannon based on
the Boltzmann's Η-theorem and is called as Shannon entropy, Let X is random variable (discrete) with elements {X1,X2 …, Xn}, then
probability mass function P(X) is given as
( ) = [ ( )] = [−ln ( ( ))] (1)
Where E is the expected value operator, I show the content of information and I(X)is also a random variable. Further the Shannon
entropy is re-written as in Eq (2) and is considered as the objective function which is to be optimized with optimization techniques.
( ) =∑ ( ) ( ) =− ∑ ( ) ( ) (2)
Where b base of the algorithm in general it is equal to 2. If P(xi) = 0 for some i then the multiplier 0logb0 is considered as zero,
which is consistent with the limit.
lim → ( ) = 0 (3)
The said equations are for discrete value of X and the same are applicable for continuous values of X by replacing summation with
integer.
B. Concept of Fuzzy Entropy
Let D={(i,j):i=0,1,2,…..,M-1; j=0,1,2,…….N-1} and G={0,1,2,……,L-1}, Where M is width of image, N is height of image and L is
number of gray level in image. I(x,y) is the intensity of image at position (x,y) and Dk = {(x,y):I(x,y) = k, (x,y) = D},
k=0,1,2,…..,L-1. Let us assume two thresholds i.e. T1, T2 which divide the domain D of the original image into three regions such as Ed, Emand Eb.
Ed region covers the pixels whose intensity value is less than T1, Em contains the pixels whose intensity is in between T1, T2 and Eb
covers the pixels whose intensity is greater than T2. Π3={Ed, Em, Eb} is an unknown probabilistic partition of D whose probability
distribution is given in (11).Pd =P(Ed)Pm =P(Em)Pb =P(Eb). µd, µm and µb are the membership functions (µ) of Ed, Em and Eb
respectively and require six parameters like a1, b1, c1, a2, b2, c2. The thresholds T1 and T2 values are variable based on the
membership functions. For each k=1, 2,…., 255, let
Dd={(x, y) : I(x, y) ≤ T1, (x, y) ∈Dk} (4)
Dm= {(x, y) : T1< I(x, y) ≤ T2, (x, y) ∈Dk} (5)
Db= {(x, y) : I(x, y) > t2, (x, y) ∈Dk} (6)
If the conditional probability of Ed, Em and Ebis pd|k, pm|k and pb|k respectively under the circumstance that the pixel pertains to Dk
with pd|k + pm|k+pb|k = 1(k=0, 1, 2,….., 255) then above equations can be rewritten as
= = × / (7)
= ( ) = × / (8)
= ( ) = × / (9)
Let the grade of pixels with gray level value of k belong to the class dark (Ed), dust (Em) and bright (Eb) be equivalent to their
=∑ ∗ / =∑ ∗µ ( ) (10)
=∑ ∗ / =∑ ∗µ ( ) (11)
=∑ ∗ / =∑ ∗µ ( ) (12)
The fuzzy membership functions are drawn and shown in Fig. 1. The function Z (k, a1, b1, c1, a2, b2, c2), U(k, a1, b1, c1, a2, b2, c2) and
S(k, a1, b1, c1, a2, b2, c2) are assigned as membership functions of class dark µd(k), dust µ m(k) and bright µb(k) respectively. Then the
membership functions are given as
1 2
1
1 1
1 1 1 1
2 1
1 1
1 1 1 1
1
1
(
)
1
(c
a ) (b
a )
(k)
(
)
(c
a ) (c
)
0
dk
a
k
a
a
k
b
k
c
b
k
c
b
k
c
(13) 1 2 1 1 11 1 1 1
2 1
1 1
1 1 1 1
1 2
2 2
2 2
2 2 2 2
2 2
2 2
2 2 2 2
2
0
(
)
(c
a ) (b
a )
(
)
1
(c
a ) (c
)
(k)
1
(
)
1
(c
a ) (b
a )
(
)
(c
a ) (c
)
0
mk
a
k
a
a
k
b
k
c
b
k
c
b
c
k
a
k
a
a
k
b
k
c
b
k
c
b
k
c
(14) 2 2 2 2 22 2 2 2
2 2
2 2
2 2 2 2
2
0
(
)
(c
a ) (b
a )
(k)
(
)
1
(c
a ) (c
)
1
bk
a
k
a
a
k
b
k
c
b
k
c
b
k
c
(15)The above said equations are written by assuming 0≤a1<b1<c1<a2<b2<c2≤255. Then, the fuzzy entropy function of each class could
be given as (12)
=− ∑ ∗µ ( )∗ln ( ∗µ ( )) (16)
=− ∑ ∗µ ( )∗ln ( ∗µ ( )) (17)
=− ∑ ∗µ ( )∗ln ( ∗µ ( )) (18)
The whole fuzzy entropy is calculated through summarizing fuzzy entropy of each class i.e.
The above equation is an objective function which is to be optimized with the optimization techniques. Optimization techniques
optimize or maximize H (a1, b1, c1, a2, b2, c2) function by varying a1, b1, c1, a2, b2, c2. Once these values are optimized, then threshold
values are calculated with the following equation
µd(T1) = µm(T1) = 0.5 and µm(T2) = µb(T2) = 0.5 (20)
From Fig. 1 it is observed that T1 and T2 are the point of interaction of µd(k), µm(k) and µb(k) curve. From Eqs (13)-(15), the values
of T1 and T2 calculated with the below equation
1 1 1 1
1 1 1 1 1
1
1 1 1 1
1 1 1 1 2
(c
a ) (b
)
(a
c ) / 2
)
2
(c
a ) (c
)
a
(a
c ) / 2
2
a
a
b
c
T
b
c
b
(21)
2 2 2 2
2 2 2 2 2
2
2 2 2 2
2 2 2 2 2
(c
a ) (b
)
(a
c ) / 2
2
(c
a ) (c
)
a
(a
c ) / 2
2
a
a
b
c
T
b
c
b
(22)
As per the requirements of researchers, the two level thresholding can be extended to three or more and can be restricted to single level also. For two thresholds the number of parameters to be optimized is six and as levels of increasing number parameters to be optimized is also increasing, so fuzzy entropy takes much time for convergence. Hence two level image thresholding for image segmentation with the Shannon entropy and Fuzzy entropy proved to be efficient and effective but for multilevel thresholding, both entropy techniques consume much convergence time and increase exponential with level of thresholds. The drawback of Shannon entropy and Fuzzy entropy is convergence time. To improve the performance of these methods further and to reduce the convergence time, researchers used applications of optimization techniques such as differential evolution, Particle swarm optimization, Bat algorithm and Firefly algorithm for image thresholding and henceforth image segmentation. These techniques are set to maximize the Shannon entropy and Fuzzy entropy as given in Eq (2) and (19).
C. Novel Adaptive Cuckoo Search Algorithm
The CS algorithm is projected by Yang in 2010 [14] and cuckoos step of walk follows the Levy distribution function and obeys the either Mantegna algorithm or McCulloch’s algorithm. In the proposed technique, we follow a specific strategy instead of Levy distribution function. The normal CS does not have any appliance to switch the step size in the repetition process, which can lead the method to extent universal minima or maxima. Here, we try to include a step size which is relative to the suitability of the
discrete nest in the search space in the present generation. The tuning parameter α is fixed in the literature. In our proposed algorithm step size follows the following equation [25]
(( (t) (t)) ( (t) worst (t)))
1
(t 1)
( )
bestf fi bestf fi
step
t
(23)Where t is the iteration search algorithm; fi(t) is the objective value ith nest in the iteration t; bestf(t) is the best objective in iteration
t; worstf(t) is the worst objective value in the iteration t. Initially high value of step size is considered and is decreasing with the increment in iteration. It shows the algorithm tries to global best solution. From Eq. (24), Step size is depends upon the iterations and it shows adaptive of step size of the algorithm. From the observation step size is adaptive and chooses its value based on the fitness value. The population follows the following equation.
Xi (t + 1) = Xi (t) + randn × stepi (t + 1) (24)
The major benefit of the naval adaptive cuckoo search is that it does not need any preliminary parameter to be distinct. It is quicker than the cuckoo search algorithm.
Xi (t + 1) = Xi (t) + randn × stepi (t + 1) × Xi (t) − Xgbest (25)
Where Xgbest is the universal solution amongst all Xi for I (for i = 1, 2, . . .,N)at time t.
III. RESULTS AND DISCUSSIONS
225×225 and corresponding histograms are shown in Fig. 1. In general, perfect threshold can be selected if the histogram of image peaks is lanky, thin, symmetric, and divided by unfathomable valleys. Goldhill and pirate image histograms peaks are tall, narrow and symmetric, but for Lena image histogram peaks are not tall and narrow so difficult to segment with ordinary methods. So we proposed adaptive cuckoo search algorithm based image thresholding for effective and efficient image segmentation of above said critical images by optimizing Shannon and Fuzzy entropy. The performance and effectiveness of proposed adaptive CS proved better compared to other optimization techniques like FA and CS.
Fig.1. Standard image and respective histograms of three methods a) Lena b)Goldhill c) Pirate d) Satrfish
A. Maximization of Shannon and Fuzzy entropy
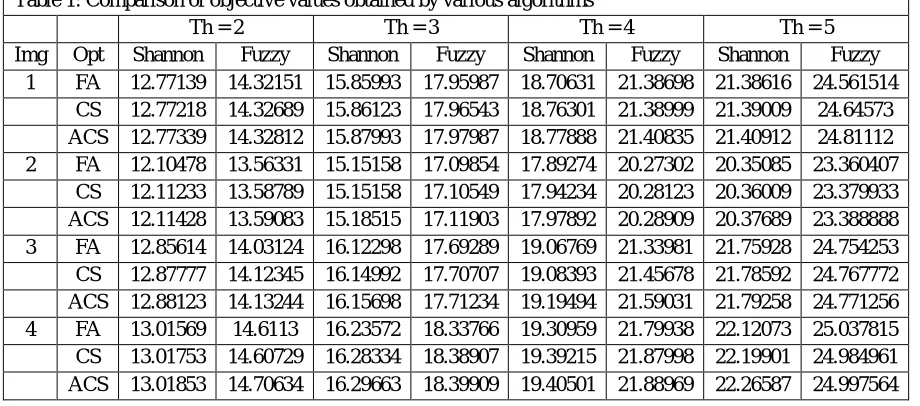
The ACS and other two algorithms are applied on Shannon and Fuzzy entropy objective function and compared the results of FA and CS. All the algorithms are optimized to maximize the objective function. Table.1show the objective values of ACS, CS and FA. It is observed from Table. 1 that objective values obtained with ACS by using Shannon and Fuzzy entropy is higher than the FA and CS for different images.
Table 1: Comparison of objective values obtained by various algorithms
Th = 2 Th = 3 Th = 4 Th = 5
Img Opt Shannon Fuzzy Shannon Fuzzy Shannon Fuzzy Shannon Fuzzy
1 FA 12.77139 14.32151 15.85993 17.95987 18.70631 21.38698 21.38616 24.561514
CS 12.77218 14.32689 15.86123 17.96543 18.76301 21.38999 21.39009 24.64573
ACS 12.77339 14.32812 15.87993 17.97987 18.77888 21.40835 21.40912 24.81112
2 FA 12.10478 13.56331 15.15158 17.09854 17.89274 20.27302 20.35085 23.360407
CS 12.11233 13.58789 15.15158 17.10549 17.94234 20.28123 20.36009 23.379933
ACS 12.11428 13.59083 15.18515 17.11903 17.97892 20.28909 20.37689 23.388888
3 FA 12.85614 14.03124 16.12298 17.69289 19.06769 21.33981 21.75928 24.754253
CS 12.87777 14.12345 16.14992 17.70707 19.08393 21.45678 21.78592 24.767772
ACS 12.88123 14.13244 16.15698 17.71234 19.19494 21.59031 21.79258 24.771256
4 FA 13.01569 14.6113 16.23572 18.33766 19.30959 21.79938 22.12073 25.037815
CS 13.01753 14.60729 16.28334 18.38907 19.39215 21.87998 22.19901 24.984961
ACS 13.01853 14.70634 16.29663 18.39909 19.40501 21.88969 22.26587 24.997564
B. Misclassification error /Uniformity measure
It is measure of uniformity in threshold image and is used to compare optimization techniques performance. Misclassification error is measured by Eq. 26
2
0
2 m a x m i n
( I )
1 2
( I I )
j
T h
i j
j i R
M T h
N
(26)
0 50 100 150 200 250 300 0
100 200 300 400 500 600
0 50 100 150 200 250 300 0
100 200 300 400 500 600 700 800 900 1000
0 50 100 150 200 250 300 0
100 200 300 400 500 600
0 50 100 150 200 250 300 0
50 100 150 200 250 300 350 400 450
(a) (a') (b) (b')
[image:6.612.78.538.426.629.2]Where Th is the number of thresholds which are used to segment the image, Rj is the jth segmented region, Iiis the intensity level of
pixel in that particular segmented area, σj is the mean of jth segmented region of image, N is total number of pixels in the image, Imin
and Imax are the maximum and minimum intensity of image respectively. In general misclassification errors lies between 0 and 1 and
higher value of misclassification error shows better performance of the algorithm. Hence, the Uniformity measure in thresholding is measured from the difference between the maximum value, 1 (better quality of image) and minimum value, 0 (worst quality of image). Table.2 shows misclassification error of proposed and other techniques and proved proposed method have lesser misclassification error and shows better visual quality.
C. Structural Similarity Index (SSIM)
It estimates the visual likeness between the input image and the decompressed image/thresholded image and is calculated with below equation
2 2 2 2
(2
C1)(2
C2)
(
C1)(
C2)
I I II
I I I I
SSIM
(27)
Where µI and µĨ are the mean value of the input image I and decompressed image Ĩ, σIand σĨ are the standard deviation of original
image I and reconstructed image Ĩ, σIĨ is the cross-correlation and C1 & C2 are constants which are equal to 0.065. Table.3 shows
[image:7.612.85.533.338.743.2]the SSIM of various methods with Shannon and Fuzzy entropy and it demonstrate proposed method SSIM is higher than other methods. Fig. 2 shows the segmented images and respective optimized 5 level thresholds with ACS and it shows segmentation with ACS is better than FA and CS.
Table 2: Comparison of Misclassification error values obtained by various algorithms
Th = 2 Th = 3 Th = 4 Th = 5
Img Opt Shannon Fuzzy Shannon Fuzzy Shannon Fuzzy Shannon Fuzzy
1 FA 0.959567 0.94826 0.93835 0.946852 0.867879 0.902922 0.498263 0.7233069
CS 0.95271 0.93731 0.91860 0.93890 0.85217 0.90187 0.48313 0.718661
ACS 0.95178 0.92831 0.90150 0.92070 0.88761 0.89235 0.48188 0.710272
2 FA 0.97102 0.93072 0.923627 0.909869 0.796942 0.723765 0.68383 0.6179214
CS 0.97001 0.92345 0.913627 0.923451 0.795432 0.721823 0.65383 0.6079214
ACS 0.96897 0.92090 0.910917 0.920988 0.791234 0.713765 0.62383 0.605123
3 FA 0.956984 0.93086 0.943455 0.933864 0.863431 0.896563 0.811681 0.8350455
CS 0.95520 0.92980 0.94200 0.931770 0.860297 0.89569 0.806531 0.821425
ACS 0.95513 0.92884 0.94160 0.930070 0.859665 0.893245 0.80554 0.812485
4 FA 0.964161 0.94357 0.925283 0.915473 0.91566 0.902217 0.800406 0.7304659
CS 0.964089 0.94427 0.920442 0.914187 0.915002 0.90105 0.798476 0.7290859
ACS 0.963951 0.94051 0.914453 0.913383 0.914091 0.90019 0.786292 0.7289454
Table 3
Comparison of SSIM obtained by various algorithms
Th = 2 Th = 3 Th = 4 Th = 5
Img Opt Shannon Fuzzy Shannon Fuzzy Shannon Fuzzy Shannon Fuzzy
1 FA 0.706563 0.69509 0.775408 0.700278 0.797999 0.732765 0.83524 0.7979711
CS 0.70895 0.69909 0.77923 0.711089 0.798996 0.734453 0.836085 0.7980472
ACS 0.70931 0.70662 0.779972 0.747751 0.800821 0.710816 0.839444 0.799019
2 FA 0.655872 0.645513 0.741531 0.694545 0.786991 0.732217 0.822033 0.8096297
CS 0.661256 0.66495 0.77309 0.717896 0.80078 0.74784 0.838786 0.810092
ACS 0.679484 0.67148 0.78689 0.729373 0.81937 0.750465 0.84775 0.820192
3 FA 0.670661 0.61131 0.754686 0.720464 0.801608 0.819659 0.745729 0.8431184
CS 0.682929 0.63939 0.754729 0.722939 0.805001 0.820921 0.751023 0.844123
0 50 100 150 200 250 300 0 50 100 150 200 250 300 350 400 450
pixel intensity
h ist og ra m ,T h re s ho ld s histogrm Thresholds
4 FA 0.584474 0.52503 0.682892 0.765436 0.721905 0.719282 0.78991 0.7724659
CS 0.584742 0.58382 0.687281 0.779821 0.733932 0.722828 0.791383 0.7984992
ACS 0.584812 0.58931 0.689112 0.789392 0.749912 0.723372 0.792992 0.8349492
Fig.2. Segmented images and respective optimized 5 level thresholds with ACS
IV. CONCLUSIONS
In this paper, we proposed natural inspired adaptive cuckoo search algorithm based multilevel image thresholding for image segmentation. ACS maximizes the Fuzzy and Shannon entropy for efficient and effective image thresholding. The proposed algorithm is tested on natural images to show the merits of the algorithm. The results of the proposed method are compared with other optimization techniques such as FAand CS with Shannon and Fuzzy entropy. From the experiments we observed that proposed algorithm has higher/maximum fitness value compared to FA and CS. The SSIM value shows higher values with proposed algorithm than FA and CS. It is concluded that proposed algorithm outperform the FA and CS in all performance measuring parameters.
REFERENCES
[1] De Luca. A, S. Termini, A definition of non-probabilistic entropy in the setting of fuzzy sets theory, Inf. Control 20 (1972) 301–312.
[2] Sezgin. M, B. Sankur, Survey over image thresholding techniques and quantitative performance evaluation, J. Electron. Imaging 13 (1) (2004) 146–165. [3] Kapur. J. N, P.K.Sahoo, A.K.C Wong, A new method for gray-level picture thresholding using the entropy of the histogram”, Computer Vision Graphics Image
Process. 29 (1985) 273 – 285.
[4] Otsu. N, “A threshold selection from gray level histograms” IEEE Transactions on System, Man and Cybernetics 66, 1979.
[5] Sathya. P. D and R. Kayalvizhi, “Optimal multilevel thresholding using bacterial foraging algorithm”, Expert Systems with Applications, Vol. 38, pp. 15549– 15564, 2011.
[6] Mbuyamba. M, J. Cruz-Duarte , J. Avina-Cervantes, C. Correa-Cely, D. Lindner, and C. Chalopin, “Active contours driven by Cuckoo Search strategy for brain tumour images segmentation”, Expert Systems With Applications, Vol. 56, pp. 59–68, 2016.
[7] Ye. Z, M. Wang, W. Liu, S. Chen, “Fuzzy entropy based optimal thresholding using bat algorithm”, Applied Soft Computing, Vol. 31, pp. 381–395, 2015. [8] Agrawal. S, R. Panda, S. Bhuyan, B.K. Panigrahi, “Tsallis entropy based optimal multilevel thresholding using cuckoo search algorithm”, Swarm and
Evolutionary Computation, Vol. 11 pp. 16–30, 2013.
[9] Horng. M and T. Jiang, “Multilevel Image Thresholding Selection based on the Firefly Algorithm”, Symposia and Workshops on Ubiquitous, Autonomic and Trusted Computing, pp. 58–63, 2010.
[10] Bhandari. A. K, A. Kumar, G. K. Singh, "Tsallis entropy based multilevel thresholding for colored satellite image segmentation using evolutionary algorithms”, Expert Systems With Applications, Vol. 42, pp. 8707–8730, 2015.
[11] Zhao. M, A.M. Fu, H. Yan, A technique of three-level thresholding based on probability partition and fuzzy 3-partition, IEEE Trans. Fuzzy Syst. 9 (2001) 469– 479.
[12] Tao. W, H. Jin, L. Liu, Object segmentation using ant colony optimization algorithm and fuzzy entropy, Pattern Recognit. Lett. 28 (2007) 788–796.
[13] Yudong Zhang, Lenan Wu, Optimal multi-level thresholding based on maximum Tsallis entropy via an artificial bee colony approach, Entropy 13 (4) (2011) 841–859.
[14]Yang. X.S, S. Deb, Cuckoo search via Levy flights, in: Proc. IEEE Conf. of WorldCongress on Nature & Biologically Inspired Computing, 2009, pp. 210–214. 0 50 100 150 200 2 50 300
0 100 200 300 400 500 600
pi xel inten sity
h isto gra m ,T hre shold s histogrm Threshol ds
Dec om pres sed Image (FA )
0 50 100 150 200 25 0 300 0 100 200 300 400 500 600
pixel intensi ty
histo gr am,T hre sholds histogrm Thresholds
0 50 100 150 200 250 300 0 100 200 300 400 500 600 700 800 900 1000
pix el intens ity
h is tog ra m ,T hre s ho ld s