Munich Personal RePEc Archive
Race and self-employment: The role of
training programs, self-employment
background, and access to financing
Michaelides, Marios
IMPAQ International, University of Maryland - College Park
1 February 2010
Race and Employment: The Role of Training Programs,
Self-Employment Background, and Access to Financing
Marios Michaelides
E-mail: [email protected] Phone: +1(202)215-1171
February 2010
Abstract
This paper uses data from Project GATE to examine the efficacy of offering free self-employment assistance to unemployed individuals interested in self-self-employment, overall and by race. We also examine the effect of participants’ self-employment background, finances, and personal circumstances on their self-employment outcomes. We find that Project GATE led to significant gains in the outcomes of unemployed participants, particularly for black participants. Our analyses also show that significant portions of the race disparities in self-employment outcomes among unemployed participants are attributed to race differences in access to financing. The policy implications of our findings are discussed.
JEL Classifications: J6, H4, L2.
Page 1
Introduction
Many unemployed workers in the U.S., particularly those in minority groups, view
self-employment as an attractive alternative to salary self-employment. In their efforts to start and operate
a successful business, however, these individuals are likely to face important obstacles, the most
important of which are lack of self-employment background and limited access to financing.
Previous research shows that among aspiring and existing business owners, nonwhites are more
likely than whites to face such obstacles, which partly explains the significant race disparities in
self-employment participation and success.
The challenges faced by unemployed individuals interested in starting their own business are
an important policy concern, especially since many of these may succeed if they receive
appropriate assistance. For this reason, in the past two decades policymakers have focused a lot
of attention on supporting unemployed workers achieve their self-employment goals. Besides the
federal and local government programs aiming to assist disadvantaged workers secure financing
for their small business, a number of self-employment demonstration programs were
implemented to provide free assistance to unemployed workers interested in self-employment.
The most recent of those programs is Project GATE (Growing America Through
Entrepreneurship), which was implemented from 2002 through 2005 in Maine, Minnesota, and
Pennsylvania.
Previous work has shown that self-employment programs, including Project GATE, are
effective in assisting unemployed workers start their own business and avoid returning to
unemployment. One open question, however, is whether such programs are as effective for
nonwhite participants, who may face more difficulties than their white peers in successfully
Page 2
there are any race disparities in the post-training outcomes of unemployed participants and
whether these may be attributed to race differences in characteristics related to self-employment
background and access to financing.
This paper uses Project GATE data to fill these research gaps. Our analyses focus on
estimating the impact of offering free self-employment assistance on the post-training outcomes
of unemployed participants, overall and by race. In addition, we estimate the effect of participant
characteristics related to self-employment background, finances, and other personal
circumstances on their self-employment outcomes. Based on our results, we are able to assess if
Project GATE had a heterogeneous impact on participant outcomes, by race, and the degree to
which the observed race disparities in self-employment outcomes are attributed to race
differences in the aforementioned characteristics.
1. Background
Self-employment rates for nonwhite workers in the U.S. have been historically lower than
those of white workers (Fairlie and Meyer, 1996; 2000). At the beginning of the 21st century,
nonwhite workers remain less likely than their white peers to be self-employed; tabulations of
the American Community Survey show that from 2006 through 2008, only 6.9% of nonwhite
workers in the U.S. were self-employed compared with 11.1% of white workers. There is also
significant evidence that minority-owned businesses have lower business receipts and
profitability and are more likely to close than white-owned businesses – this research is reviewed
nicely by Fairlie and Robb (2007a).
Race disparities in self-employment participation and success are partly attributed to race
differences in the obstacles faced by workers pursuing self-employment. Nonwhite workers, for
Page 3
(e.g., self-employment experience) than whites, so they are less likely to become self-employed
(Fairlie and Meyer, 1996; Fairlie, 1999, Smith, 2004, Reynolds et al., 2004) or run a successful
business (Bates, 1985; Loftstrom and Bates, 2007; Fairlie and Robb, 2007c). The lower
self-employment participation and success for nonwhite workers is also partly attributed to that they
are less likely than their peers to inherit or have experience working in a family business (Fairlie,
1999; Fairlie and Robb, 2007b; Hout and Rosen, 2000; Fairlie and Robb, 2007c). Furthermore,
nonwhites are less likely than whites to be able to adequately finance the creation or expansion
of their business. Specifically, among aspiring and existing business owners, nonwhites have
limited access to credit relative to whites due to their lower personal wealth, limited family
support, and lower credit history (Cavaluzzo and Walken, 2002; Blanchflower, et al., 2003;
Lofstrom and Bates, 2007).
Although pursuing self-employment entails numerous challenges, many unemployed
workers, particularly those in minority groups, view self-employment as an attractive alternative
to salary employment or as a way to avoid perceived and actual labor market discrimination
(Meager, 1992; Bates 1997; Rissman, 2003; Glocker and Steiner, 2007). In the past two decades,
policymakers have focused a lot of attention on promoting the reemployment of unemployed
workers through self-employment. This led to the establishment of programs that provided free
self-employment assistance to unemployed workers interested in starting their own business. The
rationale was that such programs may assist these individuals overcome the important challenges
associated with the successful pursuit of self-employment and may help them return quickly to
productive employment.
At the beginning of the 1990s, the U.S. Department of Labor funded two programs, the
Self-Page 4
Employment Demonstration program, which provided free assistance to unemployed workers
interested in starting their own business. Benus et al. (1995) find that those two demonstration
programs were effective in assisting participants start their own business and avoid returning to
unemployment. In 1993, Congress passed the NAFTA Act, which authorized states to implement
temporary self-employment assistance (SEA) programs targeting unemployed workers. The
success of the ensuing SEA programs led to their permanent authorization by Congress in 1997
(Vroman, 1997; Kosanovich et al., 2002). As of the early 2000s, however, only 11 states had
adopted SEA programs in their workforce development systems, including New York,
Pennsylvania, and Oregon.
To reestablish the potential benefits of self-employment programs, the U.S. Department of
Labor partnered with the Small Business Administration in 2002 to support Project GATE, a
program offering free self-employment assistance to individuals interested in starting their own
business. Project GATE was specifically designed as an experimental program in order to
estimate its impact and to assess if such programs are a viable policy tool to expedite the
reemployment of unemployed workers through self-employment. Benus and Michaelides (2010)
show, in fact, that Project GATE was quite effective in increasing the likelihood of starting a
new business for participants who were unemployed at the time of application.
As discussed, previous research has shown that self-employment programs are effective in
assisting unemployed workers start their own business and avoid returning to unemployment.
But previous work has not addressed a number of questions relating to race differences in the
effectiveness of such programs and to race disparities in the post-training outcomes of
unemployed participants. Are nonwhite participants, who may face more obstacles in pursuing
Page 5
important race disparities in the self-employment outcomes of unemployed participants? What is
the role of participant characteristics related to self-employment background and access to credit
in explaining such disparities?
This paper uses data from Project GATE to address these questions. In Section 2, we provide
an overview of Project GATE and the baseline characteristics of unemployed applicants, overall
and by three race groups: white, black, and other race. This includes a description of participant
characteristics related to self-employment background, financing, and other personal
circumstances, as well as an overview of the participant post-training outcomes. In Section 3, we
use regression models to estimate GATE’s impact on participant outcomes, overall and by race
group. The same analyses enable us to estimate the effect of self-employment background,
access to financing, and personal circumstances on participant outcomes. In Section 4, we use
these results to produce GATE’s impact on the outcomes of white, black, and other race
unemployed participants. Furthermore, we assess the degree to which race disparities in the
employment outcomes of unemployed participants are attributed to differences in
self-employment background, finances, and personal circumstances. The final section discusses the
policy implications of our findings.
2. Project GATE Overview
In 2002, U.S. Department of Labor partnered with the Small Business Administration (SBA)
to support Project GATE (Growing America Through Entrepreneurship). The objective of
Project GATE, implemented from 2003 through 2005 in Maine, Minnesota, and Pennsylvania,
was to provide free self-employment assistance to individuals interested in starting their own
Page 6
One-Stop Career Centers, which included: two sites in rural Maine; one site in Philadelphia,
Pittsburgh, and Minneapolis/St. Paul; and two sites in rural Minnesota.
Upon application, each individual was randomly assigned to the treatment or to the control
group. Treatment group participants received an initial assessment of their business needs and
were then referred to wide array of services, including individual business counseling sessions.
In those sessions, participants met with business professionals to discuss their business idea,
receive help in producing or refining their business plan, and receive guidance on how to obtain
financing for their business through the SBA MicroLoan program or through other sources. For
more details on the types of services offered by Project GATE, see Benus et al. (2009).
Applicants assigned to the control group were not referred to any Project GATE services.
Since DOL One-Stop locations were the gateways to the program, Project GATE attracted
2,089 applicants who identified themselves as being unemployed at the time of application and
looking to start their own business.1 As Table 1 shows, 64% of unemployed applicants were
white, 26% were black, and 10% were other race (i.e., nonwhites, non-blacks). A comparison of
the proportion of applicants in Project GATE to the proportion of all unemployed workers in the
three states, by race, shows that nonwhites were much more likely than whites to participate in
Project GATE. Specifically, 26% of unemployed applicants were black, as were 12% of all
unemployed workers in Maine, Minnesota, and Pennsylvania. The ratio of these two proportions
(2.17) indicates that black unemployed workers in these states were at least two times more
likely than others to apply for Project GATE. Similarly, unemployed workers in the other race
1
Page 7
category were 2.5 times more likely to apply than their peers. These numbers are consistent with
the idea that, among the unemployed, nonwhites are more likely than whites to view
self-employment as an attractive alternative to salary self-employment. This is also an indication that, due
to the challenges they face in pursuing employment, nonwhites are more likely to seek
self-employment assistance.
2.1. Baseline Characteristics of Unemployed GATE Applicants
Project GATE applicants were required to complete an application form requesting baseline
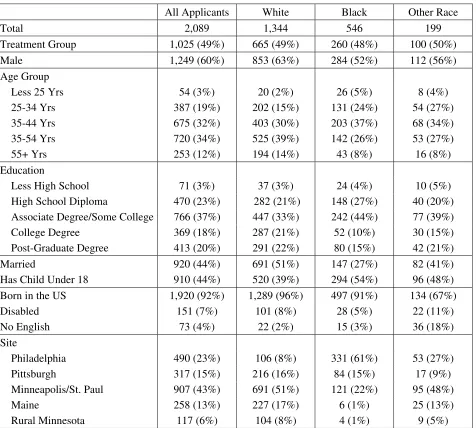
information on their demographic characteristics. Table 2 presents these characteristics, overall
and by race group. As a result of random assignment, about half the unemployed applicants were
in the treatment group, overall and by race. The majority of unemployed applicants were male, as
were individuals ages 35-54. About a quarter of all applicants had a high school diploma or less,
while the remaining applicants had at least some college attendance. Table 2 also reports the
GATE location among unemployed applicants – most applicants were in Minnesota/St.Paul,
followed by Philadelphia and Pittsburgh.
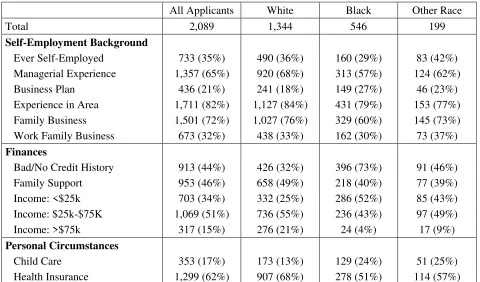
GATE applicants were also asked to provide information on characteristics related to their
self-employment background, finances, and personal circumstances. These are presented in
Table 3. Around 36% of white and 42% of other race applicants had prior self-employment
experience (Ever Self-Employed), compared to 29% for black applicants. Whites were more
likely than black and other race applicants to have prior managerial experience (Managerial
Experience) and work experience in the area they were interested in starting a new business
(Experience in Area). Higher proportions of white and other race applicants relative to blacks
Page 8
business prior to applying to GATE (Work Family Business). In contrast, a higher proportion of
black applicants had a prepared business plan at the time of application.
White applicants were in a better financial position than their peers at the time of application,
indicating that they would be more likely to be able to secure financing for their business. For
example, less than a third of whites reported a low credit history score (Bad/No Credit History)
compared with nearly three quarters for blacks and nearly half for other race applicants. Whites
were also more likely to have a relative supporting their family while they were pursuing
self-employment (Family Support) and much more likely to have annual household income that
exceeded $75,000 (Income: >$75K). Finally, Table 3 indicates that black and other race
applicants were more likely than white applicants to be the major caretaker of a child and less
likely to have health insurance at the time of application.
2.2. Post-Training Outcomes of Unemployed GATE Applicants
Project GATE included three follow-up surveys to document the post-training outcomes of
participants – these were conducted 6 months (Wave 1), 18 months (Wave 2), and 60 months
(Wave 3) after random assignment. As Table 4 shows, high response rates were achieved in all
three follow-up surveys. In particular, 83% of all unemployed applicants responded to the Wave
1 survey, 89% of whom responded to the Wave 2 survey. Finally, 82% of Wave 2 respondents
responded to the Wave 3 survey – in total, 60% of all unemployed applicants responded to all
three follow-up surveys. Based on the responses of applicants in the three follow-up surveys, we
constructed the following post-training outcomes: likelihood of starting a new business by the
time of each survey; likelihood of sustaining a business started by Wave 1 at the time of each
survey; employment likelihood; self-employment earnings; total earnings; and household
Page 9
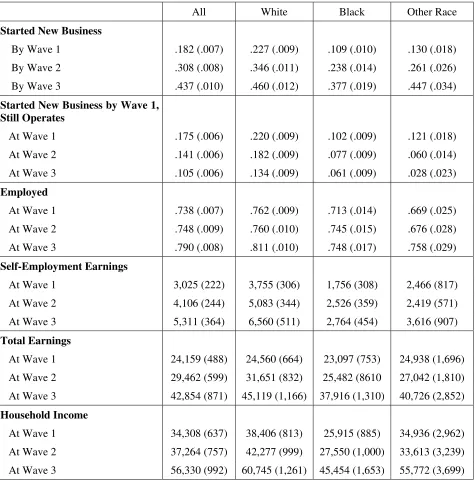
Table 5 shows that, after random assignment, 18.2% of all unemployed participants started a
new business by Wave 1, 30.8% started a new business by Wave 2, and 43.7% started a new
business by Wave 3. Black participants had a lower likelihood of starting a new business after
random assignment than white and other race participants. By Wave 3, for example, 37.7% of
black participants started a new business relative to 46% for white and 44.7% for other race
participants. The second outcome reported is the likelihood of sustaining a business started
between random assignment and Wave 1 by the time of each survey. As Table 5 shows, 17.5%
of unemployed participants started a business by Wave 1 that was still in operation at Wave 1.
Moreover, 14.1% and 10.5% of participants started a new business by Wave 1 that was still
operating at Wave 2 and at Wave 3, respectively. New business sustainability was much higher
among white unemployed participants compared to black and other race participants.
Table 5 also shows that 73.8% of unemployed participants were employed (i.e., in salary
employment or in self-employment) at Wave 1, compared to 74.8% at Wave 2, and 79% at Wave
3. Also reported are the mean self-employment earnings, total earnings (i.e., self-employment
earnings plus earnings from salary jobs), and total household income at the time of each survey.
Note that all three earnings measures were higher at each subsequent survey, overall and by race
group, indicating that unemployed participants were experiencing a steady earnings growth over
time. It is also true that white participants had higher earnings at the time of each follow-up
survey than black and other race participants.
The above overview reveals two important race patterns among unemployed Project GATE
participants. First, black and other race participants were generally less likely than their white
peers to have self-employment background (e.g., prior self-employment experience and work
Page 10
household income). Second, black and other race participants were less likely than their white
peers to start a new business following random assignment or to start a new business and be able
to sustain it. Nonwhite participants also had lower self-employment earnings than white
participants. These patterns correspond closely to those found in previous research examining
race disparities in self-employment participation and success.
3. GATE Impact on Post-Training Outcomes
In this section, we use regression models to estimate GATE’s impact on participant outcomes
and to test if that impact varied by race group. Our regression analyses will also enable us to
estimate the effect of characteristics related to self-employment background, finances, and
personal circumstances on participant post-training outcomes. As discussed, Project GATE was
designed as an experimental program, providing a unique opportunity to produce a consistent
estimate of the program’s intent-to-treat effect on participant outcomes, overall and by race.2 To
do so, we use the following model:
· + · · + · · · · ·
· · · · (1)
The dependent variable in this model ( is the post-training outcome of interest. On the
right hand side, is the treatment indicator, which equals 1 if the participant was in the treatment
group, 0 else. There are also two indicators for race: equals 1 if participant was black, and
equals 1 if participant was other race (the omitted race group is white). The model also
includes interactions between treatment and race, which indicate if the treatment effect varied by
race group. In particular, if the estimated interaction parameters ( , ) are statistically
2
Page 11
different from zero, then GATE had a different impact on black and other race participants than
on white participants.
The model also includes all available demographic characteristics from Table 2 ( ) and
the characteristics related to self-employment background ( , finances ( , and personal
circumstances ( , as reported in Table 3. Including these characteristics in the model adjusts
for any observed differences between the treatment and the control group that may have occurred
by chance. In addition, it enables us to estimate the effect of self-employment background,
finances, and personal circumstances on participant outcomes. Our expectation is that workers
with limited self-employment background (i.e., no self-employment experience, no business
plan, no experience in area of interest, and no experience working in a family business) would be
less successful in pursuing self-employment than others. In addition, those with limited access to
financing (i.e., bad or no credit history, no family support, and low household income) are
expected to be less likely than others to be able to adequately finance the creation or expansion
of their business, leading to lower self-employment outcomes. Finally, participants with
impairing personal circumstances (i.e., child care and no health insurance) may be less able to
fully commit in pursuing self-employment than others, leading to lower self-employment
participation and success.
We estimate two versions of the model for each post-training outcome, a baseline model and
an interactions model. The baseline model has no interactions between treatment and race, that
is, it assumes that GATE’s impact was the same across all three race groups. The interactions
Page 12
treatment effect varied by race. These two models are estimated for each post-training outcome
using weighted least squares3 and results are presented below.
3.1. New Business Starts, New Business Sustainability, and Employment
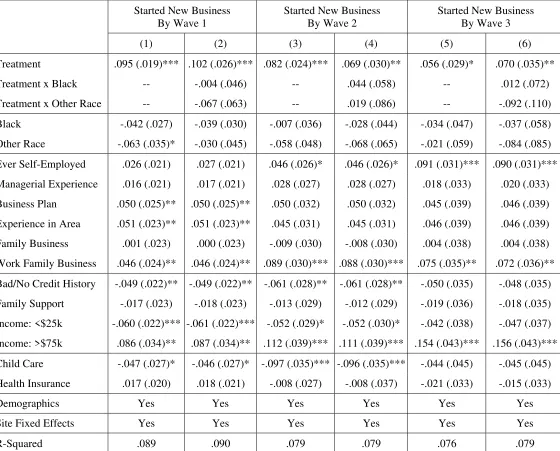
Table 6 presents the regression results for the likelihood of starting a new business by the
time of each survey. The baseline model (specification 1) shows that the treatment effect on the
likelihood of starting a new business by Wave 1 was positive (.095) and significant, indicating
that those in the treatment group were 9.5 percentage points more likely than their peers to start a
new business within 6 months after random assignment. The interactions model (specification 2)
shows that the baseline GATE impact was 10.2 percentage points and statistically significant.
The treatment-race interactions, however, lacked statistical significance, indicating that GATE’s
impact was statistically equal across the three race groups.
We obtain similar results for the likelihood of starting a new business by Wave 2 and by
Wave 3. The baseline models (specification 3 and 5) show that GATE had a significant positive
impact on the likelihood of starting a new business by Wave 2 and by Wave 3 (8.2 and 5.6
percentage points, respectively). Specifications 4 and 6 show no statistical difference between
GATE’s impact on white participants and GATE’s impact on black or other race participants.
We should note, however, the large negative interaction effect for other race participants at Wave
1 (-.067) and at Wave 3 (-.092). Although not statistically significant, these indicate that GATE
may have been less effective for other race participants.4
3
Project GATE data report weights designed to adjust for treatment-control differences in the survey response rates.
4
Page 13
Interestingly, Table 6 shows that with one exception, the black and other race indicators were
statistically zero, indicating that black and other race participants were equally likely to start a
new business by the time of each survey as white participants. As expected, results show that
participants with some self-employment background were more likely than their peers to start a
new business. For example, those with self-employment experience at the time of application
were 4.6 and 9.1 percentage points more likely to start a new business by Waves 2 and 3,
respectively. Moreover, participants with a business plan, those with experience in their area of
interest, and those with experience working in a business owned by their family were generally
more likely to start a new business following random assignment.
Personal finances are also important. Participants with bad or no credit history were
significantly less likely than others to be able to start their own business by Wave 1 and by Wave
2. A low credit history score is an indication that the individual would not have easy access to
credit, making it harder to finance a new business. This effect is statistically zero by Wave 3,
presumably because individuals may have had enough time by then to improve their credit
history. In addition, participants with higher income were more likely than others to start their
own business by each survey. This, again, shows that access to financing is an important
consideration in starting a new business – individuals with high household income are likely to
have more opportunities to secure financing for their business, either through loans or through
their own assets and savings.
Finally, participants who were the primary caretakers for their child were significantly less
likely to start a new business by Wave 1 and by Wave 2. This is not surprising, since it would be
much more difficult for such individuals to be able to put forth the time commitment required to
Page 14
disappears by Wave 3 – presumably, when the child is old enough to attend school and the time
required for its care is reduced.
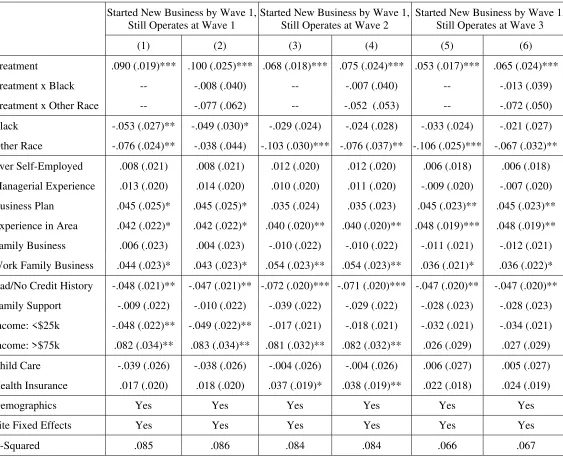
Table 7 reports the results when the dependent variable is the likelihood of starting a new
business by Wave 1 that still operates at the time of each survey. Specification 1 shows that those
in the treatment group were 9 percentage points more likely than their peers to start a new
business between random assignment and Wave 1 that was still operating at Wave 1. In the
interactions model, the baseline treatment effect was 10 percentage points and significant, but the
interaction effects were insignificant. Similar results are obtained for new business sustainability
at Waves 2 and 3. So, GATE not only led to a higher likelihood of starting a new business, it also
led to a higher likelihood of sustaining that business, even 5 years after random assignment.
These impacts do not appear to be statistically different by race group – however, the other race
interaction effects are again large and negative, indicating that impacts were lower for this group.
The same results show that black unemployed participants were less likely than their white
peers to start a new business at Wave 1 that was still in operation at Wave 2. However, blacks
were equally likely as whites to start a business within 6 months of random assignment that was
sustained 18 months and 60 months after random assignment. In contrast, new business
sustainability was much lower among other race participants relative to white and black
participants even 60 months after random assignment. Our results also illustrate the importance
of self-employment background in sustaining a new business. Participants with a business plan
or experience working in their area of interest were significantly more likely than others to start a
new business and sustain it even 60 months after random assignment. In addition, participants
with experience working in a business owned by their family had higher new business
Page 15
business sustainability – participants with a low credit history score and those with low
household income were less likely to sustain their new business at each survey.
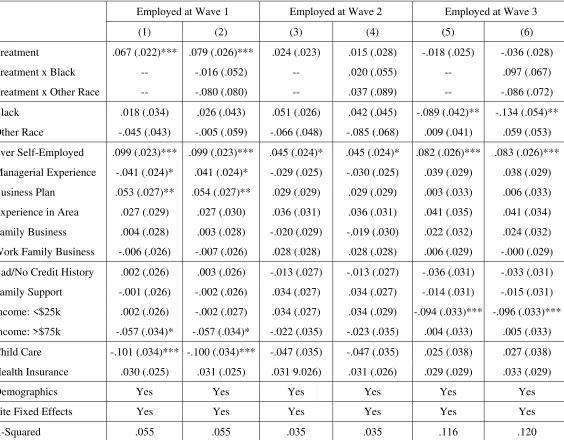
Table 8 presents the results where the dependent variable is the likelihood of employment.
As shown, GATE only had a significant impact on employment at Wave 1. In particular,
according to the baseline model (specification 1), GATE led to an increase in the likelihood of
employment by 6.7 percentage points at Wave 1. The interactions model (specification 2)
indicates that this impact was not statistically different, by race. The remaining specifications
indicate that there was no significant impact of GATE on employment at Wave 2 or at Wave 3.
3.2. Self-Employment Earnings
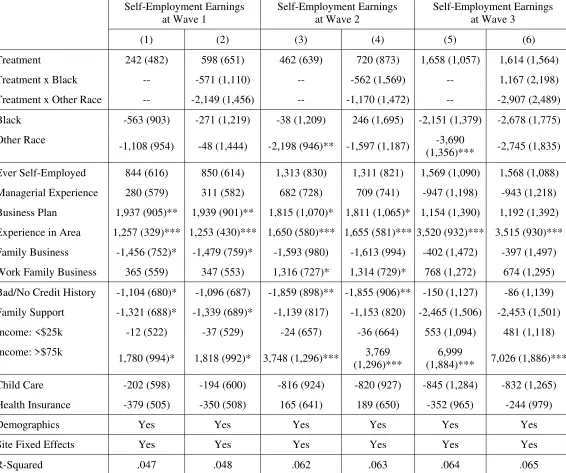
We use a similar analysis to estimate GATE’s impact on self-employment earnings at the
time of each survey. Table 9 presents the results for self-employment earnings.5 These results
suggest that GATE had no impact on the self-employment earnings of participants at the time of
each survey. A closer look, however, reveals that the treatment effect in the baseline models
(specifications 1, 3, and 5) are higher at each subsequent survey. This provides an indication that,
over time, GATE may lead to higher self-employment earnings for unemployed participants. In
addition, as specification 6 shows, the total treatment effect for black participants (i.e., baseline
plus interaction effect) is quite large. This is an indication that GATE may have had a significant
impact on self-employment earnings of black participants 60 months after random assignment –
we explore this further below.
As shown in Table 9, participants with a business plan and experience in their area of interest
were likely to earn higher self-employment earnings than their peers. In addition, participants
5
Page 16
with bad or no credit history and those with lower household income (i.e., $75,000 or less) were
likely to have lower self-employment earnings than their peers following random assignment.
The remaining characteristics do not appear to have a significant effect on self-employment
earnings.
4. Interpretation of the Results
The regression analyses reported above show that Project GATE had a significant impact on
a number of post-training outcomes of unemployed participants. Although we cannot reject the
hypothesis that GATE’s impact on post-training outcomes was different across race groups, there
is evidence suggesting that the total treatment effects may have been higher for white and black
participants than for other race participants. Our analyses also show that participant
characteristics, particularly those related to self-employment background and finances, had a
significant effect on participant outcomes even five years after random assignment.
Below, we quantify GATE’s impact on each race group for the following outcomes:
likelihood of starting a new business, new business sustainability, employment likelihood, and
self-employment earnings. In particular, we calculate the treatment effect for each race group
and compare it against the respective control group mean for each post-training outcome – this
analysis produces GATE’s impact on each outcome as a proportion of the control group mean,
by race. In addition, we use a decomposition analysis to assess the degree to which race
differences in self-employment background, finances, and personal circumstances explain the
important race disparities in self-employment outcomes.
Page 17
Using the regression results from the interactions models reported in Tables 6-9, we quantify
GATE’s impact on the post-training outcomes of unemployed participants, by race. From
Equation 1, we know that the effect for white participants is equal to the baseline treatment
parameter . The effect for black participants is the sum of the baseline treatment effect and the
interaction treatment effect for black participants (i.e., ). Similarly, the treatment effect
for other race participants is + . Table 10 presents the control group mean and the treatment
effect for each race group for the following outcomes: likelihood of starting a new business;
likelihood of starting a new business by Wave 1 that still operates; likelihood of employment;
and self-employment earnings. The same table reports GATE’s impact on each post-training
outcome, expressed as a proportion of the control group mean, by race.
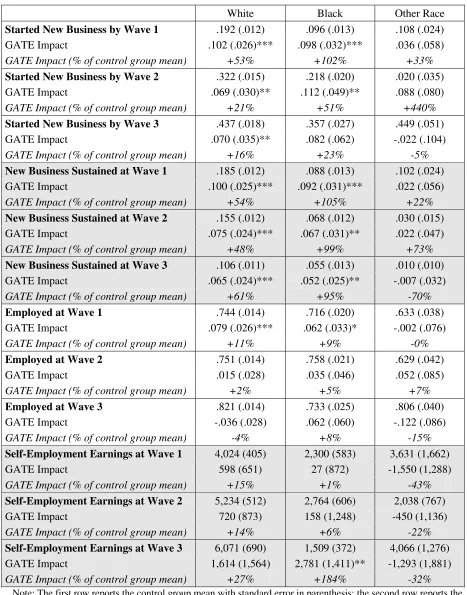
As Table 10 reports, 19.2% of white control group participants started a new business by
Wave 1, while the program’s impact on the likelihood of starting a new business by Wave 1 for
white participants is .102 and is statistically significant. Comparing this impact to the control
group mean shows that GATE increased the likelihood of starting a new business by Wave 1 by
53% for white participants. The impact for black participants is also statistically positive,
indicating that GATE doubled the likelihood of starting a new business by Wave 1 for black
participants. The GATE impact for other race participants was much lower and was statistically
insignificant. GATE also led to a higher likelihood of starting a new business by Wave 2 and by
Wave 3 for white and black participants, but the impacts for other race participants were
statistically insignificant.
Perhaps more importantly, GATE had a substantial impact on new business sustainability for
white and black participants, even five years after random assignment. In particular, new
Page 18
76%, respectively, as a result of being in the GATE treatment group. Again, there was no
significant impact on other race participants. These results indicate that, at least for white and
black participants, GATE not only led to higher likelihood of starting a new business but also to
a higher likelihood of sustaining that business. GATE also led to significant short-term increases
in the employment likelihood for white and black participants. In particular, GATE increased the
likelihood of employment at Wave 1 by 11% for white participants and by 9% for black
participants. There was no significant impact on this outcome at Waves 2 and 3.
Finally, as shown in Table 10, GATE had no significant effect on self-employment earnings
at Wave 1 and at Wave 2. Note, however, that the program’s impact was higher at Wave 2 than it
was at Wave 1 for participants in all three race groups. This trend was sustained at Wave 3 when
GATE’s impact was much higher than its impact at Wave 2 for whites and blacks. In fact, GATE
led to a statistically significant increase of 184% in the self-employment earnings of black
participants at Wave 3. Similar analyses for total earnings and household income (not shown)
reveal no significant impact of GATE on those outcomes, overall or by race. Notably, the
estimated treatment effect on total earnings and household income by race, although statistically
insignificant, increased with each survey. These analyses are available upon request.
4.2. Decomposition of Race Differences in Self-Employment Outcomes
An overview of the characteristics of unemployed GATE applicants (Table 3) shows there
were important race differences in self-employment experience, finances, and personal
circumstances. For example, black applicants had lower self-employment and management
experience than their peers, while they were less likely to work in a family business. In addition,
higher proportions of black and other race applicants had a poor credit history, no financial
Page 19
our regression analyses in the previous section, we also concluded that participants with limited
self-employment background, lower access to financing, and impairing personal circumstances
had significantly lower self-employment participation and success following random assignment.
It is, therefore, true that a portion of the observed race disparities in post-training
self-employment outcomes (see Table 5) may be attributed to race differences in the aforementioned
characteristics.
Using the regression analyses from the previous section, we decompose the race gap in each
self-employment outcome and determine the proportion of that gap that is attributed to race
differences in self-employment background, finances, and personal circumstances. For example,
consider the means difference in outcomes between white and black participants. Once we
estimate Equation 1, we can write the portion of the gap that is due to differences in
self-employment background between whites and blacks as , , · , where , , is
the white-black means difference in self-employment background characteristics and the
estimated coefficients of those characteristics. Similarly, the portion of the white-black gap that
is due to differences in finances is , , · and the portion that is due to differences in
personal circumstances is , , · .
Table 11 presents this exercise for the white-black gaps in self-employment outcomes. The
likelihood of starting a new business for white participants, for example, exceeded that for black
participants by 11.8 percentage points. As Table 11 shows, 3% of that difference is due to
white-black differences in self-employment background, 42% is due to differences in finances, and 7%
is due to personal circumstances. In other words, due to a better credit history and higher
household income, white participants were 42% more likely than black participants to start a new
Page 20
suggesting that, since white participants had more access to financing at the time of application,
they were more likely than black participants to be able to start their own business following
random assignment.
Differences in characteristics related to personal finances are also the most important
underlying factor of the white-black gap in new business sustainability and self-employment
earnings. Between 38%-42% of the white-black gap in new business sustainability at the time of
the three follow-up surveys are explained by differences in finances between the two groups. In
addition, black participants experienced 22%-41% lower self-employment earnings than white
participants at the time of the surveys as a result of their lower access to financing at the time of
application.
Table 12 presents the same analysis for the white-other race differences in self-employment
outcomes. Differences in self-employment background do little to explain the white-other race
gap in self-employment outcomes, although as a result of a better self-employment background,
other race participants were 44% more likely than white participants to start a new business by
Wave 3. Differences in finances appear again to be the most important underlying factor for the
white-other race disparities in the likelihood of starting a new business, new business
sustainability, and self-employment earnings.
5. Conclusion
Although previous work shows that self-employment programs are effective in assisting
unemployed workers start their own business and avoid unemployment, there is no work
examining race differences in the impact of such programs. In addition, previous research does
not consider the extent to which participant characteristics related to self-employment
Page 21
This paper addresses these issues using data from Project GATE, a self-employment training
program implemented from 2003 through 2005 in Maine, Minnesota, and Pennsylvania.
We show that among unemployed workers in these three states, nonwhites were much more
likely than whites to apply for GATE participation. In addition, among unemployed GATE
participants, black and other race participants had limited self-employment background, lower
access to credit, and other impairing personal circumstances relative to their white peers. Thus, it
is not surprising that after random assignment, nonwhite participants were less likely to start and
sustain a new business, less likely to be employed, and had lower earnings than their white peers.
Our impact analyses show that GATE had a substantial positive effect on participant
outcomes even five years after random assignment. Moreover, we find GATE was equally
effective for black and white participants, despite the fact that at the time of application, black
participants faced more challenges in pursuing self-employment than whites. In fact, black
participants experienced the highest gains – five years after random assignment, GATE had
increased their likelihood of starting a new business by almost a quarter, doubled their likelihood
of sustaining their new business, and led to almost three times higher self-employment earnings.
Our results are less conclusive for other race participants, for whom the program’s impact
appears to be very small.
We also find that participant characteristics related to self-employment background, access to
financing, and personal circumstances, significantly affected their self-employment outcomes.
Based on these results, we assess the degree to which these characteristics may explain the
important race disparities in self-employment outcomes of unemployed GATE participants. We
find that due to lower access to financing at the time of application, black and other race
Page 22
earned lower self-employment earnings. In contrast, race differences in self-employment
background and personal circumstances only accounted for a small fraction of race gaps in these
outcomes.
The results of this paper shed more light on whether self-employment programs can emerge
as a new strategy for improving the self-employment outcomes of the unemployed, particularly
for race minorities. Our results suggest that such programs are likely to attract a
disproportionately higher number of nonwhite unemployed workers, presumably because
nonwhites face more challenges in pursing self-employment than whites and are therefore more
likely to seek self-employment assistance. Even though many unemployed participants may have
no self-employment background and limited access to financing, self-employment programs can
still be very effective in improving participant outcomes, at least for white and black participants.
These results, combined with the higher application rates among blacks, suggests that availability
of government programs offering free self-employment assistance may contribute to closing the
white-black gap in self-employment participation and success.
Overall, we conclude that offering self-employment assistance to unemployed workers
interested in self-employment is an effective policy tool in promoting the rapid reemployment of
these workers through the creation of small business. Besides their short-term positive effects,
these programs may also have positive long-run effects through the creation of new jobs and
through the potential reduction in the important race disparities in self-employment outcomes.
We also recommend that future programs consider strategies to address the important credit
constraints faced by unemployed participants. If future programs focus more intensely on
assisting participants secure financing for their business, their impact could be significantly
Page 24
Table 1: GATE Application among the Unemployed
Total White Black Other Race
Unemployed GATE Applicants 2,089 1,344 546 199
Proportion of Applicants -- 0.64 0.26 0.10
Proportion of Population -- 0.84 0.12 0.04
Ratio -- 0.76 2.17 2.50
Note: Reported are the number of unemployed applicants (Unemployed GATE Applicants); proportion of all applicants, by race; and proportion of all unemployed workers, by race.
Table 2: Characteristics of Unemployed GATE Applicants
All Applicants White Black Other Race
Total 2,089 1,344 546 199
Treatment Group 1,025 (49%) 665 (49%) 260 (48%) 100 (50%)
Male 1,249 (60%) 853 (63%) 284 (52%) 112 (56%)
Age Group
Less 25 Yrs 54 (3%) 20 (2%) 26 (5%) 8 (4%)
25-34 Yrs 387 (19%) 202 (15%) 131 (24%) 54 (27%)
35-44 Yrs 675 (32%) 403 (30%) 203 (37%) 68 (34%)
35-54 Yrs 720 (34%) 525 (39%) 142 (26%) 53 (27%)
55+ Yrs 253 (12%) 194 (14%) 43 (8%) 16 (8%)
Education
Less High School 71 (3%) 37 (3%) 24 (4%) 10 (5%)
High School Diploma 470 (23%) 282 (21%) 148 (27%) 40 (20%)
Associate Degree/Some College 766 (37%) 447 (33%) 242 (44%) 77 (39%)
College Degree 369 (18%) 287 (21%) 52 (10%) 30 (15%)
Post-Graduate Degree 413 (20%) 291 (22%) 80 (15%) 42 (21%)
Married 920 (44%) 691 (51%) 147 (27%) 82 (41%)
Has Child Under 18 910 (44%) 520 (39%) 294 (54%) 96 (48%)
Born in the US 1,920 (92%) 1,289 (96%) 497 (91%) 134 (67%)
Disabled 151 (7%) 101 (8%) 28 (5%) 22 (11%)
No English 73 (4%) 22 (2%) 15 (3%) 36 (18%)
Site
Philadelphia 490 (23%) 106 (8%) 331 (61%) 53 (27%)
Pittsburgh 317 (15%) 216 (16%) 84 (15%) 17 (9%)
Minneapolis/St. Paul 907 (43%) 691 (51%) 121 (22%) 95 (48%)
Maine 258 (13%) 227 (17%) 6 (1%) 25 (13%)
Rural Minnesota 117 (6%) 104 (8%) 4 (1%) 9 (5%)
[image:26.612.72.548.224.652.2]Page 25
Table 3: Self-Employment Background and Personal Finances, Unemployed GATE Applicants
All Applicants White Black Other Race
Total 2,089 1,344 546 199
Self-Employment Background
Ever Self-Employed 733 (35%) 490 (36%) 160 (29%) 83 (42%)
Managerial Experience 1,357 (65%) 920 (68%) 313 (57%) 124 (62%)
Business Plan 436 (21%) 241 (18%) 149 (27%) 46 (23%)
Experience in Area 1,711 (82%) 1,127 (84%) 431 (79%) 153 (77%)
Family Business 1,501 (72%) 1,027 (76%) 329 (60%) 145 (73%)
Work Family Business 673 (32%) 438 (33%) 162 (30%) 73 (37%)
Finances
Bad/No Credit History 913 (44%) 426 (32%) 396 (73%) 91 (46%)
Family Support 953 (46%) 658 (49%) 218 (40%) 77 (39%)
Income: <$25k 703 (34%) 332 (25%) 286 (52%) 85 (43%)
Income: $25k-$75K 1,069 (51%) 736 (55%) 236 (43%) 97 (49%)
Income: >$75k 317 (15%) 276 (21%) 24 (4%) 17 (9%)
Personal Circumstances
Child Care 353 (17%) 173 (13%) 129 (24%) 51 (25%)
Health Insurance 1,299 (62%) 907 (68%) 278 (51%) 114 (57%)
Note: Reported are the number of unemployed applicants (with sample proportions in parenthesis), overall and by race.
Table 4: Response Rates to Follow-up Surveys, Unemployed GATE Applicants
All Applicants White Black Other Race
All Applicants 2,089 1,344 546 199
Wave 1 Respondents [% of all applicants]
1,737 [83%] 1,150 [86%] 427 [78%] 160 [80%] Wave 2 Respondents
(% of Wave 1 respondents) [% of all applicants]
1,539 (89%) [74%] 1,053 (92%) [78%] 351 (82%) [64%] 135 (84%) [68%] Wave 3 Respondents
(% of Wave 2 respondents) [% of all applicants]
1,261 (82%) [60%] 894 (85%) [67%] 261 (74%) [48%] 106 (79%) [53%]
[image:27.612.71.541.430.577.2]Page 26
Table 5: Post-Training Outcomes, Unemployed GATE Participants
All White Black Other Race
Started New Business
By Wave 1 .182 (.007) .227 (.009) .109 (.010) .130 (.018)
By Wave 2 .308 (.008) .346 (.011) .238 (.014) .261 (.026)
By Wave 3 .437 (.010) .460 (.012) .377 (.019) .447 (.034)
Started New Business by Wave 1, Still Operates
At Wave 1 .175 (.006) .220 (.009) .102 (.009) .121 (.018)
At Wave 2 .141 (.006) .182 (.009) .077 (.009) .060 (.014)
At Wave 3 .105 (.006) .134 (.009) .061 (.009) .028 (.023)
Employed
At Wave 1 .738 (.007) .762 (.009) .713 (.014) .669 (.025)
At Wave 2 .748 (.009) .760 (.010) .745 (.015) .676 (.028)
At Wave 3 .790 (.008) .811 (.010) .748 (.017) .758 (.029)
Self-Employment Earnings
At Wave 1 3,025 (222) 3,755 (306) 1,756 (308) 2,466 (817)
At Wave 2 4,106 (244) 5,083 (344) 2,526 (359) 2,419 (571)
At Wave 3 5,311 (364) 6,560 (511) 2,764 (454) 3,616 (907)
Total Earnings
At Wave 1 24,159 (488) 24,560 (664) 23,097 (753) 24,938 (1,696)
At Wave 2 29,462 (599) 31,651 (832) 25,482 (8610 27,042 (1,810)
At Wave 3 42,854 (871) 45,119 (1,166) 37,916 (1,310) 40,726 (2,852)
Household Income
At Wave 1 34,308 (637) 38,406 (813) 25,915 (885) 34,936 (2,962)
At Wave 2 37,264 (757) 42,277 (999) 27,550 (1,000) 33,613 (3,239)
At Wave 3 56,330 (992) 60,745 (1,261) 45,454 (1,653) 55,772 (3,699)
Page 27
Table 6: Regression Results – Likelihood of Starting a New Business
Started New Business
By Wave 1
Started New Business By Wave 2
Started New Business By Wave 3
(1) (2) (3) (4) (5) (6)
Treatment .095 (.019)*** .102 (.026)*** .082 (.024)*** .069 (.030)** .056 (.029)* .070 (.035)**
Treatment x Black -- -.004 (.046) -- .044 (.058) -- .012 (.072)
Treatment x Other Race -- -.067 (.063) -- .019 (.086) -- -.092 (.110)
Black -.042 (.027) -.039 (.030) -.007 (.036) -.028 (.044) -.034 (.047) -.037 (.058)
Other Race -.063 (.035)* -.030 (.045) -.058 (.048) -.068 (.065) -.021 (.059) -.084 (.085)
Ever Self-Employed .026 (.021) .027 (.021) .046 (.026)* .046 (.026)* .091 (.031)*** .090 (.031)***
Managerial Experience .016 (.021) .017 (.021) .028 (.027) .028 (.027) .018 (.033) .020 (.033)
Business Plan .050 (.025)** .050 (.025)** .050 (.032) .050 (.032) .045 (.039) .046 (.039)
Experience in Area .051 (.023)** .051 (.023)** .045 (.031) .045 (.031) .046 (.039) .046 (.039)
Family Business .001 (.023) .000 (.023) -.009 (.030) -.008 (.030) .004 (.038) .004 (.038)
Work Family Business .046 (.024)** .046 (.024)** .089 (.030)*** .088 (.030)*** .075 (.035)** .072 (.036)**
Bad/No Credit History -.049 (.022)** -.049 (.022)** -.061 (.028)** -.061 (.028)** -.050 (.035) -.048 (.035)
Family Support -.017 (.023) -.018 (.023) -.013 (.029) -.012 (.029) -.019 (.036) -.018 (.035)
Income: <$25k -.060 (.022)*** -.061 (.022)*** -.052 (.029)* -.052 (.030)* -.042 (.038) -.047 (.037)
Income: >$75k .086 (.034)** .087 (.034)** .112 (.039)*** .111 (.039)*** .154 (.043)*** .156 (.043)***
Child Care -.047 (.027)* -.046 (.027)* -.097 (.035)*** -.096 (.035)*** -.044 (.045) -.045 (.045)
Health Insurance .017 (.020) .018 (.021) -.008 (.027) -.008 (.037) -.021 (.033) -.015 (.033)
Demographics Yes Yes Yes Yes Yes Yes
Site Fixed Effects Yes Yes Yes Yes Yes Yes
R-Squared .089 .090 .079 .079 .076 .079
Page 28
Table 7: Regression Results – Likelihood of Starting a New Business at Wave 1 that Still Operates
Started New Business by Wave 1, Still Operates at Wave 1
Started New Business by Wave 1, Still Operates at Wave 2
Started New Business by Wave 1, Still Operates at Wave 3
(1) (2) (3) (4) (5) (6)
Treatment .090 (.019)*** .100 (.025)*** .068 (.018)*** .075 (.024)*** .053 (.017)*** .065 (.024)***
Treatment x Black -- -.008 (.040) -- -.007 (.040) -- -.013 (.039)
Treatment x Other Race -- -.077 (.062) -- -.052 (.053) -- -.072 (.050)
Black -.053 (.027)** -.049 (.030)* -.029 (.024) -.024 (.028) -.033 (.024) -.021 (.027)
Other Race -.076 (.024)** -.038 (.044) -.103 (.030)*** -.076 (.037)** -.106 (.025)*** -.067 (.032)**
Ever Self-Employed .008 (.021) .008 (.021) .012 (.020) .012 (.020) .006 (.018) .006 (.018)
Managerial Experience .013 (.020) .014 (.020) .010 (.020) .011 (.020) -.009 (.020) -.007 (.020)
Business Plan .045 (.025)* .045 (.025)* .035 (.024) .035 (.023) .045 (.023)** .045 (.023)**
Experience in Area .042 (.022)* .042 (.022)* .040 (.020)** .040 (.020)** .048 (.019)*** .048 (.019)**
Family Business .006 (.023) .004 (.023) -.010 (.022) -.010 (.022) -.011 (.021) -.012 (.021)
Work Family Business .044 (.023)* .043 (.023)* .054 (.023)** .054 (.023)** .036 (.021)* .036 (.022)*
Bad/No Credit History -.048 (.021)** -.047 (.021)** -.072 (.020)*** -.071 (.020)*** -.047 (.020)** -.047 (.020)**
Family Support -.009 (.022) -.010 (.022) -.039 (.022) -.029 (.022) -.028 (.023) -.028 (.023)
Income: <$25k -.048 (.022)** -.049 (.022)** -.017 (.021) -.018 (.021) -.032 (.021) -.034 (.021)
Income: >$75k .082 (.034)** .083 (.034)** .081 (.032)** .082 (.032)** .026 (.029) .027 (.029)
Child Care -.039 (.026) -.038 (.026) -.004 (.026) -.004 (.026) .006 (.027) .005 (.027)
Health Insurance .017 (.020) .018 (.020) .037 (.019)* .038 (.019)** .022 (.018) .024 (.019)
Demographics Yes Yes Yes Yes Yes Yes
Site Fixed Effects Yes Yes Yes Yes Yes Yes
R-Squared .085 .086 .084 .084 .066 .067
Page 29
Table 8: Regression Results – Likelihood of Employment
Employed at Wave 1 Employed at Wave 2 Employed at Wave 3
(1) (2) (3) (4) (5) (6)
Treatment .067 (.022)*** .079 (.026)*** .024 (.023) .015 (.028) -.018 (.025) -.036 (.028)
Treatment x Black -- -.016 (.052) -- .020 (.055) -- .097 (.067)
Treatment x Other Race -- -.080 (.080) -- .037 (.089) -- -.086 (.072)
Black .018 (.034) .026 (.043) .051 (.026) .042 (.045) -.089 (.042)** -.134 (.054)**
Other Race -.045 (.043) -.005 (.059) -.066 (.048) -.085 (.068) .009 (.041) .059 (.053)
Ever Self-Employed .099 (.023)*** .099 (.023)*** .045 (.024)* .045 (.024)* .082 (.026)*** .083 (.026)***
Managerial Experience -.041 (.024)* .041 (.024)* -.029 (.025) -.030 (.025) .039 (.029) .038 (.029)
Business Plan .053 (.027)** .054 (.027)** .029 (.029) .029 (.029) .003 (.033) .006 (.033)
Experience in Area .027 (.029) .027 (.030) .036 (.031) .036 (.031) .041 (.035) .041 (.034)
Family Business .004 (.028) .003 (.028) -.020 (.029) -.019 (.030) .022 (.032) .024 (.032)
Work Family Business -.006 (.026) -.007 (.026) .028 (.028) .028 (.028) .006 (.029) -.000 (.029)
Bad/No Credit History .002 (.026) .003 (.026) -.013 (.027) -.013 (.027) -.036 (.031) -.033 (.031)
Family Support -.001 (.026) -.002 (.026) .034 (.027) .034 (.027) -.014 (.031) -.015 (.031)
Income: <$25k .002 (.026) -.002 (.027) .034 (.027) .034 (.029) -.094 (.033)*** -.096 (.033)***
Income: >$75k -.057 (.034)* -.057 (.034)* -.022 (.035) -.023 (.035) .004 (.033) .005 (.033)
Child Care -.101 (.034)*** -.100 (.034)*** -.047 (.035) -.047 (.035) .025 (.038) .027 (.038)
Health Insurance .030 (.025) .031 (.025) .031 9.026) .031 (.026) .029 (.029) .033 (.029)
Demographics Yes Yes Yes Yes Yes Yes
Site Fixed Effects Yes Yes Yes Yes Yes Yes
R-Squared .055 .055 .035 .035 .116 .120
Page 30
Table 9: Regression Results – Self-Employment Earnings
Self-Employment Earnings
at Wave 1
Self-Employment Earnings at Wave 2
Self-Employment Earnings at Wave 3
(1) (2) (3) (4) (5) (6)
Treatment 242 (482) 598 (651) 462 (639) 720 (873) 1,658 (1,057) 1,614 (1,564)
Treatment x Black -- -571 (1,110) -- -562 (1,569) -- 1,167 (2,198)
Treatment x Other Race -- -2,149 (1,456) -- -1,170 (1,472) -- -2,907 (2,489)
Black -563 (903) -271 (1,219) -38 (1,209) 246 (1,695) -2,151 (1,379) -2,678 (1,775)
Other Race
-1,108 (954) -48 (1,444) -2,198 (946)** -1,597 (1,187) -3,690
(1,356)*** -2,745 (1,835)
Ever Self-Employed 844 (616) 850 (614) 1,313 (830) 1,311 (821) 1,569 (1,090) 1,568 (1,088)
Managerial Experience 280 (579) 311 (582) 682 (728) 709 (741) -947 (1,198) -943 (1,218)
Business Plan 1,937 (905)** 1,939 (901)** 1,815 (1,070)* 1,811 (1,065)* 1,154 (1,390) 1,192 (1,392)
Experience in Area 1,257 (329)*** 1,253 (430)*** 1,650 (580)*** 1,655 (581)*** 3,520 (932)*** 3,515 (930)***
Family Business -1,456 (752)* -1,479 (759)* -1,593 (980) -1,613 (994) -402 (1,472) -397 (1,497)
Work Family Business 365 (559) 347 (553) 1,316 (727)* 1,314 (729)* 768 (1,272) 674 (1,295)
Bad/No Credit History -1,104 (680)* -1,096 (687) -1,859 (898)** -1,855 (906)** -150 (1,127) -86 (1,139)
Family Support -1,321 (688)* -1,339 (689)* -1,139 (817) -1,153 (820) -2,465 (1,506) -2,453 (1,501)
Income: <$25k -12 (522) -37 (529) -24 (657) -36 (664) 553 (1,094) 481 (1,118)
Income: >$75k
1,780 (994)* 1,818 (992)* 3,748 (1,296)*** 3,769
(1,296)***
6,999
(1,884)*** 7,026 (1,886)***
Child Care -202 (598) -194 (600) -816 (924) -820 (927) -845 (1,284) -832 (1,265)
Health Insurance -379 (505) -350 (508) 165 (641) 189 (650) -352 (965) -244 (979)
Demographics Yes Yes Yes Yes Yes Yes
Site Fixed Effects Yes Yes Yes Yes Yes Yes
R-Squared .047 .048 .062 .063 .064 .065
Page 31
Table 10: GATE Impact on Post-Training Outcomes
White Black Other Race
Started New Business by Wave 1 .192 (.012) .096 (.013) .108 (.024)
GATE Impact .102 (.026)*** .098 (.032)*** .036 (.058)
GATE Impact (% of control group mean) +53% +102% +33%
Started New Business by Wave 2 .322 (.015) .218 (.020) .020 (.035)
GATE Impact .069 (.030)** .112 (.049)** .088 (.080)
GATE Impact (% of control group mean) +21% +51% +440%
Started New Business by Wave 3 .437 (.018) .357 (.027) .449 (.051)
GATE Impact .070 (.035)** .082 (.062) -.022 (.104)
GATE Impact (% of control group mean) +16% +23% -5%
New Business Sustained at Wave 1 .185 (.012) .088 (.013) .102 (.024)
GATE Impact .100 (.025)*** .092 (.031)*** .022 (.056)
GATE Impact (% of control group mean) +54% +105% +22%
New Business Sustained at Wave 2 .155 (.012) .068 (.012) .030 (.015)
GATE Impact .075 (.024)*** .067 (.031)** .022 (.047)
GATE Impact (% of control group mean) +48% +99% +73%
New Business Sustained at Wave 3 .106 (.011) .055 (.013) .010 (.010)
GATE Impact .065 (.024)*** .052 (.025)** -.007 (.032)
GATE Impact (% of control group mean) +61% +95% -70%
Employed at Wave 1 .744 (.014) .716 (.020) .633 (.038)
GATE Impact .079 (.026)*** .062 (.033)* -.002 (.076)
GATE Impact (% of control group mean) +11% +9% -0%
Employed at Wave 2 .751 (.014) .758 (.021) .629 (.042)
GATE Impact .015 (.028) .035 (.046) .052 (.085)
GATE Impact (% of control group mean) +2% +5% +7%
Employed at Wave 3 .821 (.014) .733 (.025) .806 (.040)
GATE Impact -.036 (.028) .062 (.060) -.122 (.086)
GATE Impact (% of control group mean) -4% +8% -15%
Self-Employment Earnings at Wave 1 4,024 (405) 2,300 (583) 3,631 (1,662)
GATE Impact 598 (651) 27 (872) -1,550 (1,288)
GATE Impact (% of control group mean) +15% +1% -43%
Self-Employment Earnings at Wave 2 5,234 (512) 2,764 (606) 2,038 (767)
GATE Impact 720 (873) 158 (1,248) -450 (1,136)
GATE Impact (% of control group mean) +14% +6% -22%
Self-Employment Earnings at Wave 3 6,071 (690) 1,509 (372) 4,066 (1,276)
GATE Impact 1,614 (1,564) 2,781 (1,411)** -1,293 (1,881)
GATE Impact (% of control group mean) +27% +184% -32%
Page 32
Table 11: Decomposition of White-Black Differences in Self-Employment Outcomes
Actual Difference
Self-Employment
Background Finances
Personal Circumstances Started a New Business
By Wave 1 .118 .003 (3%) .049 (42%) .008 (7%)
By Wave 2 .108 .005 (5%) .056 (52%) .009 (8%)
By Wave 3 .083 .009 (11%) .055 (67%) .001 (2%)
Started a New Business by Wave 1, Still Operates
At Wave 1 .118 .002 (2%) .045 (38%) .007 (6%)
At Wave 2 .105 .001 (1%) .044 (42%) .007 (6%)
At Wave 3 .073 -.003 (4%) .030 (41%) .003 (11%)
Self-Employment Earnings
At Wave 1 $1,999 -253 (13%) 622 (31%) -41 (2%)
At Wave 2 $2,557 -138 (5%) 1,068 (41%) 115 (5%)
At Wave 3 $3,796 29 (1%) 815 (22%) 33 (1%)
Note: The first column reports the means difference in outcomes between white and black participants; the remaining columns report the portion of that difference that is explained by: differences in self-employment background; differences in finances; and in personal circumstances. In parenthesis are reported the proportions of the actual difference.
Table 12: Decomposition of White-Other Race Differences in Self-Employment Outcomes
Actual Difference
Self-Employment
Background Finances
Personal Circumstances Started a New Business
By Wave 1 .097 -.001 (1%) .026 (27%) .008 (8%)
By Wave 2 .085 -.004 (5%) .030 (35%) .012 (14%)
By Wave 3 .013 -.006 (44%) .031 (239%) .003 (27%)
Started a New Business by Wave 1, Still Operates
At Wave 1 .099 -.001 (1%) .024 (24%) .007 (68%)
At Wave 2 .122 -.002 (1%) .020 (16%) .004 (4%)
At Wave 3 .106 -.002 (2%) .013 (12%) .002 (1%)
Self-Employment Earnings
At Wave 1 $1,289 -107 (8%) 235 (18%) -13 (1%)
At Wave 2 $2,664 -117 (4%) 598 (22%) 121 (5%)
At Wave 3 $2,944 -1 (0%) 508 (17%) 72 (2%)
[image:34.612.76.539.401.632.2]Page 33
References
Bates T. (1985). Entrepreneur Human Capital Endowments and Minority Business Viability.
Journal of Human Resources, Vol. 20, No. 5, pp. 540-554.
Bates T. (1997). Race, Self-Employment, and Upward Mobility: An Illusive American Dream.
Woodrow Wilson Center Press, Washington DC; Johns Hopkins University Press, Baltimore,
MD.
Benus, J., Johnson T., Wood M,, Grover N., and Shen T. (1995). Self-Employment Programs: A
New Reemployment Strategy: Final Report on the UI Self-Employment Demonstration.
Unemployment Insurance Occasional Paper no. 95-4. U.S. Department of Labor,
Washington DC, 1995.
Benus J., McConnell S., Bellotti J., Shen T., Fortson K., Kahvecioglu D. (2008). Growing
America Through Entrepreneurship: Findings from the Evaluation of Project GATE. U.S.
Department of Labor Report, May 2008.
Benus J., Michaelides M. (2010). Are Self-Employment Programs Effective? Evidence from
Project GATE. IMPAQ International Working Paper, January 2010.
Blanchflower D.G., Levine P.B., Zimmerman D.J. (2003). Discrimination in the Small Business
Credit Market. Review of Economics and Statistics, Vol. 85, No. 4, pp. 930-943.
Cavaluzzo K., Wolken J. (2002). Small Business Loan Turndowns, Personal Wealth, and
Discrimination. Working Paper.
Fairlie R.W. (1999). The Absence of the African-American Owned Business: An Analysis of the
Dynamics of Self-Employment. Journal of Labor Economics, Vol. 17, No. 1, pp. 80-108.
Fairlie R.W., Meyer B.D. (1996). Ethnic and Racial Self-Employment Differences and Possible
Explanations. Journal of Human Resources, Vol. 31, pp. 757-793.
Fairlie R.W., Meyer B.D. (2000). Trends in Self-Employment among White and Black Men:
1910-1990. Journal of Human Resources, Vol. 35, No. 4, pp. 643-649.
Fairlie R.W., Robb A.M. (2007a). Access to Financial Capital among U.S. Businesses: The Case
of African American Firms. The Annals of the American Academy of Political and Social
Science, Vol. 613, No. 47, pp. 47-72.
Fairlie R.W., Robb A.M. (2007b). Families, Human Capital, and Small Business: Evidence from
the Characteristics of Business Owners Survey. Industrial Relations and Labor Review, Vol.
Page 34
Fairlie R.W., Robb A.M. (2007c). Why Are Black-Owned Businesses Less Successful than
White-Owned Businesses? The Role of Families, Inheritances, and Business Human Capital.
Journal of Labor Economics, Vol. 25, No. 2, pp. 289-323.
Glocker D., Steiner V. (2007). Self-Employment: A Way to End Unemployment? Empirical
Evidence from German Pseudo-Panel Data. IZA Discussion Paper No. 2561.
Hout M., Rosen H.S. (2000). Self-Employment, Family Background, and Race. Journal of
Human Resources, Vol. 35, pp. 670-692.
Kosanovich W.T., Fleck H., Yost B., Armon W., Siliezar S. (2002). Comprehensive Assesment
of Self-Employment Assistance Programs. Employment and Training Administration
Occasional Paper 2002-01. U.S. Department of Labor, Washington DC 2002.
Lofstrom M., Bates T. (2007). African American’s Pursuit of Self-Employment, IZA Discussion
Paper No. 3156.
Meager N. (1992). Does Unemployment Lead to Self-Employment? Small Business Economics,
Vol. 4, pp. 87-103.
Reynolds P.D., Carter N.M., Gartner W.B., Greene P.G. (2004). The Prevalence of Nascent
Entrepreneurs in the United States: Evidence from the Panel Study of Entrepreneurial
Dynamics. Small Business Economics, Vol. 23, pp. 263-284.
Rissman E.R. (2003). Self-Employment as an Alternative to Unemployment. Federal Reserve
Bank of Chicago, Working Paper 2003-34.
Smith D.T. (2004). Developing Self-Employment Among African Americans: An Examination
of Human Capital Resources. Development and Society, Vol. 33, No. 1, pp. 81-92.
Vroman, W. (1997). Self-Employment Assistance: Revised Report. Report to Congress,