http://dx.doi.org/10.4236/jsea.2016.97025
A Decision Support Framework for the
Choice of Languages and Methods for the
Design of Real Time Embedded Systems
Valéry M. Monthe
1,2, Laurent Nana
2, Georges E. Kouamou
3, Claude Tangha
11Department of Computer Science, University of Yaounde 1, Yaounde, Cameroon
2Lab-STICC (UMR CNRS 6285), Department of Computer Science, University of Brest, Brest, France 3Department of Computer Engineering, National Advanced School of Engineering, Yaounde, Cameroon
Received 14 January 2016; accepted 26 July 2016; published 29 July 2016
Copyright © 2016 by authors and Scientific Research Publishing Inc.
This work is licensed under the Creative Commons Attribution International License (CC BY). http://creativecommons.org/licenses/by/4.0/
Abstract
The choice of methods or design languages is a crucial phase in the development of systems and software, also for real time and embedded systems. An open question that remains in the design of these types of systems is to build a method, or to choose one among those existing, capable to cov-er the life cycle of a project, and particularly the development phases. This article contributes to answer the question, by proposing an approach based on a multi-criteria comparative study, of few languages and methods dedicated to the design of real time and embedded systems. The un-derlying objective of this work is to present to designers a wide range of approaches, and elements that can guide their choices. In order to reach this goal, we propose different comparison criteria. Each criterion is divided into sub-criteria, so that the designers can refine their choices according to the qualities they prefer and wish to have in the method or language. We also define a rating scale which is used to assess the retained languages and methods. The scores obtained from this assessment are presented in tables, one table per criterion, followed by a summary table giving the overall scores. Graphics built from these tables are provided and intend to facilitate the judge- ment and thus the choice of the designers.
Keywords
Design Method, Modelling Language, Real-Time System, Embedded System, Comparison Criteria
1. Introduction
ex-ecutable code, passing by an architectural model of the system. This is done most of the time, starting from a context diagram. During design, the information contained in the context diagram and the requirements of the specification must be converted to produce the architecture model. A method is then needed to enable designers to move from a state of needs to a system architecture, through a decomposition of the problem, and the identi-fication and speciidenti-fication of system components. This is also true for Real Time Embedded Systems (RTES). However the RTES have other features and constraints [1] that are not found in conventional software systems. One can cite: interaction with their environment, real-time constraints (execution time, period, etc.), real-time control, concurrent processing, limited resources, etc. Their design therefore requires the use of particular me-thods taking into account these specificities.
Different methods and languages have been developed for the analysis and design of real-time systems [1] [2], each with a particular focus on some aspects of the system. Each designer will therefore have to choose the me-thod or language to use depending on the specificities of the application domain, and the level of detail he deems important for his model. Therefore it is necessary to know the existing approaches, their strengths and weak-nesses, and the major aspects they deal with. This task is not obvious, given the number of approaches and the particularities of each of them. This study is the beginning of the cogitation towards a solution to this difficulty to which the designers are faced. It is firstly done through an overview of the main approaches, then by facili-tating their appropriation/understanding on an example, and finally by offering a comparison of the approaches according to some criteria. A separation is made between methods which always include a process and languag-es which offer notations but do not have proclanguag-esslanguag-es. This difference already allows making a first choice, de-pending on whether one favours the availability of a process or not.
In the remainder of this article, the second section gives an overview of the works carried out by other authors on the comparison of approaches to design real-time and embedded systems, and positions our work compared to the latter. The third section specifies the criteria and rating scale used for qualitative and comparative analysis of approaches. The fourth section describes the system which serves as example to illustrate the operation of the different approaches presented. The fifth section is devoted to the presentation of the approaches highlighting the aspects related to the proposed criteria. The sixth section is dedicated to tables providing the ratings of the approaches according to the comparison criteria, to the corresponding graphics for a better appreciation of ap-proaches. A discussion on the results obtained from this study followed by some perspectives concludes this ar-ticle in Section 7.
2. Related Work
Many works which have been done in the last decade focused on the study and comparison of languages, me-thods and design processes of Real Time and Embedded Systems (RTES). Some of them examine languages and methods for software architecture in general without restriction on RTES.
STAINES [2] examines and compares several methods of designing real-time systems. He defines a set of comparison criteria, and a mark scheme going from 1 to 5. Then he builds a comparison table in which a score between 1 and 5 is assigned to methods for each criterion defined. A graphic is then constructed from the tables.
SHIRAISHI [3] performs a qualitative comparison of two different approaches of model-based development of real-time embedded systems. The first approach uses the AADL language and the second combines the lan-guages SysML and MARTE. His objective is to compare the two approaches on the phases covered by each of them in the development cycle. He defines seven requirements that an ADL (Architecture Description Language) should meet, then among the ADL identified, he selects those that best meet these requirements. Finally, he combines them into the two approaches mentioned above.
MEDVIDOVIC et al. [4] present a classification of architecture description languages (ADL), and propose a framework to compare them on a set of criteria. They begin by presenting the difference between ADL and other languages (e.g. Programming languages), follow by the definition of three characteristics that ADL must have (components, connectors and configuration), and then address the elements that ADL tools should meet. This study ends with a table for each element of comparison. These tables explain how each sub-element of a crite-rion is implemented by the languages.
process modelling. They present approaches, by structuring them in paragraphs corresponding to the defined criteria. Each approach is presented alone in a table which analyses its expressiveness. A rating scale is defined as follows: the approach receives 0 if the criterion is not taken into account, 1 if it is partially supported, 2 if it is fully supported. The scale is then used to construct a table summarizing the evaluation of approaches according to the criteria.
CLEMENTS [6] makes a taxonomic study of ADLs. He characterizes these languages in terms of: class of systems they support, properties inherent to languages themselves, processes and technological supports that they provide to represent, refine, analyze and build systems from an architecture. He based himself on the results of a questionnaire produced and distributed to the owners of ADL, and which has allowed to characterize each ADL in terms of type of systems and architectures it supports, types of analysis that it facilitates or offer and of intrinsic qualities. The results of this survey are summarized in a table containing all the ADL considered.
The works presented above deal with the comparison of approaches to design real-time systems, but some of them ([2] [6]) do not take into account recent languages such as SysML, AADL, MARTE, others ([3]-[6]) focus on languages and do not address methods. Some of the works presented ([2]) have a scoring method based on the authors’ experience. Although this scoring method has the advantage of allowing to benefit from the rience of the authors, their disadvantage is to be quite subjective. Indeed, the scores based on authors’ expe-rience can quickly vary from one experiment to another. Furthermore, dependability that is an important prop-erty in the majority of real time and embedded systems, is not taken into account in almost all of these works ([2] [4] [5]).
The goal of our work is to provide an objective comparison of approaches dedicated to the design of real-time and embedded systems, taking into account both modelling languages and design methods, including recent modelling languages (SysML, AADL, MARTE), and incorporating the criterion of dependability. In the next section, we present our comparison criteria and our rating scale.
3. Comparison Criteria and Scale of Ratings of Approaches
For the comparison of approaches, we defined four criteria inspired by those proposed in [2]. Each of these cri-teria is characterized by a set of elements (sub-cricri-teria). These cricri-teria are:
-Usability: It reflects the ease of use of the method or language. This property seems important to us and even essential, because the approaches that are easy to use are generally preferred to those that are more complex. For each approach, we evaluate the ease of use from the following elements: clarity of its diagrams, types of nota-tions used (textual, graphical, XML), the possibility to generate code from its models and existence of software tools (free and proprietary) supporting it.
-Compositionality: It refers to the way in which the notations of an approach are combined to describe a sys-tem. It also describes the structural composition, that is to say the capacity of the approaches to identify the dif-ferent components of a system and to model the system hierarchically from these components (structural com-position). This criterion is important because the structure obtained by composition of notations of the method will be used to build the final system. This criterion will take into account the following elements (sub-criteria): the means for system design (system engineering), the existence of a component model, capabilities of model-ling and of decomposition/composition of a system (hierarchical decomposition). This criterion assumes the ex-istence of techniques to refine the final design. This implies abstraction and information hiding.
-Availability of notations and techniques for real-time: This criterion evaluates approaches on their ability to take in charge and to manage real-time aspects. We defined a set of elements for this evaluation. Thus, this property takes into consideration: communication (exchange of messages, priority on messages, shared data, management of events and signals), concurrency management mechanisms, synchronization mechanisms (mu-tual exclusion, semaphore, monitor, rendez-vous) and time management (time quantification, management of simple or multiple clock). Special notations must be available in the approaches for the management of these elements.
components), the possibility to analyse models (schedulability and performance analysis) and simulation. -The ability of modelling of software and hardware (codesign): in many systems, satisfaction of real-time constraints need to take into account both hardware and software aspects. In such cases, it is important to model not only the software, but also the hardware on which it will be deployed. Given its specificity, this criterion will not be detailed as the others. We simply specify which of the approaches discussed, take it into account. We give an analytical table specifying whether or not an approach takes it into account.
Regarding the mark scheme of approaches, we do more a qualitative comparison and thus specify if the prop-erty is taken into account (1) or not (0) by an approach. To compare the methods, a score will be assigned to each approach for each criterion, by simply summing the 0 and 1 obtained for each sub-criteria of the criterion.
4. Presentation of the Illustration Example
This section presents the system that will serve as a basis to illustrate some aspects of the operation of the ap-proaches considered in this article. This is a speed control system (cruise control) of vehicles, whose description is available in [7]-[9]. This system consists of several components that interact in real time. In this system, the user data and the sensor data are read at the input. These data are used to set the new value of the desired speed, which will be compared to the current speed. The result of this comparison is used to define the adjustment val-ue of actuator output. The function of the speed controller is to take over the task of maintaining a constant speed at the driver’s request. Once adjusted, the system is activated and supports the throttle control. When ac-tivated, the cruise control can be suspended and restarted by the driver by pressing the suspend/resume button, or the brake pedal. While suspended, the system must memorize the desired speed. The driver must be able to enable, disable, start acceleration (increase speed), stop the acceleration (decrease speed) and restart the auto-matic system. He increases the speed by depressing the accelerator pedal, and lowers it by pressing gradually on the brake pedal. He also has the ability to change the gear selection while the cruise control is active, by entering a new desired speed. When the accelerator is released, the control system resumes control from the last set speed. The entry of any other command than those intended for the speed control system, deactivates the automatic system.
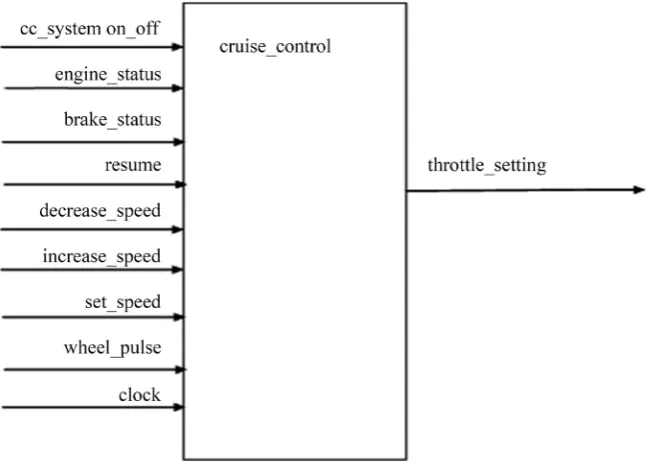
Figure 1 below shows a block diagram of the system with the input-output signals [10] [11]. This system has the following inputs/outputs:
-cc_system_on_off: activated, this signal indicates that the speed control system would recognize the inputs by treating them appropriately.
[image:4.595.153.478.474.710.2]-engine_status: activated, this signal indicates that the vehicle engine is switched on, the speed control system
is active only if the engine is running.
-brake_status: This signal is activated when the brake pedal is pressed, the cruise control will disengage when the brake pedal is pressed.
-resume: This signal contains the last speed maintained, it is only applicable if the cruise control is on. -decrease_speed: This signal decreases the speed maintained, it is only applicable if the cruise control is on. -increase_speed: This signal increases the speed maintained, it is only applicable if the cruise control system is running.
-set_speed: when it is generated, the current speed should be maintained. -wheel_pulse: signal (pulse) sent to each wheel spin.
-clock: this signal sends a synchronization pulse (for example, every 10 milliseconds). -throttle_setting: this signal corresponds to the position value for the accelerator setting.
5. Presentation of Methods and Languages
An analysis and design method is a process whose objective is to allow to formalize the stages of development of a system, to make this development more faithful to the needs of the client. To do this, we start with an in-formal statement (need as expressed by the client, complemented by information obtained by soliciting experts of the field, such as future users of software), and the analysis of the potential existing (that is to say, how the process to design is currently implemented at the customer). In a method, one uses one or more modelling lan-guages for symbolic or schematic representation of the various models produced in the method, tools and one applies an approach. In other words, a method is a set of one or more modelling languages, of a process or ap-proach to drive the development and tools that support it.
In this section, we present design approaches (languages and methods) of real-time systems by giving for each of them: a brief presentation; the ease of use it offers (take in hand, the availability of tools supporting them, concepts and notations available for the representation of systems); the means provided to compose the system from structural elements, and produce the architecture; elements provided for real-time aspects of the system; dependability mechanisms offered by the approach; an illustration of its use through the application to the ex-ample chosen. The approaches presented in this section have been chosen to be a representative subset of design methods and modelling languages of real-time and embedded systems. These approaches are also those most studied in the literature. The section is organized into two sub-sections: the first presents methods and the second is devoted to modelling languages for real-time systems.
5.1. Methods
5.1.1. CORE (Controlled Requirements Expression)
1) Presentation
CORE method [12]-[14]—was designed in the UK for the requirements analysis phase (needs) and projected for the avionics industry. The authors of this method are based on the fact that there is a relationship of cause and effect between the requirements specification of a system and the quality of the final system. This is a con-sistent method for the specification of real-time requirements, which integrates object-oriented models, graphics and formal specification, which allows non-algorithmic specifications [15]. CORE is object-oriented in the sense that a CORE specification is written in terms of objects and relationships between objects. Objects are its pri-mary architectural components. But its approach differs from that of many object-oriented methods, because it uses a model of formal behaviour to guide the decomposition and definition of objects. This behaviour model defines the types of information that the definition of an object may contain, that its interface can provide, and that other objects can use. A behaviour model allows developers to select an appropriate set of objects, to define them and determine the moment where the specification is complete and consistent. The behaviour model de-termines what information should be captured, the data model describes how information is organized. The final products of CORE include: the context diagram, the information model diagram (shows the dependencies be-tween static objects), the transformation model diagram (shows the interfaces information that are used by ob-jects), the element model of input data (gives for each input to the system, an acronym, its values and meaning, the transfer mode of the data, etc.) [15], the element model of output data. It is applicable to the description of dynamic aspects of several types of systems.
CORE is more specialized for the needs analysis phase. As such, it provides a facility for the understanding of the system to be developed. It makes extensive use of the concept of point of view and allows developers to bet-ter understand the system by studying it under different angles. CORE defines steps for requirements specifica-tion: for each step, the activities to be undertaken are described, as well as controls to perform. It offers a graph-ical notation that supports it. This is a fairly simple notation and which can be applied to different aspects in the system description. It also provides a consistent formal interpretation of its graphical and mathematical notations. This allows to graphical specifications to be combined easily with detailed specifications, which are given in mathematical and textual notations. Finally, CORE describes the required behaviour in the form of mathematical relationships between the quantities of the environment, it makes it possible to specify requirements without providing unnecessary details of design. This is a mathematically rigorous method. Thus, it supports precise re-quirements, unambiguous, complete and consistent. The results of the analyst’s work are recorded in the CORE diagrammatic notation for which a set of rules is laid down. This notation will be accessible to most clients. Its diagrams are classified into two categories: dynamic diagrams that represent the time flows and the connections between ordered temporal elements and static diagrams that show the hierarchical structure linking the dynamic diagrams. CORE does not provide a textual language to describe the developed systems. It offers a four-step ap-proach: 1) definition of the problem, 2) definition of points of views of the requirement (life cycle, environment, operator, reliability), 3) development of detailed models for each point of view, 4) combination of the different points of views in a compound model. There are a few tools such as CORE, which is a complete modelling en-vironment designed for engineering of complex systems. It allows requirements management to ensure that we capture accurately the needs of customers, it allows to build fully executable behaviour models. There is also PSL/PSA (Problem Statement Language/Problem Statement Analyzer), which is a computer-aided technique for structured documentation and analysis of information processing systems; it is a powerful requirements model-ling toolkit.
3) Compositionality
It is possible to achieve a structural composition of the system from its notations; Indeed, CORE offers two ways of decomposing a system: the data decomposition and the actions decomposition. Furthermore, static dia-grams provide a structural view of the system. Its diadia-grams are quite understandable and it offers a textual inter-pretation of diagrams (static and dynamic). CORE analysis proceeds iteratively, each iteration decomposing the viewpoints at a certain level. In this way a top-down expansion of the viewpoint hierarchy is produced. (this is similar to the viewpoint models of SADT). It is the responsibility of an experienced analyst to extract from all the parties concerned the relevant viewpoints, at each step, and the relationships they have with each other and with the hierarchy of which they form part. CORE defines how the analyst should propose, define and confirm these relevant viewpoints. The “confirmation” of viewpoints means their successful combination into a coherent system, the addition of reliability actions and data to the combined viewpoints, and their acceptance by the users [14].
4) Existence of notations dedicated to real-time
For each point of view, CORE allows to define various types of characteristic information. Thus one can de-fine actions (send a message, execute an instruction, etc.), time-based events which trigger these actions. This allows to support the analysis of some real-time aspects.
5) Dependability
As we mentioned above, CORE provides a consistent formal interpretation of graphical and mathematical notations. This can help to make a formal analysis of models so specified. CORE is also seen as a procedure for determining the functional requirements of a system, and develop the functional specifications of this one. It de-termines the requirements from different points of view, including that of reliability. Thus, the specifications produced by CORE from requirements related to reliability, take into account the actions to be executed by the system in case of failure, and under different conditions.
6) Illustration example
The central concept of CORE is the viewpoint and the associated representation known as the viewpoint hie-rarchy. Viewpoints are not only concerned with human perspectives. Viewpoints can be associated with:
• the system’s stakeholders;
Thus, a viewpoint can be a person, role or organization that has a view about an intended system.
When used for system requirements, the viewpoints can also represent the intended system, its subsystems and systems that exist within the environment of the system that may influence what the system must do. The viewpoints are organized in a hierarchy to provide a scope and also to guide the analysis process [16].
First, we must identify viewpoints. For example, on Cruise Control System, here’s a possible list of initial views that can be obtained after a brainstorming.
Having produced a list of potential viewpoints, they are organized into a hierarchy by grouping related candi-dates. The figure below shows a partial hierarchy of viewpoints for the Cruise control system.
7) Strengths and weaknesses
CORE is adapted to the requirements specification of a system. It expresses specification with the help of in-formal notations such as block diagrams. But CORE is a mathematically rigorous method, which also provides a formal interpretation of its graphical and mathematics notations. This approach could be used in conjunction with object-oriented analysis. It is supported by a fairly simple diagrammatic notation, but that allows to represent several essential points of views of the required system configuration. The main limitations of CORE are: 1) The real-time aspects, the concurrency management and the synchronization are not clearly defined; 2) It is inappropriate for the architectural design; 3) It is rigid and relies on too many steps; 4) For anything but very small projects, manual support of CORE is likely to be unwieldy and an automated tool such as PSL/PSA or SDS/RSRE is required.
5.1.2. Jackson System Design
1) Presentation
JSD [12] is a method for the specification and design of systems whose field has a strong temporal capacity, and containing objects whose behaviour is describable by sequential events. The Jackson method has been used
System
Maintenance Engineer
Cruise Control System (CCS)
Environment
Cockpit Sensors Braking System Recording System
Engine Throttle Actuator
Pilot
Brake Control pedal
for several systems development problems. These are systems ranging from data processing to music synthesizer, passing by control software and embedded systems.
2) Usability
JSD provides a graphical notation and its sequential processes are documented by a pseudo code, called structure text. It is a linear method. Therefore, its steps are simple to follow. Three basic principles underpin the functioning of the JSD method:
-We must begin the development by describing and modelling the real world, rather than specifying or struc-ture the functions performed by the system;
-An adequate model of a time-ordered world must itself be ordered in time, the main aim being to match the progression of real world to the one of the system that models it;
-The implementation of the system is based on the translation of its specification into a set of effective processes. These processes must be designed so that it is possible to do them operate on the software and hard-ware available.
JSD has three phases in its implementation [1]: the modelling phase, the network phase and the implementa- tion phase.
The modelling phase: In this phase, the designer identifies the entities of the system, the actions that they car-ry out, the order of execution of actions in the life cycle of entities, and attributes of entities and actions. A structure diagram of entities is produced, which gives a full description of the system and its organization.
Network phase: At this stage a model of the whole system is developed and represented in form of diagram of specification also called network diagram. The network diagram shows the processes and communications be-tween them. The communication bebe-tween processes is in the form of data streams or messages through state vectors. So this phase focuses on defining the system functionalities. Each entity identified in the previous phase, becomes a process in the network diagram. The programs which are external to the system are added to the dia-gram later. The whole system is described using these network diadia-grams, which are complemented by the de-scription of the data and the connections between the processes and programs.
The implementation phase: During this phase, the JSD specification, composed potentially of a very large number of processes, is translated into a system implementation diagram which is directly executable. The latter presents the system as a process scheduling calling the modules that implement the system.
There are a few tools to build JSD diagrams; we can mention:
-Smartdraw: which provides an editor to build the structure diagram of entities (from the modelling phase) and network diagrams (the result of the network phase). This tool is not free.
-Jackson Workbench: is a suite of tools making it possible to build, among others, the JSD diagrams.
-We also have JSD Network Editor, which supports the JSD method for the design of software systems. This editor offers a wide visual interface that allows the specification and implementation of JSD network diagrams.
3) Compositionality
The system is built gradually from its components. In the modelling phase, the system is broken down into its various entities; then the actions realized by these entities are specified. The various components of the system thus obtained are grouped in a structures diagram of the entities.
4) Existence of notations dedicated to real-time The method provides the following possibilities:
Communication by message: in the network diagram, the communications in the system through connections by data stream are done by sending messages.
Support for special event type: JSD uses messages called time markers that act as data flow but contain syn-chronization information. They are roughly merged with other data streams to monitor the arrival of messages and the moment of execution of processes. They are used to trigger actions within the processes, start and stop processes and generally help to process synchronization.
5) Dependability
JSD allows to define a permissible delay between the sending and the reception of a message, which ensures some security in communication.
6) Illustration example
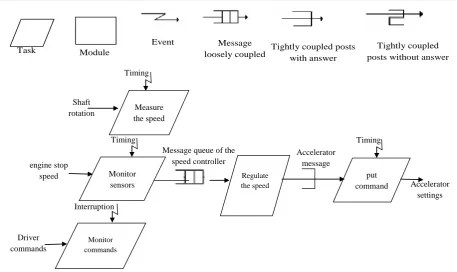
JSD method provides the following graphical notations for systems modeling (see Figure 2):
not only communication between two processes, but also to communicate external events to a system. A process can write in a state vector, if it is the owner (source of the state vector) or simply read its contents otherwise.
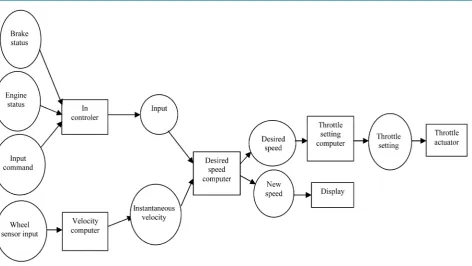
Figure 3 shows the network diagram of the control system of a vehicle containing the speed controller. Figure 4 shows the network diagram of the cruise control subsystem.
7) Strengths and weaknesses
The application of JSD to design of real-time systems has strengths, but also limitations [1]. Strengths:
-The emphasis on modelling of real-world entities is a theme that has been followed by several object- oriented analysis and design methods;
-The modelling of each entity of the real world, focusing on the sequence of events experienced by the entity is particularly relevant in the real-time systems design;
-The concurrent treatment is an aspect which is at the heart of the method. -Clear steps are planned to spend from a JSD design to an implementation. Weaknesses:
-Since the structure of entities and therefore, the models of structures handling event sequences almost faith-fully represent the real world, relatively minor changes in the real world can affect the software structure, which could make maintainability more difficult and is a potential barrier to reuse;
-JSD does not focus on data abstraction and information hiding, which could have a negative impact on maintainability;
-JSD uses a structure diagram of entities to represent systems, while it is often easier to model the events se-quence in a complex entity with a state-transitions diagram; especially in real-time systems where complex
Figure 2. Notations provided by JSD.
Figure 4. Network diagram of the cruise control subsystem.
events sequence are not uncommon.
5.1.3. Real Time Structured Analysis and Design, Yourdon Structured Method and Design Approach for Real Time Systems
1) Presentation
RTSAD [10] [17], DARTS [10] and YSM [12] [18] are three fairly close methods based on the DFD (Data Flow Diagram). They include an extension to DFD by adding the details on the flows of events and controls transformations: discrete, continuous, activation and deactivation. They also use state transition diagrams.
YSM is based on the classic DFD and structured methods used for designing traditional data. This method has been adapted and combined with many real-time design approaches. YSM has been developed and improved over the years and many modern tools support its notations.
2) Usability
These methods use two main types of diagrams: the Data Flow Diagrams (DFD) and the Control Flow Dia-grams (CFD), which in principle can be combined. They are quite well known diaDia-grams, reflecting the take on hand fairly quick and easy of these methods. In addition to the DFD, the CFD and state transition diagrams, there are other notations intended to provide more detailed information on the design. Among them, there are entity-relationship diagrams and structure diagrams. These, though important, are less specific to the definition of the behaviour of real-time systems.
A particularity of YSM compared to the other two, is that it can be used in conjunction with diagrams like the PEM (Processor Environment Model) [19], which describes how the activities of the system and data are allo-cated to different processors, which helps to decide on the hardware configuration of the system; and SEM (Software Environment Model) [19], which is a description of the software architecture over a processor.
The RTSAD method provides an approach structured in five steps: defining a context diagram, decomposition of the system into a data stream or control flow, building of a control transformation or control specification, process specification, and development of a data dictionary. YSM as for it is based on the conventional DFD and structured methods used in traditional conceptions of data. Regarding the DARTS method [10], it offers the following steps: specify the system using notations of RTSAD, structuring the system into concurrent tasks, de-fine the interfaces of tasks, design each task.
tasks architecture.
An example of tool is the SELECT Yourdon, which operates under the Microsoft Windows environment, and allows people with a small budget to design and document their products. It supports data streams and controls streams. It also allows the design of state transition diagrams and allows to create a complete data dictionary.
3) Compositionality
The use of YSM begins with a high-level description of the system, which breaks down until lower levels (simple) with complete specification of the program. In RTSAD method, the system is decomposed into a stream of data or controls. It is an approach that consists of breaking down a system into its components through a DFD or a CFD. In DARTS, the second step of the method consists in decomposing the system into subsystems and to identify interfaces of these latter. This decomposition is done until the concurrent tasks of the system are obtained.
4) Existence of notations dedicated to real-time
In these methods we have the notions of control flows (signals or interruptions) and of control processes (processes whose only job is to coordinate and synchronize the activities of other elements of the DFD). The DARTS method particularly includes concurrency in the design, and allows the expression of communication and synchronization mechanisms between the units of concurrency. There is also a concurrent version of DARTS called CODARTS [10], which is an improvement of DARTS specialized in the development of real- time systems, with a reinforced take in account of concurrent aspects. The final products of the method are: the tasks diagrams that define the tasks and their interactions, and structure diagrams of each task which provide a static description of the code. The YSM method introduces additional elements necessary for the consideration of real-time systems: continuous temporal data, event data (logical signals), continuous flow, control flow (sig-nal), command memories, commands to enable, disable and trigger the processes.
5) Dependability
These three methods do not define any technique of dependability, if we do refer to the elements chosen in this work to characterize this aspect.
6) Illustration example
These methods use the following symbols for the construction of their different diagrams:
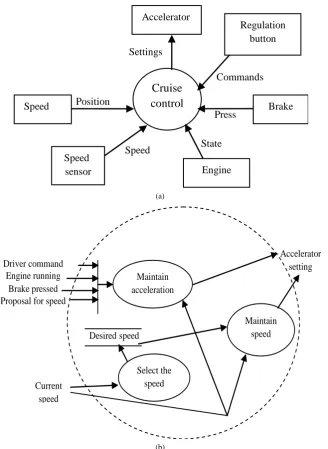
We illustrate the use of these notations in the diagram of Figure 5, which shows the context diagram and data flow diagrams (DFD) of the cruise control system.
Works have been done on the integration of temporal aspects in the DFD. Thus, new concepts and notations have been defined to distinguish: three types of streams of events (signal, activation, deactivation), and two types of storage (data storage and buffer).
Figure 6 shows these various elements.
The works of [20] give more details on these concepts, as well as uses thereof in the specification through examples.
In addition to these DFD techniques, the DARTS method uses other notations that we will present in the sec-tion related to ADARTS.
7) Strengths and weaknesses
(a)
(b)
[image:12.595.152.481.80.530.2]Figure 5. (a) Context diagram; (b) The cruise control DFD.
Figure 6. Types of flows of events and storage.
Cruise
control
Accelerator
Brake
Speed sensor Speed Position
Settings
Commands
Press
State Speed
Regulation button
Engine
Maintain acceleration
Maintain speed Desired speed
Accelerator setting
Current speed Driver command
Engine running Brake pressed Proposal for speed
5.1.4. Modular Approach to Software Construction, Operation and Test (MASCOT)
1) Presentation
MASCOT [12] [21] [22] was published for the first time in 1970 by the Institute of Signals and Radar in the UK, and several versions exist. Its most recent version is version 3. It is mainly used for avionics and military applications. It is a very rigorous modular approach based on hierarchical decomposition towards the base levels. MASCOT is based on processes or activities in a system and has for goal to design interactive and complex real-time applications, in a highly structured approach. It focuses on the communication between the different components of the system and requires that the specification be complete at each level.
2) Usability
MASCOT is based on a form of functional and structural decomposition, which is particularly suitable for use in the development of large distributed real-time embedded systems for data processing. The emphasis is on the word “large”: a large number of people involved in the development, a large amount of code to write, a large number of requirements to be taken into account at the same time, a wide variety or quantity of hardware re-sources, a project whose development extends over a long period. Of course, all these measures of sizes are rela-tive. The method provides a design language and a graphical notation, and a process of conceptual derivation. MASCOT models are stated in terms of a set of text modules and diagrams that support the principles of data flow on which the method is founded. These diagrams are used to show the decomposition of a system into subsystems consisting of concurrent tasks. The interfaces between the tasks are in the form of channels (message queues) and pools (information hiding modules). There is a textual language to describe the graphic representa- tion. The main steps of this method are: 1) Fully describe the internal functions of the system, and its relations with the outside. This is done through the network diagram. 2) The first network is decomposed into compo-nents of lower level, 3) the compocompo-nents are encoded in terms of algorithms and data structures.
In terms of tools, we have the development environment of MASCOT version 3.1, which was defined in terms of a set of functions to control the progressive capture of a design.
3) Compositionality
Modular as its name suggests, the cornerstone of the method is a particular formalism by which a complex software can be broken down into a number of smaller components that interact with each other, and this de-composition process can be repeated at any depth required to produce a manageable development task.
4) Existence of Notations Dedicated to Real-Time
MASCOT provides the ability to use certain communication protocols [22]. These protocols allow asyn-chronous communication, which prevents implicitly the interlocked timing relationships into the synasyn-chronous communication.
5) Dependability
MASCOT does not define any technique of dependability, if we refer only to the elements chosen in this work to characterize this criterion.
6) Illustration example
MASCOT is characterized by two types of elementary basic components: activity (a single thread of execu-tion), which is an active element, and IDA (intercommunication data area) which is a passive element. IDAs are interconnected to form a data flow diagram.
Connection to physical entities (represented by a grey rectangle) is made by dashed lines, which indicate what software unit is responsible of which hardware.
MASCOT uses a number of concepts and notations for systems modelling, including: -Activity: A rectangle with rounded edges and often a circle
-IDA: A rectangle or a rectangle with rounded side.
-Window: A small full rectangle. This is a IDA point, marking the passive end of a connection of data flow. -The port: A small full circle, this is a point in the activity that marks the active end of a connection of data flows. Each port expresses a requirement for access to data of the IDA, which must be satisfied when the port is connected to a window of IDA.
-The path: An arrow, this is a connection between a port and a window. Only one path must be connected to a port, but several paths can be connected to a window.
-The physical entity: A grey rectangle.
located outside of its representation.
Figure 7 below shows these notations and one way to use them in a representation.
On Figure 7 we have an activity (Activity 1) that contains another activity (with the ports P1 and P2) and 2 IDA (having windows F1 and F2). The IDAs make it possible to Activity 2 to communicate with entities E1 and E2.
Figure 8 provides a representation of the cruise control system using MASCOT. 7) Strengths and weaknesses
One of the strengths of MASCOT is that it relies on the Ada language and as such, it benefits of its advantag-es in terms of dadvantag-esign of large systems, of high level of abstraction, etc. The fact to be based on a form of func-tional and structural decomposition makes it well suited to the development of large distributed real-time em-bedded systems for data processing. MASCOT has some limits, among which: it does not directly support the requirements analysis (needs) and goes directly into building models; there are not many tools supporting it; it is not suitable for prototyping or for rapid application development; its use greatly increases development costs.
5.1.5. Ada Based Design Approach for Real Time Systems (ADARTS)
1) Presentation
ADARTS [10] is a modified version of DARTS mainly oriented towards use with Ada. The Ada language needed a new design method of real-time systems, because it was different from the classical languages in two important points: 1) concurrency and communication of processes are inherent to the language and do not re-quire a separate real-time execution, and 2) the nature of the task model was different from those of the most popular current methods, used for tasks planning, communication and synchronization [24]. An Ada version of the DARTS method has therefore been created. Its objective is to provide the principles and decomposition steps for structuring real-time and concurrent systems between concurrent tasks and data abstraction modules.
2) Usability
[image:14.595.94.535.462.707.2]ADARTS provides a graphical representation and textual notations for modelling real-time systems. The stage of the structured design in DARTS is replaced by the one of modules structuring, with concealment of in-formation provided by Ada. It can be considered as similar to DARTS, but with some improvements such as ab-straction and decomposition. Another version of DARTS also exists and is intended for the design of distributed real-time applications: this is DARTS/DA. It proposes an approach based on five steps: development of an en-vironmental and behavioural model (development of a context diagram, of a states-transition diagram, of data
Figure 7. Graphical representation of MASCOT concepts.
E1 E2
P1 P2
F1 F2
IDA 1 IDA2
Activity 1
Activity 2
Activity Activity IDA Window
Port physical
entity
Figure 8. Network diagram of the cruise control system with MASCOT [23].
flows and control flows diagrams, of a data dictionary and production of a mini specification), structuring the system in concurrent tasks (production of a tasks architecture diagram and specification of the behaviour of each task), structuring of system as information’s abstraction modules (construction of the system architecture sche-ma), development of a design based on Ada architecture (only required for the implementation in Ada), defini-tion of Ada components interfaces (only required for the implementadefini-tion in Ada, here a specificadefini-tion of Ada packages is produced). This method is supported by tools such as IBM Rational Rhapsody published by IBM, which is a model-driven development environment, very interesting for systems engineers and software devel-opers of real time and embedded systems; it allows to create many Ada compatible diagrams and to generate the corresponding Ada code, but also C, C++, Java and C# code.
3) Compositionality
Decomposition is one of the improvements brought by ADARTS to DARTS [25]. Indeed, in addition to sup-porting the mapping to Ada, one of the goals of this extension of DARTS, is to provide more maintainable and reusable designs, adopting greater use of information abstraction than DARTS. This concern for maintainability and reusability leads to the decomposition of the system into subsystems that provide a range of services sup-ported by objects and functions. To fully materialize this decomposition, the method allows to construct one context diagram by subsystem. When subsystems communicate, each appears as a termination in the context di-agram of the others.
4) Existence of notations dedicated to real-time
ADARTS was developed to extend concurrent task aspects of DARTS, putting also emphasis on the informa-tion hiding. ADARTS naturally includes real-time characteristics of DARTS presented above. Another evolu-tion of DARTS called DARTS/DA has been proposed for the design of distributed real-time applicaevolu-tions.
5) Dependability
ADARTS does not define any dependability technique, if we refer only to the elements chosen in this work to characterize this aspect.
6) Illustration example
ADARTS uses DARTS notations. It includes interprocess communication.
Figure 9 shows symbols proposed by DARTS and ADARTS, with an example of use on the cruise control problem.
7) Strengths and weaknesses
Figure 9. Symbols used in DARTS for interprocess communication and example of use on the cruise control problem.
a higher information abstraction than DARTS. In addition, the ADARTS diagrams are fairly well reproducible [25]. The steps are very well defined, criteria fairly detailed, and products fairly specific. The method can there-fore be applied by various designers with similar results. ADARTS allows traceability between the different products of the process. Note however that the effort required to produce an ADARTS design is considerable, this partly due to the amount of documents produced and the relationships between these documents.
5.1.6. Real Time Object Oriented Modelling
1) Presentation
ROOM [26] is a convenient method for real-time software development, which combines the object paradigm with advanced concepts of domain-specific modelling. The emphasis is on modelling on “software architecture” level, which is the key to ensuring the reliability and scalability. The method is also distinguished by its ability to take advantage of computer-based automation (through executable models, reuse and automatic code genera-tion) for better product quality and a higher productivity. ROOM has been used successfully in many industrial projects. The primary structural element of ROOM is called “actor”. An actor is a concurrent object responsible for performing a specific function. An actor communicates with other objects through one or more interface ob-jects called ports.
2) Usability
ROOM defines a specification of the system at two distinct levels, but formally linked. The top level, called schematic level, is used to specify the architectural aspects of a system. The lower level, called detail level, de-fines the details of a finer implementation. This method allows the use of languages such as C++ [27], for an easy implementation of specifications. This ensures a high level of architectural specification that will be part of the specification of the complete implementation. An important feature of ROOM is that it is an object-oriented approach, which makes use of the full range of powerful features inherent to the object paradigm (encapsulation, polymorphism and inheritance), even in the architectures specification. ROOM has a graphical representation and textual notations. It uses finite state machines to specify the behavioural level, because state machines are quite commonly used to capture the reactive behaviour of systems. A special type of hierarchical state machine, called ROOMcharts is used in the method. The ROOMcharts are similar to UML statechart diagram. Objec Time tool produced by the company Advanced Technology at ObjecTime Limited, and the Edraw tool are
ex-Task Module
Event Message
loosely coupled
Tightly coupled posts with answer
Tightly coupled posts without answer
Shaft rotation
engine stop speed
Driver commands
Message queue of the speed controller
Accelerator message
Accelerator settings Timing
Interruption
Measure the speed
Monitor sensors
Monitor commands
Regulate the speed
put command Timing
amples of tools supporting the ROOM method. 3) Compositionality
ROOM offers the possibility to break down a system into subsystems. Using these decomposition functions, complex actors can be decomposed into aggregations of more elementary actors. ROOM imposes no limit on the number of decomposition levels, which allows for arbitrarily complex architectures specification. A hierarchy defined in the ROOMcharts allows a state to contain a states machine. This makes it possible to solve a complex problem gradually, by approaching one abstraction level at a time.
4) Existence of notations dedicated to real-time
ROOM focuses its schematic language on a single domain: real-time distributed systems, characterized by events or reactive behaviour. This means that all proposed notations are specific to this field. It handles events by sending messages. The arrival of an event is signalled by the arrival of a message to an object. Sending mes-sages is useful for modelling the asynchronous nature of the events, as well as for the treatment of distributed systems where shared memory may not exist. Communications based on synchronous and asynchronous messages are supported.
5) Dependability
The ROOM method allows to define models which will be simulated by its ObjecTime tool. This allows to do a sort of validation a priori of models before their implementation.
6) Illustration example
ROOM uses the following concepts:
-Actor: This is the primary structural element of ROOM. It is a competitor object responsible for performing specific functions.
-Port: Enables communication between actors and other objects. -Connection: Establishes a communication link between two ports.
For the representation of complex systems, ROOM combines one or more different types of objects in an ag-gregation of functions. In ROOM, this is represented by three mechanisms of primary composition: binding, layer connection and the containment relationship.
An actor is represented as shown in Figure 10.
P1 is a provided Port (signal transmitter) and P2 is a required port (signal receiver).
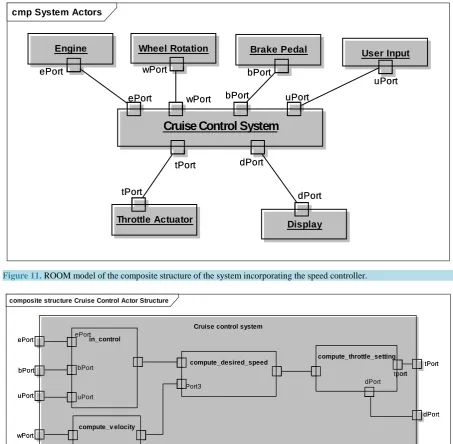
We show in Figure 11 a model representing the speed control system, wherein the cruise control is an actor.
The system is then defined by seven actors: one for the system speed control (cruise control system) and one for each component with which the cruise controller interacts to perform its functions.
The behaviour of each actor is given by a statechart diagram.
We give thereafter the internal structure of the control system itself. This is what is shown in Figure 12. It is possible to define temporal constraints on transactions between system components. For example, Figure 13 (adapted from [28]) shows transactions with temporal constraints, between the speed controller and other system components.
On this schema, we define a time of 100 ms between the time where the user enters his speed (through the lever), and the one where the new acceleration data are issued by the system.
7) Strengths and weaknesses
[image:17.595.224.401.622.709.2]ROOM uses a “run-to-completion” model event processing. This simply means that messages are processed one at a time; once the management of a message is initiated by an actor, and until it is completed, no other message is processed by the actor (which implies to put messages in queue at interfaces). The advantage of this
Figure 10. Representation of an actor in ROOM.
An_Actor
P1
Figure 11. ROOM model of the composite structure of the system incorporating the speed controller.
Figure 12. ROOM model giving the internal structure of the cruise control.
approach is that it provides the automatic mutual exclusion of event handlers and, therefore considerably simpli-fies the behaviour specification. It has some limitations among which: it requires a special tool called “Objec-Time”, it has a limited number of diagrams, which show only certain views of the system: the static view with the level of architectural specification and the dynamic view with ROOMcharts and details for the implementa-tion. Diagrams that it offers do not allow a good conduct of initial requirement engineering.
5.1.7. Hierarchical Object Oriented Design
1) Presentation
HOOD [2] [29] is one of the first methods of object-oriented design. It was created by the European Space Agency to provide models-oriented solution over the Ada programming language, for its major projects such as Ariane, Hermes and Columbus. It defines a fairly complete development process from requirements analysis to
cmp System Actors
ePort wPort bPort uPort
tPort dPort
Cruise Control System
ePort wPort bPort uPort
tPort dPort
ePort Engine
ePort wPort
Wheel Rotation
wPort bPort
Brake Pedal
bPort
uPort User Input
uPort
tPort
Throttle Actuator
tPort dPort
Display dPort
composite structure Cruise Control Actor Structure
wPort uPort bPort ePort
tPort
dPort Cruise control system
wPort uPort bPort ePort
tPort
dPort ePort
bPort
uPort in_control ePort
bPort
uPort
Port3
compute_desired_speed
Port3
tport dPort compute_throttle_setting
tport dPort
wPort
compute_v elocity
Figure 13. Message sequence annotated of system transactions. Adapted from [28].
code generation of distributed real-time software. HOOD can be used for prototyping. The idea is to identify objects in a hierarchical parent-child relationship, and their operations. A graphic description of the system is produced in a data/controls flow diagram.
2) Usability
HOOD provides a graphical notation, with fairly clear diagrams and easy to understand. HRT-HOOD version has a textual notation. With HOOD, a project consists of a set of main modelling units called “Designs”. A “De-sign” may lead either to a completely autonomous software application (executable file), or a library of linkable software entities (functions, data types, classes, …). Moreover, dedicated categories of models have been de-fined to support reusable parametric components (generic) and software partitioning of distributed systems (vir-tual nodes). Each HOOD model (design) is the root of a hierarchy of components which are usually built in a top-down approach that directs the architectural design phase of the software development process. HOOD ap-plies the client-server communication between interacting components. Accordingly, all these interactions are implemented by function calls. In particular, the standard rules of HOOD recommend to prohibit direct access to shared variables and to implement all the data stream by subroutines calls. Furthermore, in order to ensure a good management of the development team, of the modular deployment and maintenance of applications, HOOD imposes a strict visibility of rules easily controlled at the design level. The life cycle proposed by HOOD is fairly standard and includes: requirements definition (specification of functional and non-functional require-ments of the system is produced), architectural design (a high-level description of the proposed system is devel-oped), detailed design (the design of the complete system is specified), coding, testing (system efficiency is tested).
There are tools supporting HOOD, among which STOOD, which is a tool produced and marketed by the Elli-diss Technologies company. STOOD offers many features: it makes it possible to ensure an update of traceabil-ity between the system and the software models and the initial requirements, which may be imported from text files or other tools; It provides a graphical editor for building of architecture models of the software and its en-vironment (libraries, runtime platform, …); it also allows detailed design, checking a design, integrating analysis tools, automatic code generation in Ada, C and C++, and generating design documentation.
3) Compositionality
time
userInput
cruiseControl
speedometer
throttle
cruise
cruise
speedRequest
speedValue
throttleValue
As mentioned above, the HOOD method is based on system decomposition into a components hierarchy de-scribing the system. Thus the objects are identified, and for each object, its children objects are identified, and so on. It guarantees a low coupling between modules (components) of a system, which is a necessary factor for system components reusability and maintainability.
4) Existence of notations dedicated to real-time
HOOD modelling structures include active components to support concurrent control flow in same software. Communication protocols between the active components are defined and include synchronous (low and high) and asynchronous paradigms. A specific version of the HOOD method called HRT-HOOD (Hard Real-Time HOOD) [30] introduces more accurate real-time components. It allows for example to define the type of an ob-ject, which can be: protected, cyclic or sporadic. For cyclic and sporadic objects, this version of HOOD allows to define: the period (cyclic objects), the minimum arrival time interval (sporadic object), deadline (for the 2 types of objects). These temporal attributes are managed for scheduling analysis purposes. In addition, in HRT- HOOD, protected objects control access to data that is shared by more than one thread (this is concurrent activi-ty through an object).
5) Dependability
The decomposition rules of the method ensure the obtaining of a final design onto which temporal properties analysis can be performed. Indeed, in HRT-HOOD, object attributes were added to the terminal objects, to ena-ble them to be annotated with their real-time characteristics (time, period, worst case execution time). This pro-vides the possibility to perform analysis of non-functional properties on the resulting models (scheduling analy-sis, performance analyanaly-sis, etc.).
6) Example of illustration
A HOOD object is defined by a name, a set of operations, a tree of children objects, a tree of implementations in children operations.
The diagram of Figure 14 shows a representation of one HOOD object and one HRT-HOOD object. The difference lies in the type of the object (passive object, active, cyclic, sporadic, protected) which is specified in HRT-HOOD.
Figure 15 shows, in the HRT-HOOD notation, an object representing the control system of a vehicle (simpli-fied), with the tree of its children objects, including speed control. The system is considered as an active object (A).
Since we are interested in the speed control subsystem, it is question of giving its internal structure. This is done by considering the Cruise Control object in Figure 15, and by giving its tree of children objects.
This representation is given in Figure 16. 7) Strengths and weaknesses
HOOD has a fairly complete development process that goes up to the code generation of distributed real-time software. Its charts are easy to understand. HOOD allows to define generic components, configurable and there- fore reusable. A HOOD design defines loosely coupled modules, which ensures system maintainability and reu-sability of its components. In addition, HOOD4 version significantly improved the method by taking into ac-count the true object-oriented, providing opportunities for code generation in C++ and Ada95. HOOD has limi-tations: it does not distinguish data flows between objects from events signals, it is not so simple to use, and it uses a single type of diagram.
This section has dealt with design methods. The following subsection is devoted to the modelling languages used in the design of real time and embedded systems.
Figure 14. (a) A HOOD object; (b) A HRT-HOOD object. Object Name
Children objects tree
Op1 Op2
Type Object Name
Children objects tree Op1
Figure 15. HRT-HOOD model of the control system of a vehicle.
5.2. Languages
5.2.1. Unified Modelling Language (UML)
1) Presentation
UML [31]-[35] can be considered as a combination of the notations that exist in methods such as ROOM, HOOD, YSM MASCOT, etc. The word “unified” implies a unification of different models. Several diagrams it uses are adapted from other methods. It contains notations that are lacking in other methodologies and it tries to improve and standardise them. It is very well supported by a variety of tools compared to other methods, and its use requires no formal knowledge.
2) Usability
UML is not a method (i.e. a normative description of the modelling steps), but a graphical language for representing various aspects of a system. It provides a set of graphical notations grouped into charts specific to each aspect of a system. Each graphical notation has an associated text which explains its content. UML allows to see the system in 2 different angles called views: a static view and a behavioural view. Although not being a method [31], it can be combined with almost any method of development. Diagrams and notations used are in-formal, but it is possible to use the OCL (Object Constraint Language) to formalise the diagrams. Code can be generated from some diagrams, such as class diagram. UML offers 13 charts to cover all aspects of a system. UML is supported by dozens of tools. These offer graphical editors for the construction of diagrams, and most of them also offer a feature of code generation from diagrams. Some of these tools are free, as Acceleo Ar-goUML, BOUML, Eclipse UML2 Tools, etc. and others are not, such as IBM Rational Rose, Enterprise Archi-tect, Power AMC, Objecteering, etc.
A
Vehicle control system
A Engine
getStatut
A Brake
getStatut
A UserInput
setcommand
A CruiseControl
on_cruise off_cruise resume increaseSpeed decreaseSpeed setSpeed getThrottleValue Engine
statut
Brake statut
A ThrottleActuator
setThrottleSetting
A Display
displaySpeed
A Wheel Rotation
getWheelPulse
Input command
wheel velocity
wheel sensor input
Figure 16. HRT-HOOD model of the speed control subsystem.
3) Compositionality
UML version 2, provides the composite structure diagram which makes it possible to represent a system by its components, and to provide the internal structure of each component. This component-based model makes it possible to obtain step by step the hierarchical architecture of a system.
4) Notations dedicated to real time
UML, through some of its diagrams such as the diagram of sequences, of activities, of state transitions (tem-poral events) and of composite structures, allows somehow, to manage real time aspects. It is possible to per-form temporal specifications on a sequence diagram, by specifying for example the time elapsed between two messages sent [36]. For example, offers the synthesis of a real-time UML design from sequences diagrams. The latest version of UML provides the timing diagram for the management of temporal aspects of a system.
5) Dependability
The notations provided by UML are not formal, but with the OCL language, it is possible to define on UML diagrams, constraints which will be formally checked.
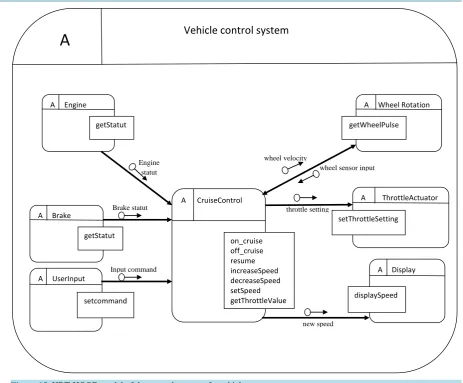
6) Example of illustration
The different graphical notations used in the UML language are summarised by diagrams. In its second re-lease, UML has 13 diagrams. The details on the latter are available in [37]. The components diagram is the one we use for the representation of the architecture of the “example system”. It makes it possible to show the com-ponents of the system into a physical view, as they are implemented to perform the functions of the system. The diagram uses the following concepts:
-Component: element of the system which specifies its interactions with the outside through the definition of its interfaces (provided or required);
-Port: point of interaction of the component. It is associated to an interface of operations (in provided or re-quired mode);
-Connector: it is either of delegation type if it links a port of a component to a port of one of its subcompo-nents (one talks about composite component), or of type assembling if it links an interface of a component to that of another.
Instantaneous velocity
Desired
Input command
new speed
throttle setting Throttle
Actuator
Display A Cruise Control System
f
on_cruise off_cruise resume increaseSpeed decreaseSpeed setSpeed getThrottleValue computeVelocity
A In Controler
on_cruise off_cruise resume getInput
A Velocity Computer
Compute velocity
Pr Desired speed computer
increaseSpeed decreaseSpeed setSpeed
A throttle setting computer
Figure 17 below shows a graphical representation of these concepts.
We use these concepts to represent the architecture of the speed controller, given by the diagram in Figure 18 below.
7) Strengths and weaknesses
UML is easy to handle and offers a wide range of diagrams for modelling almost all aspects and views of a system. The availability of a large number of free tools makes it accessible to all users. It is now used in the vast majority of companies developing software for the purpose not only of documentation and analysis, but increa-singly for productive purposes (automatic or semi-automatic generation of code) or testing. In addition, UML takes into account new (graphical) notations of extended stereotypes, it requires less skill in language design and it reuses languages infrastructures (tools, specification).
[image:23.595.58.540.296.663.2]UML has some limitations: 1) studies show that maintaining UML diagrams can be a complex process, 2) Although OCL allows to define constraints on UML diagrams, it lacks a formal definition of the concept of time and the degree of formal verification of its diagrams remains low, 3) the same things can be modelled from dif-ferent perspectives, and all could be correct, which means it lacks a bit of consistency, 4) in UML we focus more on modelling the system rather than on the process of software development. This implies that UML should be used in a structure like USDP (Unified Software Development Process) created by the OMG and
Figure 17. Graphical representation of the concepts used in a UML component diagram.
Figure 18. Components diagram giving a simplified architecture of the speed controller.
cmp concept composant-Anglais
Composite-Component
Component1
Component2 Port
Provided interface
Required interface «delegate»
«delegate»
«delegate»
cmp Exemple Cruise Control
Cruise_Control_System
In_Control
Compute_Velocity
Compute_Desired_Speed Compute_throttle_setting
throttle setting brake status
user data
wheel sensor data engine status
cruise control status
ok_to run
desire speed
instantaneous velocity «delegate»
«delegate»
«delegate»
«delegate»
«delegate»

![Figure 8. Network diagram of the cruise control system with MASCOT [23].](https://thumb-us.123doks.com/thumbv2/123dok_us/7887695.741520/15.595.77.540.80.340/figure-network-diagram-cruise-control-mascot.webp)

![Figure 13. Message sequence annotated of system transactions. Adapted from [28].](https://thumb-us.123doks.com/thumbv2/123dok_us/7887695.741520/19.595.91.536.86.374/figure-message-sequence-annotated-transactions-adapted.webp)