A Reliability Impact and Assessment of Distributed
Generation Integration to Distribution System
Atthapol Ngaopitakkul1, Chaichan Pothisarn1, Sulee Bunjongjit1, Boonlert Suechoey2, Chaiyo Thammart2, Auttarat Nawikavatan2
1Department of Electrical Engineering, Faculty of Engineering, King Mongkut’s Institute of Technology Ladkrabang,
Bangkok, Thailand
2Department of Electrical Engineering, Faculty of Engineering, South-East Asia University, Bangkok, Thailand
Email: [email protected]
Received April, 2013
ABSTRACT
The main purpose of this paper is to study the reliability due to the employment of distributed generations (DG) inte-grated to distribution system. The system under this study is from Provincial Electricity Authority (PEA) that is a part of Thailand’s distribution system. Data of geographic information systems (GIS) including the distance of distribution line and location of load that are parameter of PEA is simulated using digital simulation and electrical network calcula-tion program (DIgSILENT) to analyze the impact of reliability with the installing DG into the distribucalcula-tion system. The system average interruption frequency index (SAIFI), the system average interruption duration index (SAIDI) and in-terruption cost are assessed as index of reliability by comparing the SAIFI, SAIDI, and inin-terruption cost between the base case (no DG) and the case that DG connected to the distribution system. The results can be summarized by focus-ing on location of DG, the capacity of DG, the size of load, and the distance of load which are factors able to impact to SAIFI, SAIDI, and interruption cost.
Keywords: Reliability; Distributed Generation; Interruption Cost; Distribution System; SAIFI; SAIDI
1. Introduction
Nowadays, the distributed generation (DG) is connected into the distribution system; there are many issues [1-10] that may cause the technical impacts to the distribution system. Reliability is one of problems that are interested based on studies research papers related to this subject. In the literature [1, 2], this paper proposed a method to analyze and evaluate the reliability of the transmission equipment in the electrical system when installing the generator to a distributed system as a case study. The value of the damage (Failure Rates) is calculated in [3-8] which analyzes and compares the reliability of the power system in the different case studies. In the literature [9, 10], the authors use a Monte Carlo Simulation to random the location of generator in distributed system, and then determine the reliability of the power system.
The paper mainly focuses on analyzing and evaluating the reliability in order to improve the reliability of power system but not for analyzing in terms of the interruption cost in case of power failure. This paper studies the im-pact of reliability when a distributed generator (DG) is installed into the distribution system. The system under this study is from Provincial Electricity Authority (PEA)
that is a part of Thailand’s distribution system. DIgSI-LENT power factory is employed to simulate and ana-lyse the SAIFI, SAIDI and interruption cost when dis-tributed generation (DG) is connected to 22kV distribu-tion system.
2. Distribution Reliability Indices
Because of customer satisfaction, the utility of individual customers to get the best service with the least amount of power failure is important. The majority of customer reliability problem is caused by distribution system. Util-ities often monitor the reliability of customers by using a reliability index. Therefore, calculating the reliability index is interesting for their customers. The use of index to indicate the average number of times of the power failure and power outage per year per one customer makes it possible to compare between different systems and can also be targeted. The most common customer reliability indices are:
System Average Interruption Frequency Index (SAIFI)
ASIFI i i i N N
System Average Interruption Duration Index (SAIDI)
SAIDI i i
i U N
N
(2) Interruption Cost
1 1ECOST nh nk k hk h
h k
L C r
(3)where,
i
λ is the failure rate or interruption events
Ni is the number of customers served of node i Ui is the restoration time or customer interruption durations of node i
nk is the total number of load points in the study area nh is the total number of outages that lead to power in-terruption at load point k
Lk is the magnitude of the load curtailed in MW at load point k
rh is duration of the contingency h
Chk is the cost of an outage contingency of duration rh λh is the failure rate of the equipment
3. Power System Simulation using
DIgSILENT
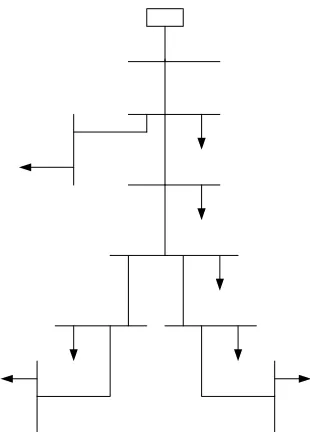
The scheme under investigation is part of Thailand’s electricity distribution system. DIgSILENT powerfactory is employed to simulate and analyse the reliability when distributed generation (DG) is connected to 22 kV dis- tribution systems as shown in Figure 1. Data of geo-
graphic information systems (GIS) including the distance of distribution line and location of load that are parame- ter of PEA are shown in Table 1.
[image:2.595.317.527.111.242.2]Figure 1. A simple radial system with DG connected.
Table 1. The length of transmission line and load in each bus which is connected in distribution system.
Bus Distance (km) Load (MW)
Substation and 1 4.4 0.14
1 and 2 16.6 2.47
1 and 3 13 1.11
2 and 4 28.5 1.35
4 and 5 16.87 1.42
4 and 6 18 0.62
5 and 7 10 0.58
6 and 8 18.52 0.69
From Figure 1, it can be seen that there are 8 buses
from substation (Sub_Chokchai) and load of each bus that is connected between distribution lines. To study the reliability, simulations were performed with various changes as follows:
- A number of distributed generators are no DG and with DG.
- The location of distributed generators are designated on any bus of distribution system and installed between buses of distribution system.
- The capacity of DG is 2 MVA, 4 MVA, 6 MVA, and 8 MVA installed at the distribution system.
4. Impact of DG for Reliability
[image:2.595.96.251.499.718.2]The objective of this paper is to study the impact of reli-ability when distributed generation is connected to dis-tribution system. The impact of DG is divided into 3 in-dices in order to evaluate the reliability of system. The SAIFI, SAIDI and Interruption cost of the base case (no DG) and with DG is compared. The results are shown in
Table 2 and Table 3.
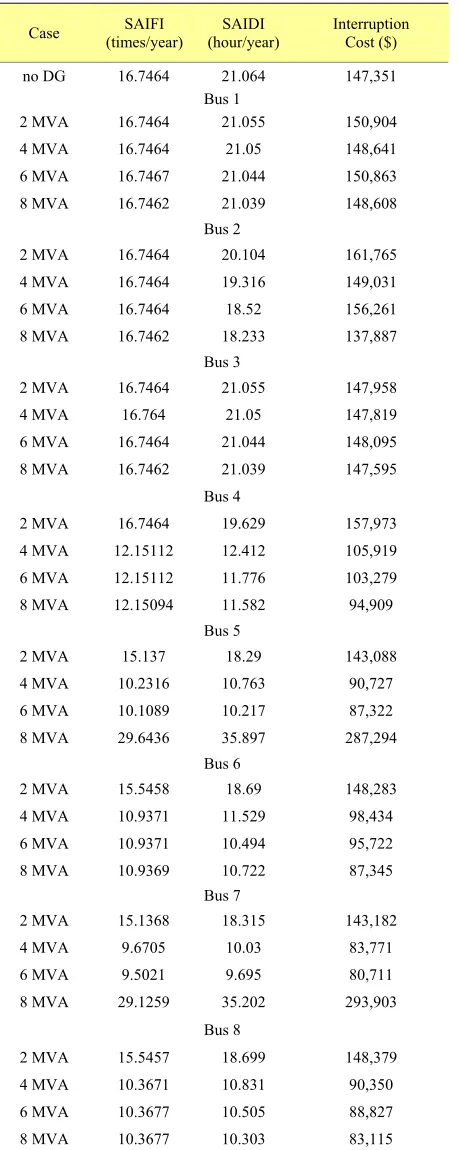
The first index, the SAIFI of base case (no DG) is 16.7464 times/customer/year while the SAIFI of PEA regulation must be changed lower than 17.34 times/cus- tomer/year. So the SAIFI will be compared with DG at each bus as shown in Table 2. The results shown that,
when location of DG is considered by installing at bus 1, 2 and 3, the SAIFI is equal to the case of the base case (no DG). Likewise, when the DG is installed at bus 4, bus 5, bus 6, bus 7, and bus 8, it can be seen that the SAIFI decreases. This indicates that utility has benefit from employing DG.
improved. This also indicates that capacity of DG and location of DG play an important role for reliability in such a system.
Table 2. The reliability index in case of DG installed at any buses of distribution system.
Case (times/year) SAIFI (hour/year) SAIDI Interruption Cost ($)
no DG 16.7464 21.064 147,351 Bus 1
2 MVA 16.7464 21.055 150,904 4 MVA 16.7464 21.05 148,641 6 MVA 16.7467 21.044 150,863 8 MVA 16.7462 21.039 148,608
Bus 2
2 MVA 16.7464 20.104 161,765 4 MVA 16.7464 19.316 149,031 6 MVA 16.7464 18.52 156,261 8 MVA 16.7462 18.233 137,887
Bus 3
2 MVA 16.7464 21.055 147,958 4 MVA 16.764 21.05 147,819 6 MVA 16.7464 21.044 148,095 8 MVA 16.7462 21.039 147,595
Bus 4
2 MVA 16.7464 19.629 157,973 4 MVA 12.15112 12.412 105,919 6 MVA 12.15112 11.776 103,279 8 MVA 12.15094 11.582 94,909
Bus 5
2 MVA 15.137 18.29 143,088 4 MVA 10.2316 10.763 90,727 6 MVA 10.1089 10.217 87,322 8 MVA 29.6436 35.897 287,294
Bus 6
2 MVA 15.5458 18.69 148,283 4 MVA 10.9371 11.529 98,434 6 MVA 10.9371 10.494 95,722 8 MVA 10.9369 10.722 87,345
Bus 7
2 MVA 15.1368 18.315 143,182 4 MVA 9.6705 10.03 83,771 6 MVA 9.5021 9.695 80,711 8 MVA 29.1259 35.202 293,903
Bus 8
[image:3.595.58.543.114.741.2]2 MVA 15.5457 18.699 148,379 4 MVA 10.3671 10.831 90,350 6 MVA 10.3677 10.505 88,827 8 MVA 10.3677 10.303 83,115
Table 3. The reliability index in case of DG that is installed between buses of distribution system.
Case (times/year) SAIFI (hour/year) SAIDI Interruption Cost ($)
no DG 16.7464 21.064 147,351
Bus 1 - Bus 2
2 MVA 16.7464 20.087 163,000
4 MVA 16.7464 19.316 160,038
6 MVA 16.7464 18.545 156,858
8 MVA 16.7462 18.233 138,892
Bus 1 - Bus 3
2 MVA 16.7464 21.055 147,881
4 MVA 16.7464 21.05 147,760
6 MVA 16.7464 21.044 148,122
8 MVA 16.7462 21.039 147,536
Bus 2 - Bus 4
2 MVA 16.7464 21.064 150,918
4 MVA 13.1397 15.377 119,819
6 MVA 12.4914 14.301 112,710
8 MVA 12.1509 13.845 102,520
Bus 4 - Bus 5
2 MVA 16.7464 19.633 158,115
4 MVA 12.1511 12.4 106,089
6 MVA 12.511 11.795 103,250
8 MVA 12.509 11.582 94,909
Bus 4 - Bus 6
2 MVA 15.5458 18.689 148,267
4 MVA 10.9506 11.557 98,669 6 MVA 10.9505 10.95 95,723 8 MVA 10.9504 10.729 87,430
Bus 5 - Bus 7
2 MVA 15.1368 18.301 143,122
4 MVA 10.4714 11.081 92,509 6 MVA 10.0205 10.181 86,285 8 MVA 35.624 44.109 352,909
Bus 6 - Bus 8
2 MVA 15.5458 18.695 148,322
4 MVA 10.937 11.522 98,166
6 MVA 10.8112 10.88 94,342 8 MVA 10.5175 10.413 84,228
The second index, the SAIDI of base case (no DG) is 21.064 hour/customer/year while the SAIDI of PEA reg-ulation must be changed lower than 19.55 hour/cus -tomer/year. Similarly, capacity of DG and location of DG is considered so the behavior of SAIDI is shown in
Table 2. The results show that, when location of DG is
[image:3.595.61.290.158.733.2]same as SAIFI. This indicates that utility has still benefit from employing DG.
The capacity of DG is also considered; it is noticed that when the capacity of DG is increased, SAIDI tends to decrease as same as SAIFI. This also indicates that capacity of DG, location of DG, location of load, and size of load play an important role for reliability.
The third index, the interruption cost of base case (no DG) is 147,351 U.S. Dollar /year. Similarly, capacity of DG and location of DG are also considered; the obtained results for interruption cost are given in Table 2.
The results show that, when capacity of DG and loca-tion of DG is considered by installing at bus 1 to bus 3, the interruption cost is increased and more than the base case (no DG) due that the size of load is large so average hours service availability of customer is decreased and the failure rate of the equipment (λ) in equation 3 will be increased. Likewise, when the DG is installed at bus 4, bus 5, bus 6, bus 7 and bus 8, it can be seen that the in-terruption cost is decreased except for the capacity of DG is less than 2 MVA. This also indicates the slight mis-match between DG capacity and size of load. It is clearly seen for the cases that, when interruption cost is consid-ered and the capacity of DG is 8 MVA which is installed at bus 7 and the size of load is 0.58 MW, the interruption cost is significantly increased.
From Table 3, it can be seen that the reliability index
obtained from the base case as same as case of DG is installed on any bus will be compared with DG that is installed between bus. The first index, the SAIFI of base case (no DG) is still 16.746 times/customer/year and the SAIFI of PEA regulation is also 17.34 times/customer/ year. The results show that, when location of DG is con-sidered by installing between bus 1-bus 2, bus 1-bus 3, the SAIFI is equal to the base case (no DG) and case of DG installed on any bus. Likewise, when the other case of DG in Table 3 is considered, it can be seen that the
SAIFI is decreased and less than the base case but has value nearby the case of DG installed on any bus for the most cases except for the case that the capacity of DG is 8 MW and DG location is between bus5-bus 7 with load of 0.58 MW. This also indicates that capacity of DG, location of DG, location of load, and size of load play an important role for reliability.
The second index, the SAIDI of base case (no DG) is still 21.064 hour/customer/year while the SAIDI of PEA regulation is also 19.55 hour/customer/year. Similarly, capacity of DG and location of DG are considered and the behavior of SAIDI is shown in Table 3. The results
show that, when location of DG is considered and in-stalled at bus 1, 2 and 3, the SAIDI is equal to that of the base case (no DG). Likewise, when the DG is installed at bus 4, bus 5, bus 6, bus 7 and bus 8, it can be seen that the SAIDI is also decreased as same as SAIFI. This
indi-cates that utility has still benefit from employing DG. In addition, when capacity of DG is considered, it is noticed that when the capacity of DG is increased, SAIDI tends to decrease as same as SAIFI.
The third index, the interruption cost of base case (no DG) is still 147,351 U.S. Dollar/year. Similarly, capacity of DG and location of DG are also considered and the obtained results from interruption cost are shown in Ta-ble 3. The results show that, the interruption cost tends to
decrease as same as the case of DG installed at bus. However, when the interruption cost is compared be-tween DG installed at bus and installed bebe-tween buses, it can be seen that the interruption cost of DG installed between buses is lower than that of the DG installed at bus. This also indicates the slight mismatch between DG location and size of load.
5. Conclusions
This paper focuses on the analysis of reliability with the inclusion of DG. The system average interruption fre-quency index (SAIFI), the system average interruption duration index (SAIDI), and interruption cost are as-sessed as index of reliability by comparing the SAIFI, SAIDI, and interruption cost between the base case (no DG) and the case that DG connected to the distribution system. The results can be summarized by focusing on the location of DG, the capacity of DG, the size of load, and the distance of load which are factors able to impact to SAIFI, SAIDI, and interruption cost as shown in Ta-bles 2-3. Both the location of DG and the capacity of DG
must take into account to reach optimal condition in or-der to create the suitability and fairness for both utility and DG.
6. Acknowledgements
The authors wish to gratefully acknowledge financial support for this research from the King Mongkut’s Insti-tute of Technology Ladkrabang Research Fund, Thailand and the energy policy and planning office (EPPO), Min-istry of Energy, Thailand. They would like also to thank for the DIgSILENT presented in this paper which is supported by Provincial Electricity Authority (PEA).
REFERENCES
[1] M. Fotuhi-Firuzabad, “An Analytical Method to Consider DG Impacts on Distribution System Reliability,” IEEE/PES Transmissionand Distribution Conference and Exhibition: Asia and Pacific, 2005, pp. 1-6.
[3] H. Falaghi and M. Haghifam, “Distributed Generation Impacts on Electric Distribution Systems Reliability: Sensitivity Analysis,” The International Conference on
Computer as a Tool (EUROCON), Vol. 2, 2005, pp.
1465-1468.
[4] Y. Yue, K. J. Qian and C. K. Zhou, “The Effect of Dis-tributed Generation on Distribution System Reliability,” 42nd International Universities Power Engineering Con-ference (UPEC), 2007, pp. 911-916.
[5] S. X. Wang, W. Zhao and Y. Y. Chen, “Distribution Sys-tem Reliability Evaluation Considering DG Impacts,” Third International Conference on Electric Utility De-regulation and Restructuring and Power Technologies (DRPT), 6-9 April 2008, pp. 2603-2607.
doi:10.1109/DRPT.2008.4523850
[6] N. Chaiyabut and P. Damrongkulkamjorn, “Impact of Customer Scattering on Distribution System Reliability with Distributed Generation,” IEEE Region 10 Confer-ence (TENCON), 2010, pp. 568-573.
[7] A. C. Neto and M. G. da Silva, “Impact of Distributed Generation on Reliability Evaluation of Radial Distribu-tion Systems Under Network Constraints,” 9th Interna-tional Conference on Probabilistic Methods Applied to Power Systems (PMAPS), 11-15 June 2006, pp. 1-6. doi:10.1109/PMAPS.2006.360421
[8] A. A. Chowdhury, “Reliability Modeling of Distributed Generation in Conventional Distribution Systems Plan-ning and Analysis,” IEEE Transactions on Industry
Ap-plication, Vol. 39, No. 5, 2003, pp. 1493-1498.
doi:10.1109/TIA.2003.816554
[9] In-Su Bae and Jin-O Kim, “Reliability Evaluation of Dis-tributed Generation Based on Operation Mode,” IEEE Transactions on Power Systems, Vol. 22, No. 2, 2007, pp. 785-790.doi:10.1109/TPWRS.2007.894842