i
MULTI-CRITERIA SELECTION FOR LOAD SHEDDING SCHEME USING ANALYTICAL HIERARCHY PROCESS (AHP) IN ELECTRICAL POWER
SYSTEM
NOOR ZAIHAH BINTI JAMAL
A project report submitted in
fulfillment of the requirement for the award of the Degree Master of Electrical Engineering
Faculty of Electrical and Electronic Engineering Universiti Tun Hussein Onn Malaysia
v
ABSTRACT
vi
ABSTRAK
vii
CONTENTS
TITLE i
DECLARATION ii
DEDICATION iii
ACKNOWLEDGEMENT iv
ABSTRACT v
CONTENTS vii
LIST OF TABLES ix
LIST OF FIGURES x
LIST OF SYMBOLS AND ABBREVIATIONS xii
CHAPTER 1 1
1.1 Project background 1
1.2 Problem statements 2
1.3 Project objectives 3
1.4 Project scopes 3
1.5 Thesis overview 4
1.6 Summary 5
CHAPTER 2 6
2.1 Electrical power system in Malaysia 6
2.2 Electrical power outages in Malaysia 8
2.3 Previous method of load shedding 10
viii
2.5 Analytical hierarchy process (AHP) technique in a multiple
criteria situation 13
2.6 Summary 15
CHAPTER 3 16
3.1 Background of the system 16
3.2 Why the system need load shedding 19
3.3 Analytical hierarchy process (AHP) 21
3.4 AHP using microsoft excel software application 29
3.5 Summary 40
CHAPTER 4 42
4.1 TATiUC power system data 42
4.2 Analysis of the result 45
4.3 Discussion 54
CHAPTER 5 56
5.1 Conclusion 56
5.2 Future recommendations 57
LIST OF TABLE
Table 1 : List of equipment for each substation 17
Table 2 : Outgoing load from each substation 18
Table 3 : The alternatives at substation 1 43
Table 4 : The alternatives at substation 2 43
Table 5 : Weight matrix/ priority vector of alternatives for power supply
criteria 47
Table 6 : Weight matrix/ priority of alternatives for operating load criteria 48
x
x
LIST OF FIGURE
Figure 2-1 : National Grid Map of Peninsular Malaysia 7
Figure 2-2 : Power distribution to the consumers. 8
Figure 2-3 : Structure of the hierarchy 15
Figure 2-4 : The example scale for comparison (Saaty & Vargas, 1991). 15 Figure 3-1 : Location of Terengganu Advanced Technical University
College (TATiUC) 16
Figure 3-2 : Electrical System at TATiUC 19
Figure 3-3 : Location of fault occurs. 20
Figure 3-4 : Flow chart of the hierarchy structure 21
Figure 3-5 : Flow Chart of the AHP method 22
Figure 3-6 : Step 1 in AHP 24
Figure 3-7 : Step 2 in AHP 27
Figure 3-8 : Step 3 in AHP 28
Figure 3-9 : Criteria selected 29
Figure 3-10 : Weight for each criteria 30
Figure 3-11 : Product for each row 30
Figure 3-12 : 2nd root product 30
Figure 3-13 : Appropriate weight/ priority vector for each criteria 31
Figure 3-14 : consistency index,CI 32
Figure 3-15 : Value of lambda_max 32
Figure 3-16 : Value of CR 33
Figure 3-17: Selected alternative load to be shed. 34
xi
xi
Figure 3-21 : 7th root product for operating load 36
Figure 3-22 : weight matrix/ priority vector for power supply 36 Figure 3-23 : weight matrix/ priority vector for operating load 37 Figure 3-24 : Consistency index for power supply criteria 38 Figure 3-25 : Consistency index for power operating load 38 Figure 3-26 : Consistency ratio for criteria power supply criteria 39 Figure 3-27 : Consistency ratio for criteria operating load criteria 39
Figure 3-28 : final score for each alternative 40
Figure 4-1 : Terms for the analysis 44
Figure 4-2 : Single line diagram for TATiUC 44
Figure 4-3 : weight matrix or priority vector for the criteria 45
Figure 4-4 : Weight of criteria 45
Figure 4-5 : Pair-wise comparison table matrix (alternatives) for power
supply 46
Figure 4-6: Graph of (alternatives) for power supply 47 Figure 4-7 : Pair-wise comparison table matrix (alternatives) for
operating load 48
Figure 4-8 : Graph of (alternatives) for operating load 49 Figure 4-9 : Relationship between each criteria and the alternatives 50
Figure 4-10 : Final score of each alternatives 51
Figure 4-11 : Graph of final score for each alternatives 52 Figure 4-12 : Graph for percentage of final score for each of the
alternatives 52
Figure 4-13 : Flow chart for load shedding using AHP method for ring
system-1 at TATiUC 53
xii
xii
LIST OF SYMBOLS AND ABBREVIATIONS
AHP Analytical Hierarchy Process
Alt Alternatives
RMU Ring Main Unit
SS Substation
HV High voltage
LV Low voltage
CI Consistency index
RI Random index
CR Consistency ratio
MW Mega-watt
CHAPTER 1
INTRODUCTION
1.1 Project background
2
collapsed. The very short cut way to stop further declining of system frequency is by removing or shedding any load that is non-essential. Load shedding is defined as amount of non-critical load that must be cut-off from the power system network to maintain the operational of the system to the critical load[1]. Lightning strike during a thunderstorm, faults, switching errors, major generation outages are the most common problem which leads to the system tripped[1]. Thereupon, by removing a certain amount of load can ensure the remaining portion of the system continually operational. That remaining portion should be only the most essential and most critical loads in the system. And the substances amount of load to be shed or switched off should be from any non-essential loads available in the same disturbed system. By switching off that non-essential load, the equality between the power supplied and power consumed could be brought back. Hence, the skill to properly differentiate what load to be shed first and so forth is important in achieving an ideal load shedding module. The process of differentiating can be done by ranking them in hierarchy. Therefore in this study, the analysis outcome in interest is to remove loads by ranking them according to their priority. By earning the first rank means that the priority is less as the load shedding module aims is to ensure power continuity to only essential and most critical loads in the system. The module begins with non-essential loads and follows by semi-non-essential loads removal. The non-essential loads can only be removed if the system is disturbed by large disturbances such as major generation outages.
1.2 Problem statements
The main interest of this study is to rank the load in hierarchy according to their priority as the option to assist the system operator to decide which load to be removed or shed first and next during the disturbances to the power system using one of the multi-criteria selection methods called Analytical Hierarchy Process (AHP).
3
of the power supplied and load demand will lead to the system disturbances or collapse. To avoid system from down or collapse, some of the non-essential loads need to be removed from the system instantly. In order to select which load to be removed, the idea of using Analytical Hierarchy Process (AHP) pop-up to ensure the removed load is the least important to the system.
1.3 Project objectives
In order to ensure the developed load shedding scheme is ideal for the selected electrical power system. The objectives of this project are as follows:
a) Implement the multi-criteria selection for load shedding scheme using Analytic Hierarchy Process (AHP).
b) Evaluate the Analytical Hierarchy Process (AHP) performance of load shedding scheme by performing a case study in actual case in Terengganu Advanced Technical University College (TATiUC).
c) Identify the weaknesses and disadvantages of the existing load shedding schemes in that particular area.
1.4 Project scopes
4
a) The system study is carried out to rank load priority for load shedding scheme as one of the protection system for the power system infrastructure at Terengganu Advanced Technical University College (TATiUC).
b) Due to the constraint of the latest load data availability only a portion of data for year 2010 was taken into consideration.
c) For this analysis, only power supplied and load operating demands were taken into consideration.
d) The type of disturbance considered in this analysis was large contingency thermal breakdown in solid dielectric.
1.5 Thesis overview
The report was layout as follows:
Chapter 1 – Introduction
This chapter is briefly an introduction to load shedding and the importance of the load shedding to the power system. The interest of the research is towards Analytical Hierarchy Process (AHP) and salient points which taken into consideration had also clearly stated at the end of the chapter.
Chapter 2 – Literature Review
This chapter discussed on past researches on several load shedding method and why Analytical Hierarchy Process (AHP) is the most suitable method for this study case compared to the others method. It was properly structured for future reference purposes.
Chapter 3 - Methodology
5
and why the system need load shedding in order to ensure the smoothness of the supplied power if any disturbance occurs. Sketches of the system also pasted in this chapter to provide clear introduction to the system studied. Excel Software Application has been used to rank the load by using Analytical Hierarchy Process method according to their weighted average ratings and the results gained can be a reference to the operator in-charge to perform load shedding execution.
Chapter 4 – Result, Analysis & Discussion
The findings of the research were discussed and presented in graphs, pie charts and tabulated data in this chapter 4. The analysis of the results is also being discussed in this chapter for each criteria and alternative selected. And why the findings decision should be that way as the best load shedding scheme to the system approached.
Chapter 5 –Conclusion and Recommendation Works
The final parts of the report discussed and concluded the importance of the finding which definitely is very helpful as a guide to the person in charge for better protection for the power system network during major contingencies. It also focused on the future proposal to improve the findings as the system may change due to the surrounding needs.
1.6 Summary
CHAPTER 2
LITERATUR REVIEW
2.1 Electrical power system in Malaysia
Malaysia is currently gearing up towards transparent and efficient electricity supply industry. In 1990s, the Malaysian government has introduced the independent power producer (IPP) and privatization of the national utility as parts of the effort to ensure the supply to be more responsive to the needs of the people and keeping the price to be affordable. Main power producer in Malaysia are Tenaga Nasional Berhad (TNB), Co-Generator such as Petronas Gas Sdn Bhd, Independent Power Producer (IPP) such as YTL Generation Sdn. Bhd., Malakoff Berhad, Genting Sanyen Power Sdn Bhd which generated electricity and sell them to TNB, Sarawak Electricity Supply Corporation (SESCO) which responsible for the generation, transmission and distribution of electricity in Sarawak and Sabah Electricity Sdn Bhd (SESB) which providing reliable generation, transmission and distribution services in the state of Sabah and the Federal Territory Labuan.
7
[image:16.612.177.477.197.606.2]Perlis), Central Area (Selangor, Federal Territory of Kuala Lumpur and Putrajaya), Eastern Area (Pahang, Terengganu and Kelantan), Southern Area (Johor, Melaka and Negeri Sembilan) which can be shown in the diagram below. The major load centers are in the West Coast where majority of thermal power plants are located. Presently, Bukit Tarek and Lenggeng are the main network gateway for power transfer from Northern and Southern regions to the major load center.
Figure 2-1 : National Grid Map of Peninsular Malaysia
8
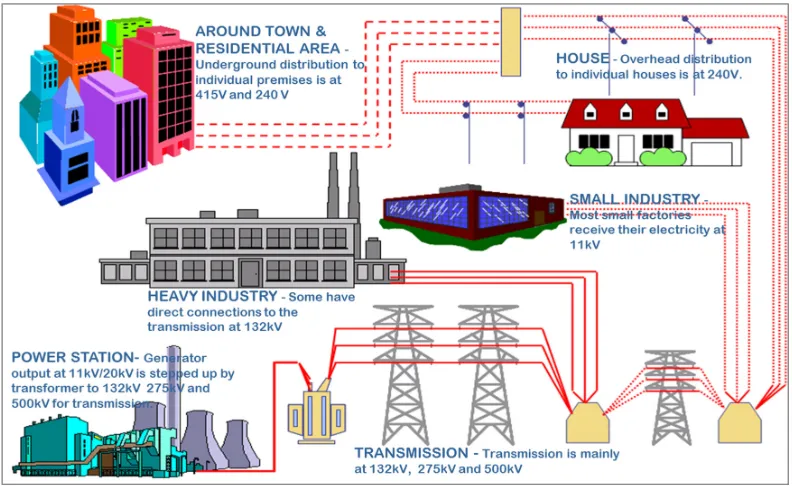
[image:17.612.133.529.163.406.2]the factories received 11kV electricity from the substation to be stepped down with their own built infrastructure for more power reliability. The electricity will be stepped down via transformer to 0.415kV and 0.240V for small factories, individual houses and residential premises.
Figure 2-2 : Power distribution to the consumers.
2.2 Electrical power outages event in Malaysia
Malaysia has experienced several tripped event at the main transmission lines which resulted to the major power outages to the affected area.
9
load shedding scheme. Secondly, construct the alternative route of 275kV transmission line from Paka, Terengganu to Tanah Merah, Kelantan in 1986, for dispatching power to the grid from major plants in Paka and Kenyir, Terengganu. Thirdly, provide power security to Port Klang power plant to avoid major loss.
ii. In July 1992, Lightning during thunderstorm had strike a grid comprising four power lines between Paka and Teluk Kalong in Terengganu which caused massive power failure in the peninsular Malaysia, 15 power station on the west coast were put out of action. The grid is one of the two network supplying power to the west coast and due to this failure affected the Paka power station. The power blackout for almost ten hours in the most affected states. The post actioned to the power failure have been identified which TNB to erect an alternative transmission line between Terengganu and the south of the peninsular, TNB to improve its protection system in the power transmission system and that TNB should allocate 30% spare capacity at any one time in its power generation system. At this time, there is only 10%. TNB to provide portable power stations in densely populated areas to ensure supply will not be cut-out.
iii. In August 1996, a transmission line near Paka Power tripped causing all power stations in Peninsular Malaysia to collapse resulting in a massive power failure. The cascading effect of the trip shut down supply in sequence at all power stations. The post actioned to the outages are TNB recommended that dependence on power generated from these stations be reduced to lower the risk of major system failure and TNB was expected to spend between RM50mil to RM100mil per year in the next five years to improve reliability and security of nation’s electricity distribution.
From the power outages happened, one of the solutions to control the huge losses to the industry affected is by having load shedding scheme and the scheme must be effective to ensure the smoothness of the operation during the trip.
10 2.3 Previous method of load shedding
This section review on the numbers of conventional method used for load shedding scheme which most famous among the industrial facility.
2.2.1 Breaker Interlock Scheme[1]
This is the simplest method of carrying out load shedding. For example a source breaker would be interlocked via hardwired or remote signals to a set of load breakers that have been pre-selected to trip. When a generator breaker or a grid connection is lost for any reason, signals are automatically sent to load breakers to open. This system is very fast since there is no processing required and all decisions about the amount of load to be shed were made long before the fault occurred.
2.2.2 Under Frequency Relay Scheme. [1]
Frequency relays do not detect disturbances but react to the disturbances. They detect either a rapid change in frequency or gradual frequency deterioration and initiate staged operation of interlocked breakers. When the first stage is reached, the relay waits a predetermined amount of time, to avoid nuisance tripping, and then trips one or more load breakers. This is done to allow the frequency to recover. If the frequency continues to decay, the relay will wait for the next stage to be reached and after an additional time delay, opens other load breakers.
2.2.3 Programmable Logic Controller-Based Load Shedding. [1]
11
power management systems were combined with microprocessor based PLCs that distributed fast load shedding systems became a reality. With a common type of PLC-based load shedding scheme, load shedding is initiated based on the system frequency deviations and/or other triggers. The circuit breaker tripping can be programmed based on the system loading, available generation, and other specific logics. Each subsystem is equipped with a PLC that is programmed to shed a preset sequence of loads. This static sequence is continued until the frequency returns to a normal condition. Modification of the logic requires changing of the latter-logics that are programmed in the PLCs.
12
2.4 Why analytical hierarchy process (AHP) is selected
During the literature review stages, several method have been taken into consideration and finally the AHP method has been selected due to the below reasons:
i) For Breaker Interlock scheme, the exact amount of the load consumed during that fault maybe differ due to extension work to the system or etc. So the scheme is no longer reliable to the system.
ii) Under Frequency Relay scheme, the well managed coordination between relay breakers upstream and downstream is needed. If the relay coordination system is not well coordinated to ensure any disturbance happened to the downstream system will not trip the upstream relay breakers, this situation will cause huge losses to the industries and affected the daily routine of the un-effected area. This situation will happen if any upgrading work performed to the system but the relay coordination did not re-coordinate well because to perform this job, the consumer need to hire specialist in that field to perform the study and calculation which cost huge amount of money.
13
In other way, AHP method is better in terms of cost and time incurred. Rather than selected ‘correct’ decision, the AHP helps decision makers to find one that best suits their objective and their understanding of the problem.
In making the comparisons, the decision makers can use concrete data about the elements, but they typically use their judgments about the elements' relative meaning and importance. It is the essence of the AHP that human judgments, and not just the underlying information, can be used in performing the evaluations. [2], [10]
2.5 Analytical hierarchy process (AHP) technique in a multiple criteria situation
14
The AHP converts these evaluations to numerical values that can be processed and compared over the entire range of the problem. A numerical weight or priority is derived for each element of the hierarchy, allowing diverse and often incommensurable elements to be compared to one another in a rational and consistent way. This capability distinguishes the AHP from other decision making techniques. In the final step of the process, numerical priorities are calculated for each of the decision alternatives. These numbers represent the alternatives' relative ability to achieve the decision goal, so they allow a straightforward consideration of the various courses of action. [2],[10].
The basic procedures of AHP as follows: [9]
a) Develop the weights for the criteria by
• developing a pairwise comparison matrix for each criterion
• normalizing the resulting matrix
• averaging the values in each row to get the corresponding rating
• calculating and checking the consistency ratio
b) Develop the ratings for each decision alternative for each criterion by
• developing a pair wise comparison matrix for each criterion
• normalizing the resulting matrix
• averaging the values in each row to get the corresponding rating
• calculating and checking the consistency ratio
15
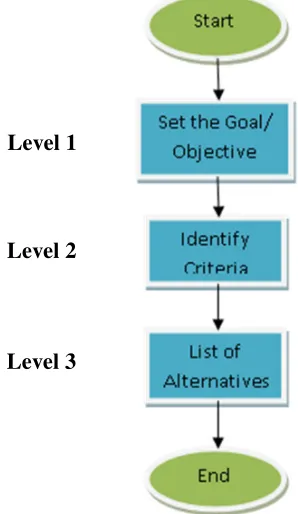
Figure 2-3 : Structure of the hierarchy
Level-1: The goal of the analysis.
Level-2: The multi-criteria that consist of several criterions, you can also add several other levels of sub-criteria.
Level-3: The last level is the alternative choices
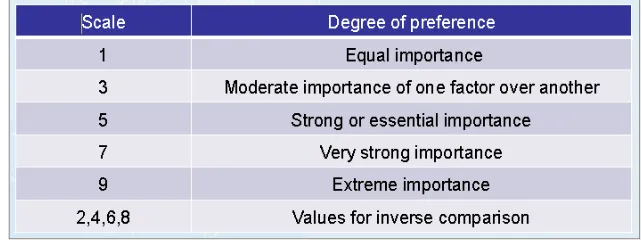
Figure 2-4 : The example scale for comparison (Saaty & Vargas, 1991).
2.6 Summary
[image:24.612.164.485.370.490.2]CHAPTER 3
METHODOLOGY
[image:25.612.212.439.332.654.2]3.1 Background of the system
17
Terengganu Advanced Technical University College (TATiUC) is an educational institution which have been developed on June 1993 (formerly known as Terengganu Advanced Technical Institute (TATI) and have been upgraded as University College end of 2007) . TATiUC is located under district of Kemaman, Terengganu and 30km from the Kerteh oil and gas industry. This education institute is developed to fullfill the higher scale of education on technical based.
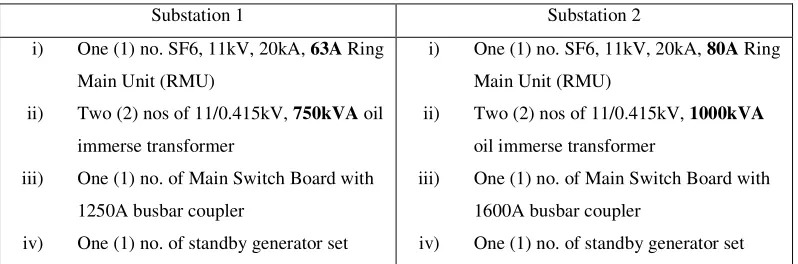
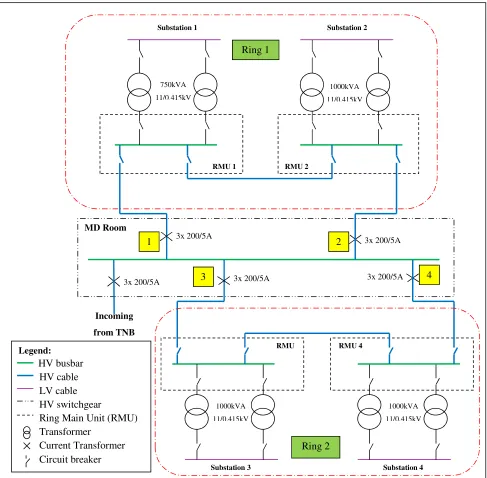
During the early years, the electrical infrastructure at TATiUC was fed by TNB via single 11kV 200/5A incoming to a 11kV consumer switchgear room (known as MD Room) to substation 1 (SS1). The Substation 1 have been installed with one (1) no. of SF6, 11kV, 20kA, 63A Ring Main Unit (RMU), two (2) nos of 11/0.415kV, 750kVA oil immerse transformer, one (1) no. of Main Switch Board with 1250A busbar coupler and one (1) no. of standby generator set to accommodate power supply to Bangunan Pentadbiran 1, Bangunan Asrama Fasa 1, Bangunan Akademik 1 and Kafeteria 1.
On the middle of 2001, TATiUC have upgraded the electrical infrastructure with additional Substation 2 (SS2) which have been installed with one (1) no. of SF6, 11kV, 20kA, 80A Ring Main Unit (RMU), two (2) nos of 11/0.415kV, 1000kVA oil immerse transformer, one (1) no. of Main Switch Board with 1600A busbar coupler and one (1) no. of standby generator set. This Substation 2 have been fed via second outgoing feeder and both Substation (SS1 & SS2) have been interconnected through high voltage power cable to be a one ring system. The equipments installed at each substation is summarize in a table below:
Substation 1 Substation 2
i) One (1) no. SF6, 11kV, 20kA, 63A Ring
Main Unit (RMU)
ii) Two (2) nos of 11/0.415kV, 750kVA oil
immerse transformer
iii) One (1) no. of Main Switch Board with
1250A busbar coupler
iv) One (1) no. of standby generator set
i) One (1) no. SF6, 11kV, 20kA, 80A Ring
Main Unit (RMU)
ii) Two (2) nos of 11/0.415kV, 1000kVA
oil immerse transformer
iii) One (1) no. of Main Switch Board with
1600A busbar coupler
[image:26.612.128.527.515.647.2]iv) One (1) no. of standby generator set
Table 1 : List of equipment for each substation
18
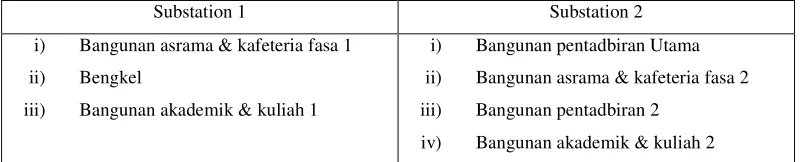
Some of the load need to be fed through new substation to accommodate the building extention such as Bangunan Pentadbiran which previously fed from Substation 1 but need to be re-routed to Substation 2 to cater the extention of Bangunan akademik 1 with additional Bengkel and Bilik Kuliah. The summarize of outgoing load from the substations is as follow:
Substation 1 Substation 2
i) Bangunan asrama & kafeteria fasa 1
ii) Bengkel
iii) Bangunan akademik & kuliah 1
i) Bangunan pentadbiran Utama
ii) Bangunan asrama & kafeteria fasa 2
iii) Bangunan pentadbiran 2
[image:27.612.127.527.186.267.2]iv) Bangunan akademik & kuliah 2
Table 2 : Outgoing load from each substation
On 2007 TATiUC have been honoured from Technical Institute to Technical University College, to accommodate the increased of intake students, development at the TATiUC had rapidly increased. So the infrastructure of the electrical system need to be revised and upgraded. Since the existing substation had fully occupied, TATiUC had appointed external consultant to re-consider on the power system infrastructure. After several meetings and discussions with the TATiUC and consultants for each project package, the appointed infrastruture consultant during that time had came out with better planning. The existing system is maintained with some modification on the cable route and additional two (2) substation (Substation 3 & Substation 4) were developed as another one ring system. To save the cost incurred in this project during that time, TATiUC has agreed to maintain the existing ring so the system is having two (2) different ring system. Any additional load in future as refers to the master plan development will need additional substation. The system is as follows figure 3.2,
19
Figure 3-2 : Electrical System at TATiUC
3.2 Why the system need load shedding
In 2008, due to the thermal breakdown in underground HV power cable from MD Room to Substation 2 (the fault is as ilustrated in figure below). This situation had lead to the major shutdown at outgoing feeder 2 to perform cable jointing within 24
Substation 1 Substation 2
Substation 3 Substation 4
Legend:
HV busbar HV cable LV cable HV switchgear
Ring Main Unit (RMU) Transformer Current Transformer Circuit breaker Incoming from TNB 3x 200/5A
3x 200/5A 3x 200/5A
3x 200/5A
3x 200/5A
RMU 1 RMU 2
RMU RMU 4
MD Room 750kVA 11/0.415kV 1000kVA 11/0.415kV 1000kVA 11/0.415kV 1000kVA 11/0.415kV
1 2
3 4
Ring 1
20
[image:29.612.82.572.93.584.2]hours. During this period, some of the load have to be disconnected and only selected load is feeding by the ring system 1.
Figure 3-3 : Location of fault occurs.
During this situation, load to be disconnected is selected manually by the person incharge without any proper guideline. So, the Analytical Hirerchy Process (AHP) is the suitable method of doing selection during major similar shutdown in future as a reference to guide the person incharge.
Legend:
HV busbar HV cable LV cable HV switchgear
Ring Main Unit (RMU) Transformer Current Transformer Circuit breaker Incoming from TNB 3x 200/5A
3x 200/5A 3x 200/5A
3x 200/5A
3x 200/5A
RMU 1 RMU 2
RMU RMU 4
MD Room 750kVA 11/0.415kV 1000kVA 11/0.415kV 1000kVA 11/0.415kV 1000kVA 11/0.415kV
1 2
3 4
Ring 1
Ring 2
21 3.3 Analytical hierarchy process (AHP)
Analytical Hierarchy Process (AHP) was developed by Professor Thomas L. Saaty in the 1970s and has been extensively studied and refined since then [19]. It is a method for solving complex decision making based on the alternatives and multiple criteria, as it names stated. It is also a process for developing a numerical score to rank each decision alternative based on how well each alternative meets the decision maker’s criteria.
Nowadays, there are many versions of AHP existed. Originally, AHP was designed to calculate the nth root of the product of the pair-wise comparison values in each row of the matrices and then normalizes the aforementioned nth root of products to get the corresponding weights [19]. Meanwhile the modified AHP version normalizes the pair-wise comparison values within each of the matrices and then averages the values in each row to get the corresponding weights and ratings [19].
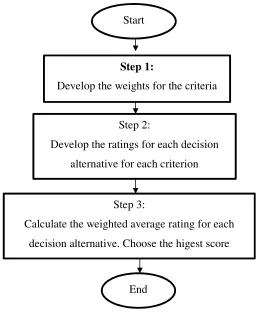
[image:30.612.217.366.442.699.2]However both versions give almost the same results. For this research, the original method has been chosen to be implemented as the Multi Criteria Decision Making. Generally process of AHP analysis can be shown in three main steps.
Figure 3-4 : Flow chart of the hierarchy structure Level 1
Level 2
22
Figure 3-5 : Flow Chart of the AHP method
Step 1: Develop the weights for the criteria: [3],[8],[9]
a) First, develop a single pair-wise comparison matrix for the criteria as shown in the equation below:
where, C1, C2, …,Cn representing the criteria, aij represents the rating of Ci with respect to Cj
b) Then, multiply the values in each row together and calculates the nth root of the said product as shown in the equation below:
Step 1:
Develop the weights for the criteria Start
Step 2:
Develop the ratings for each decision alternative for each criterion
Step 3:
Calculate the weighted average rating for each decision alternative. Choose the higest score
23
c) After that, normalizing the aforementioned nth root of products to get the appropriate weights by using the formula given in equation 3.3:
d) Lastly, perform the Consistency Ratio (CR) by using the formula as shown below:
[image:32.612.152.505.425.462.2]The value of Random index (RI) can be found using Table 3.1 where Random Index (RI) is a constant and it is a standard for AHP analysis.
Table 3.3: Table of Random index (Saaty, 1980)
n 1 2 3 4 5 6 7 8 9
RI 0 0 0.58 0.9 1.12 1.24 1.32 1.41 1.45
*Note: Value of C.R must be less than the allowable value of 0.10. Therefore, the consistency of the judgment matrix should be within an acceptable tolerance. But if the consistency ratio is greater than 0.10 then the subjective judgment needs to be revised.
While the value for Consistency Index (CI) can be found by using this equation:
24
[image:33.612.153.520.125.703.2]where: Σcolumn is the summation of pair-wise values of each alternative vertically and n is a positive integer number.
Figure 3-6 : Step 1 in AHP Start
Develop a single pair-wise comparison matrix for the criteria
Multiply the values in each row together and calculates the nth root of the said product
Normalizing the aforementioned nth root of products to get the
appropriate weights
Calculate and checking the consistency ratio
Consistency ratio <0.1
Finalized the weight for the criteria
End Adjust the pair
58 REFERENCES
[1] Shokooh, F., Dai, J. J., Shokkoh, S., Tastet, J., Castro, H., Khandelwal, T. & Donner, G.. An Intelligent Load Shedding (ILS) System Application in a Large Industrial Facility. Industry Applications Conf, 2005. Fourtieth IAS Annual Meeting Conf. Record of the 2005, 1. 2005. pp. 417 - 425.
[2] R. K. Rietz, S. Suryanarayanan. A Review of the Application of Analytic Hierarchy Process to the Planning and Operation of Electric Power Microgrids. Power Symposium, 2008. NAPS '08. 40th North American, 28-30 Sept. 2008.
[3] H.H.Goh, B.C.Kok. Application of Analytic Hierarchy Process (AHP) in
Load Shedding Scheme for Electrical Power System. Environment and
Electrical Engineering (EEEIC), 2010 9th International Conference on
16-19 May 2010.
[4] A.A. Mohd Zin, H. Mohd Hafiz, M.S. Aziz. A Review of Under-frequency Load Shedding Scheme on TNB System. National Power & Energy Conference (PECon) 2004 Proceedings, Kuala Lumpur, Malaysia.
[5]` Hak-Man Kim, Tetsuo Kinoshita, Yujin Lim. Talmudic Approach to Load Shedding of Islanded Microgrid Operation Based on Multiagent System. Journal of Electrical Engineering & Technology Vol. 6, No. 2, pp.
284~292, 2011 DOI: 10.5370/JEET.2011.6.2.284
[6] Faizah Husain, Nur Aishah Sulaiman, Khairil Afendy Hashim, Abd. Manan Samad. Multi-Criteria Selection for TNB Transmission Line Route Using AHP and GIS. 2012 International Conference on System Engineering and Technology September 11-12, 2012, Bandung, Indonesia
59
[8] Kunz, J.. The Analytical Hierarchy Process (AHP). Eagle City Hall Location Options Task Force. February/March 2010.
[9] Thomas L. Saaty. Decision making with the analytic hierarchy process. Int. J. Services Sciences, Vol. 1, No. 1, 2008
[10] http://en.wikipedia.org/wiki/Analytic_hierarchy_process. [11]
http://www.copper.org/environment/sustainable-energy/transformers/education/energy_star.html
[12] IEC 60354: Loading guide to oil immerse power transformer [13] IEC 60076-1: Power transformer part 1: General
[14] IEC 60076-8: Power transformer application guideline
[14] JKR Standard, LS12: Specification for 11kV High Voltage Ring Main Unit distribution switchgear.