Journal of Chemical and Pharmaceutical Research, 2014, 6(2):635-648
Research Article
CODEN(USA) : JCPRC5
ISSN : 0975-7384
Effect of polymer diluent ratio on physicochemical properties of matrix
tablets of aceclofenac sodium for oral controlled drug delivery
Manjanna K. M.*
1,
Rajesh K. S.
2and Pramod Kumar T. M.
31Department of Pharmaceutics, T. V. M. College of Pharmacy, Bellary,Rajiv Gandhi University of Health Sciences,
Bangalore, Karnataka, India
2Department of Pharmaceutics, Parul Institute of Pharmacy, Limda, Gujarat, India
3Department of Pharmaceutics, J. S. S. College of Pharmacy, J. S. S. University, Mysore, Karnataka, India
_____________________________________________________________________________________________
ABSTRACT
Aceclofenac sodium a novel NSAID used in the treatment of rheumatoid arthritis, frequency of administration may cause certain GI-adverse effects. The purpose of the present research work was to develop sustained release matrix tablets of aceclofenac sodium by wet granulation technique using different concentrations of locust bean gum (LBG) and hydroxyl propyl methyl cellulose (HPMC-K15M) as drug release controlling polymer matrices and different concentration of Pharmatose 200M as diluent. The solubility studies of aceclofenac were conducted to select suitable dissolution media. The drug excipients mixtures were subjected to preformulation by FTIR, DSC and XRPD studies. The different in-process and finished product quality controlled tests of the formulations were evaluated. In-vitro drug release potential was estimated in simulated gastric fluid pH1.2 for initial 2h and simulated intestinal fluid pH 7.4 at the end 12h studies. While increasing the concentration of polymer diluent ratio significantly affects physicochemical properties of tablets and found within the limits. The release of drug from the tablets in pH1.2 is negligible. Under neutral conditions the tablets will swell and the release of drug in a sustained manner, exhibited Higuchi model kinetics followed toKorsemeyer and Peppas kineticsand shown the diffusion co-efficient (n) values in the range of 0.5810 to 1.185. This indicates, the drug release from matrix tablets by both diffusion and erosion mechanisms followed by super case-II transport. The entire process is feasible in an laboratory scale and demands pilot study
Key words: Aceclofenac sodium, Controlled drug release, Matrix tablets, Higuchi matrix kinetics, Zero-order kinetics.
_____________________________________________________________________________________________
INTRODUCTION
Aceclofenac sodium is non-steroidal anti-inflammatory drug used extensively in the treatment of rheumatoid arthritis, osteoarthritis and ankylosing spondylitis. It is rapidly and completely absorbed after oral administration, high bound plasma protein, peak plasma concentrations are reached 1 to 3h. The biological half-life of the drug is 1.8 – 3.5 h and dosing frequency 2-3 times daily with dose range 100 - 200mg [1]. Due to its short biological half-life requires multiple oral dosing to maintain the plasma drug concentration constantly during the entire period of therapy. It leads to fluctuation in the drug blood levels and dose related adverse effects like abdominal pain, gastritis, constipation, etc. The oral multiple dosing also fails to release the drug at the desired rate and in the desired amount which often results in poor patient compliance and inefficient therapy [2].
release of the drug from the tablets by dissolution controlled as well as diffusion/erosion controlled mechanisms [4]. The drug release is controlled by adding the active drug into swellable hydrophilic or insoluble non-swellable matrix materials.
The hydroxyl propyl methyl cellulose (HPMC) and Locust bean gum (LBG) are hydrophilic swellable polymers used as coating agents, stabilizing agents, tablet binders, viscosity modifiers and suspending agents in various pharmaceutical products [5]. These are also commonly used to design of certain novel drug delivery products either oral or per-oral route of administration. The hydrophilic polymers have been widely used as drug release modifiers in several sustained / controlled drug delivery systems of their advantageous properties over synthetic polymers such as biocompatibility, biodegradability, ability to modify the properties of aqueous environment capacity to thicken, emulsify, stabilize, encapsulate, swell and to form gels [6]. The hydrophilic polymers generally known as hydrogels respond in to surrounding conditions such as pH, ionic strength, and temperature of the medium, the polymer hydrate in water forming a gel layer at the matrix periphery which controls the release of drug from the formulated system. The pH-sensitivity of hydrogels is an important factor in designing for controlled drug delivery systems for water insoluble drugs having pH sensitivity in the GI-tract [7]. Generally, most of the oral sustained release tablets are enter into the GI-tract and the fluid slowly penetrate through the outer layer of polymer matrix system which induces the dissolution, swelling and formation of thick hydrodynamic layer. Further, drug moves from a higher concentration region of the biological membrane to lower concentration side. The concentration gradient will developed, which acts as the driving force to activate the diffusion of drug out of the system. The inside of the system should have lower water content initially than the surrounding medium to control the diffusion of a drug effectively in a sustained manner, finally, the diffused drug partition between the body fluid and plasma enters into systemic circulation [8].
The aim of the present study, which was to develop oral products namely matrix tablets of aceclofenac sodium were prepared by wet granulation techniques by using locust bean gum [LBG], hydroxyl propyl methylcellulose (HPMCK15M), as release retardants, Pharmatose 200M as diluent and Polyplasdone XL as disintegrant. The effects of polymer and diluent ratio on the certain preliminary characterizations of tablets such as hardness, average weight, percentage of weight variation, percentage friability, and percentage of drug content, swelling ratio and in-vitro drug release potential were evaluated according to pharmacopeias methods.
EXPERIMENTAL SECTION
Materials:
Aceclofenac sodium was obtained as a gift sample from Microlabs Bengaluru, Karnataka. India. Locust bean LBG was gum gift sample from LBG- Sicilia Natural gums, Ragusa-Italy.HPMC-Methocel K15M was gift sample from Colorcon Asia Private Ltd.Goa. Pharmatose200M (Lactose monohydrate) was gift sample from DMV-Fonterra, Netherland. Plasdone29/32 and PolyplasdoneXL were gift samples from ISP Singapore PTE Ltd., Singapore. Magnesium stearate and Purified talc were purchased from Loba chemicals Mumbai. All other reagents and solvents used were of analytical grade satisfying pharmacopoeias specifications.
PREFORMULATION STUDIES FT-IR Spectroscopic Analysis;
Drug polymer interactions were studied by FT-IR spectroscopy. Two milligrams of aceclofenac sodium alone, mixture of drug and polymer were weighed and mixed properly with potassium bromide uniformly. A small quantity of the powder was compressed into a thin semitransparent pellet by applying pressure. The IR- spectrum of the pellet from 450-4000cm-1 was recorded taking air as the reference and compared to study any interference.
Differential Scanning Calorimetry (DSC)
Differential scanning calorimetry (DSC) was performed using DSC-60 (Shimadzu, Tokyo, Japan) calorimeter to study the thermal behaviors of drug alone and mixture of drug and polymer. The instrument comprised of calorimeter (DSC-60), flow controller (FCL-60), thermal analyzer (TA-60) and operating software (TA-60). The samples were heated in sealed aluminum pans under nitrogen flow (80ml/min) at a scanning rate of 10 0 C/min from 25 to 450°C. Empty aluminum pan was used as reference. The heat flow as a function of temperature was measured for the drug and drug -polymer mixture.
X-Ray Powder Diffractometry (XPRD)
______________________________________________________________________________
Preparation of aceclofenac sodium matrix tablets
Ten batches of aceclofenac sodium matrix tablets were prepared corresponding to various drugs to polymer ratio by wet granulation technique. All the ingredients were passed through sieve No.60 mesh ASTM prior to weighing. Required quantities of drug, polymer, diluent and disintegrant were mixed thoroughly in a mortar and added sufficient volume of granulating solution (Plasdone K29/32 in isopropyl alcohol). The wet mass was passed through sieve No.16 and the granules were dried at 50°C for 30 minutes. The dried granules were passed through sieve No’s 22/44. The granules retained on sieve No. 44 meshes were mixed with 15% of fines (granules that passed through sieve No. 44). The required quantities of talc and magnesium stearate were finally added as glidant and lubricant. Based on theoretical weight of each tablet, the filling capacity of the lower punch was adjusted and the tablets compressed into 500 mg weight by using a single-punch tablet compression machine (Cadmach, Ahmedabad, India) at 6-7 kg/cm2 hardness. Table 1 summarizes the batch details of aceclofenac sodium matrix tablets.
Table.1. Batch details for the formulation of aceclofenac sodium matrix tablets
Ingredients Batch Code
AF-1 AF-2 AF-3 AF-4 AF-5 AF-6 AF-7 AF-8 AF-9 AF-10 Aceclofenac 200 200 200 200 200 200 200 200 200 200
LBG 25 50 100 150 200 - - - -
HPMC K15M - - - 25 50 100 150 200 Pharmatose 200M 225 200 150 100 50 225 200 150 100 50 Plasdone K29/32 10 10 10 10 10 10 10 10 10 10 Polyplasdone XL 10 10 10 10 10 10 10 10 10 10 Mag. stearate 15 15 15 15 15 15 15 15 15 15 Purified talc 15 15 15 15 15 15 15 15 15 15
Theoretical weight of each tablets = 500 mg
PHYSICOCHEMICAL EVALUTION OF MATRIX TABLETS Micromeritic properties of granules
The flow characteristics of the different batches formulated granules were measured by determining their angle of repose using fixed-base cone method. A glass funnel was secured with its tip positioned at a fixed height (H) above graph paper placed on a horizontal surface. The sample was poured through the funnel until the apex of the conical pile touched to the tip of the funnel. The height and radius of the heap was measured [9]. The experiment was repeated in triplicate, the angle of repose (tan θ) was calculated using the formula;
Angle of repose[θ] =tan -1(h/r)
H = cone height, r = radius of circular base formed by the granules on the ground.
The bulk and tapped densities of the formulated granules were evaluated by using the bulk density apparatus. Known weights of formulated granules were transferred into a 50cc graduated measuring cylinder. The cylinder was fixed on bulk density apparatus and the timer knob was set for 100 tapings. Then, the initial bulk volume and final volume after 50 tapings were noted. The experiment was repeated in triplicate [10]. The respective densities of different batches of granules were calculated by using the following formulas;
Mass of the sample (g) Bulk density [gm /cc] = --- Bulk volume (ml)
Mass of the sample Tapped density [gm/cc] = --- True volume
Compressibility index or Carr’s index value of formulated granules was computed according to the following equation;
Tapped density-Bulk density
Hausner’s ratio of granular powder was determined by comparing the tapped density to the bulk density by using the equation;
Tapped density Hausner’s ratio = --- Bulk density
Weight variation, Hardness and Friability
The uniformity of weights of tablets was determined according to the method mentioned in Indian pharmacopeia [11]. Weighed 10 tablets individually in an electronic balance and their average weight were determined. The standard deviation was calculated using the following formula;
Average weight (gm) = Total weight of the tablets /10
Standard deviation (%) = ( Iw – Aw / Aw) x 100
[Where, Iw = Individual weight of the tablets, Aw = Average weight of the tablets]
For each formulation, the hardness of 10 randomly selected matrix tablets was examined using a Pfizer hardness tester (A-101 Secor India). The tablet hardness or crushing strength was measured in kg/cm2.
The percentage of friability was evaluated by using Roche friabilator (USP EF-2 Electro Lab). Ten or twenty tablets from each batch were weighed and placed in the plastic chamber. The chamber rotated for 4 minutes or 100 revolutions. During each revolution the tablets falls from a distance of 6 inches after 100 revolutions and were removed from the chamber and reweighed [12]. The percentage of weight loss or friability was determined by the following formula;
Friability (%) = Loss in weight of tablets / Initial weight x 100
Swelling behavior of tablets
The swelling ratio of three matrix tablets from each formulation was determined. The three matrix tablets were each weighed and placed in a glass beaker containing 500 ml of phosphate buffer at pH 6.8 ± 0.1 at 37 °C with continuous stirring at 50 rpm. After 0.5, 2, 4 and 6 hours’ time period intervals the tablet was removed and blotted with tissue paper. The tablet was weighed on a digital balance (GE-412 Sartorius) and the final weight of the tablet was noted after prescribed time. The experiment was performed in triplicate for each time point and fresh samples were used for each individual time point [13]. The extent of swelling was measured in terms of percentage weight gain by the tablet was calculated by the following formula;
Swelling index (S.I) = [(Mt-Mo) / Mo] X 100
[Where, Mt = weight of tablet at time =t and Mo = weight of tablet at time t=0]
Drug content uniformity
Five tablets of each batch were weighed and powdered. The quantity of the powder equivalent to 200 mg of aceclofenac sodium was suspended in 100 ml of phosphate buffer containing 10 ml of methanol. The resulting solution was transferred into a stoppered conical flask and the flask was shaken for a period of 12 hours by using a mechanical shaker at room temperature. Next day it was stirred for 15 minutes. The solution was filtered, after suitable dilution; the drug content in the filtrate was analyzed at λ max 275 nm using UV-Visible spectrophotometer (Shimadzu 1201) [14]. The obtained absorbance was plotted on the standard curve to get the exact concentration of the entrapped drug. Each experiment was carried out in triplicate (n=3). The actual drug content was determined by using the following relationship;
(k x Absorbance ±B) x bath volume x dilution factor Drug content =
1000
In-vitro drug release studies
______________________________________________________________________________
medium of pH 1.2 containing 2% w/v sodium lauryl sulfate was used for initial 2 hours and continued the test by changing the dissolution media pH 7.4 phosphate buffers up to the end of 12 hours and maintained temperature 370C. Samples (5ml) were withdrawn at different time intervals over a period of 12 hours. After each sampling, equal volume of the medium was replaced with same volume of fresh medium. The sample was filtered through 0.45µ membrane filter and diluted with appropriate dilution with respective medium. Then estimate the aceclofenac sodium concentration in the solution by using UV-Visible spectrophotometry (Shimadzu 1201, Japan) measured at λ
max 275 nm [15, 16]. The absorbance of the samples was measured at different time intervals and the concentration, amount of drug released and the percentage of drug release were calculated using the following formulas;
Concentration (µg/ml) = Slope X Absorbance ± Intercept
C x VD x DF Drug released = ---X 100 1000
Where; C= Concentration (µg/ml), VD= volume of dissolution media, DF= dilution factor.
Amount released
Percentage drug release (%) = --- X 100 Drug content
Mechanism of drug release kinetics studies
The data obtained from the in-vitro dissolution studies was subjected to kinetic treatment to obtain the order of release and best fit model for the formulations by using PCP-Disso-V2 software. The in-vitro drug release drug release data of the formulations was analyzed with various kinetic equations like zero-order (% release v/s time), first- order (Log % retained v/s time), Higuchi matrix (cumulative % drug released vs. square root of time) and Korsemeyer and Peppas equation (Log cumulative percent drug released versus log time) [17]. The coefficients of correlation (r) values were calculated for the linear curves obtained by regression analysis of the above plots.
Zero-order kinetics: The drug release followed by zero-order was estimated by using the following equation;
Qt = Q0 + K0 t
Where Q is the amount of drug dissolved in time t, Q0 is the initial amount of drug in the solution (most times Q =0), and K0 is the zero order release constant. When the data is plotted as cumulative percent drug release versus time, if the plot is linear then the data obeys zero-order release kinetics with a slope equal to Ko.
First-order kinetics: The drug release followed to first-order was estimated by using the following equation;
Log c = Log Co – Kt / 2.303
Where: C = Amount of drug remained at time (t). Co = Initial amount of drug, K=First-order rate constant (hr-1)
When the calculated data was plotted as log cumulative percent drug remaining versus time obtained a straight line that indicates that the release follows first order kinetics. The constant ‘K’ can be obtained by multiplying 2.303 with slop values.
Higuchi’s matrix model: This model explains the release of drug from matrix devices mainly by diffusion of drug from the matrix layer. The drug release from the formulations was determined by using the following Higuchi’s classical diffusion equation.
Q = [DE / Ʈ (2A- E Cs) Cst ] ½
Where; Q = Amount of drug released at time (t), D = Diffusion co-efficient of the drug in the matrix, A = Total amount of drug in unit volume of matrix, Cs = the solubility of the drug in the matrix, E = Porosity of the matrix, τ = Tortuosity and t = time (hrs.) of which Q amount of drug is released.
The above equation can be simplified if one assumes that D, Cs and A are constant. The equation becomes
When the data was plotted by cumulative percentage of drug release versus square root of time shows a straight line. This was indicates that the drug was released by diffusion mechanism.
Korsemeyer and Peppas model: This model was generally used to analyze the release of the drug from polymeric dosage forms, when the release mechanism is not well known or when more than one type of release occurs corresponding to time (t). In order to understand the mode of drug release from swellable matrices, the data is fitted to the following Peppas equation
Mt / M∞ = K t n
Where, Mt is the amount of drug released at time (t). M∞ is the amount of drug released at infinite time (t). K is the kinetic rate constant depends on structural and a geometric characteristic of the product and n is the diffusional exponent which indicates the release mechanism [18]. The above equation can be simplified by applying log on both sides then we get:
Log Mt / M∞ = Log K + n Log t
When the data is plotted as log percentage of drug release versus log time shows a straight line with a slope equal to ‘n’ (diffusional co-efficient) and the ‘K’ (coefficient of correlation) can be obtained from y-intercept.
RESULTS AND DISCUSSION
Preformulation studies
The preformulation is the preliminary study for investigation and detail understanding of the physicochemical and chemical dynamics of drug substances through stability under the conditions to select correct form of drug and non-drug components for developing optimal non-drug delivery system [19]. Based on the preformulation results, proper excipients are used in the manufacturing of protocol products and to optimize the release of drug for an extended period at the site of action.
FT-IR spectroscopy
______________________________________________________________________________
400 600 800 1000 1200 1400 1600 1800 2000 2400 2800 3200 3600 4000 1/cm 0 7.5 15 22.5 30 37.5 45 52.5 60 67.5 %T S-9 400 600 800 1000 1200 1400 1600 1800 2000 2400 2800 3200 3600 4000 1/cm 0 7.5 15 22.5 30 37.5 45 52.5 60 %T S-19 500 750 1000 1250 1500 1750 2000 2250 2500 2750 3000 3250 3500 3750 4000 1/cm -5 0 5 10 15 20 25 30 35 40 %T 3 3 1 7 .6 7 2 9 3 2 .8 6 1 9 1 6 .3 4 1 7 7 0 .7 1 1 7 1 8 .6 3 1 5 8 3 .6 1 1 5 0 4 .5 3 1 4 4 7 .6 2 1 3 4 3 .4 6 1 2 5 2 .8 1 1 1 4 9 .61 10
5 2 .2 0 8 9 5 .0
0 849
[image:7.595.63.563.65.648.2].6 7 7 4 6 .4 8 6 6 2 .5 7 6 1 6 .2 8 5 0 8 .2 6 4 5 1 .3 6 Accep +HPMC
Figure 1. FTIR-Spectra of A) Pure aceclofenac sodium, B) LBG, C) Physical mixture aceclofenac sodium and LBG, D) HPMC K15M, E) Physical mixture of aceclofenac sodium and HPMC K15M
Differential scanning calorimetry (DSC)
DSC is a well-established method often used as a qualitative technique to characterize physical and chemical changes in either enthalpy or heat capacity of a crystalline drug in the polymer matrix during the manufacturing process. The pure aceclofenac sodium shown a sharp endothermic peak at 158.500C followed by corresponding meting point (Figure 2a). However, the drug-loaded matrix tablets were shown a sharp endothermic peak in between the range of 193 to 1950C (Figure 2b, 2c). The extra obvious peak of the pure aceclofenac sodium at 158.50C was not observed in the thermograms of prepared matrix tablets. The results indicate that there were no changes in
400 600 800 1000 1200 1400 1600 1800 2000 2400 2800 3200 3600 4000 1/cm 0 7.5 15 22.5 30 37.5 45 52.5 %T S-1 400 600 800 1000 1200 1400 1600 1800 2000 2400 2800 3200 3600 4000 1/cm 0 10 20 30 40 50 60 70 %T S-11
A
B
C
D
thermal behavior of drug during the manufacturing process and it was molecularly dispersed in different hydrogel matrices.
X-Ray Powder Diffractometry (X-RPD)
The distribution of the drug in the polymeric matrix is very important to maintain the theoretical potency and stability in the manufacturing process. However, the drug can crystallize during the formulation resulting decreased aqueous solubility rate due to its polymorphic changes such as particle size, shape, density, melting point etc.The XRPD is an important technique in pharmaceutical field because to investigate the fundamental physical features about the crystalline nature of solid substances.
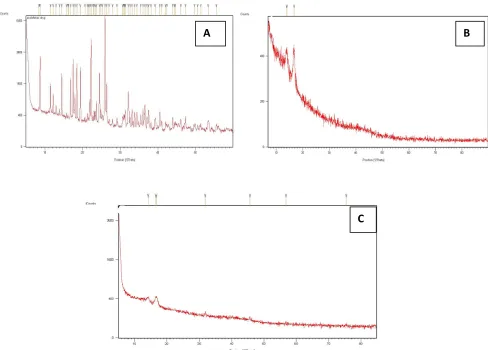
[image:8.595.69.547.296.701.2]The X-ray powder diffraction patterns of pure drug were compared with drug-loaded matrix tablets. The relative intensity of peaks were observed in XRPD patterns and calculated by using D8 TOOLS software. The intensity of the pure aceclofenac sodium peaks observed at 8.72, 14.47, 22.26, and 25.95(2θ) (Figure 3a). The peaks intensity of formulated aceclofenac sodium matrix tablets AF-4 at 13.98 and 16.76 (2θ) (Figure 3b). The aceclofenac sodium matrix tablets AF-9 shows peaks at intensity 14.16 and 16.65(2θ) (Figure 3c). The XRPD scan of plain aceclofenac sodium shown sharp intense peaks of crystallinity whereas the drug-loaded matrix tablets exhibited halo pattern with less intense followed by denser peaks. This result indicates that decrease in the degree of crystallinity due to partial amorphization of the drug in the polymeric matrix. Thus, there were no appreciable changes in the crystallinity of drug during the manufacturing process.
Figure 2 DSC Thermo-grams of a) pure aceclofenac sodium b) Aceclofenac sodium matrix tablets (AF-4), c) Aceclofenac sodium matrix tablets (AF-9)
A
B
______________________________________________________________________________
Figure 3 X-Ray diffraction patterns of A) Pure aceclofenac sodium B) Matrix tablets containing LBG as retardant (AF-4), C) Matrix tablets containing HPMC K15M as retardants (AF-9)
Micromeritic properties of precompressed granules
From the Table 2, the granules of different formulations were evaluated for angle of repose, loose bulk density, tapped bulk density, carr,s index, hausner’s ratio. Increasing the concentration of polymer and diluent ratio decreases the angle of repose. The angle of repose (<30) indicates good flow properties of the granules due to formation of high compact matrix in the granulation process. The bulk and tapped density values were obtained in the acceptable range indicating good packability of the granules in the tablet die cavity and minimizes weight variation of compressed tablets. Compressibility index and hausner’s ratio values were obtained in the range 13.56 to 8.35 and 1.35 to 1.08 respectively. This indicates the prepared granules have excellent compressibility and good flow properties to get acceptable hardness to the tablets.
Table 2 Micromeritic properties of pre-compressed matrix granules of aceclofenac sodium
Formulation Code Bulk density (g/ml)
Tapped density (g/ml)
Carr’s index
(%) Hausner’s ratio
Angle of repose (θ) AF-1 0.294 ± 0.75 0.348 ± 0.35 13.56 1.35 19.25 AF-2 0.344 ± 0.18 0.395 ± 0.78 12.90 1.15 18.90 AF-3 0.407 ± 0.25 0.458 ± 0.47 11.15 1.12 18.12 AF-4 0.440 ± 0.22 0.490 ± 0.45 10.86 1.11 17.85 AF-5 0.462 ± 0.35 0.504 ± 0.22 08.35 1.09 17.05 AF-6 0.312 ± 0.44 0.364 ± 0.15 14.65 1.16 24.65 AF-7 0.348 ± 0.15 0.398 ± 0.35 12.55 1.14 22.10 AF-8 0.373 ± 0.55 0.424 ± 0.55 12.06 1.13 19.30 AF-9 0.412 ± 0.25 0.458 ± 0.25 10.05 1.11 18.60 AF-10 0.444 ± 0.26 0.488 ± 0.15 09.05 1.08 16.25
Data are expressed as mean ±SD of at least triplicate
A
B
[image:9.595.119.494.599.712.2]Effect of polymer to diluent ratio on physicochemical properties of matrix tablets Effect of LBG and Pharmatose 200M
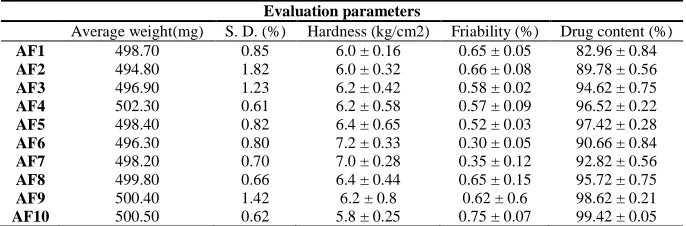
The depicted Table 3, illustrates that the weight variation of the matrix tablets was observed within pharmacopeia limit complied below ±5% w/w of standard deviation from the average. However, the average weight of the matrix tablet of the batch AF-4 was obtained very nearer to theoretical weight. The higher concentration polymer and diluent ratio influences the formation of dense matrix granules and uniform size, ultimately increases flow properties which minimizes weight variation of formulated matrix tablets. The hardness of the formulated tablets obtained within the acceptable range of 5.6 to 6.6 kg/cm2 followed by decreasing the percentage of friability except the batch AF-1. This indicates the low concentration of LBG used in the formulation decreases the mechanical strength due to the formation of loose matrix with higher concentration of Pharmatose 200M. The percentage of aceclofenac sodium content in the tablets of batches AF-1 to AF-5 was observed in the range of 84.76 ± 0.6 to 93.42 ± 0.24 respectively (Table 3). It was stated that the percentage of drug content increases by mainly increasing the concentration of LBG entrapped more quantity of drug due to formation of dense matrix during compression.
The percentage of swelling ratio of aceclofenac sodium matrix tablets (AF-1 to AF-5) was obtained in the range of 146.50, 165.40, 197.20, 266.32 and 215.30 at the end of 6 hours (Figure 4). The result suggests that increasing the concentration of both polymer and diluent could influence the percentage of swelling ratio. The formulation AF-1 containing higher level of Pharmatose 200M (above 200mg) shows higher swelling in initial hours followed by erosion at the end of 6 hours because Pharmatose 200M is a more water-soluble excipient forms more micro-cavities in polymer matrices which rapidly increases the water penetration into interior layer of polymeric gel network initially and decreases the resistance of LBG gel layer in later time period [20]. The formulation of batch AF-5 containing more concentration of polymer and less concentration of diluent decreases the swelling ratio because the hydrophilic nature of LBG forms less resistance gel layer with low concentration of diluent. The formulation AF-4 shows steady state swelling ratio for 6 hours. This states that the presence of optimum level of LBG and Pharmatose 200M enhances the formation of thick gel acts as a barrier inhibiting the water penetration into interior layer of polymeric gel, thus gradually swells with an increased time period.
[image:10.595.135.478.562.675.2]The percentage of aceclofenac sodium release from the matrix tablets (AF-1 to AF-5) was obtained in the range 21.10, 18.36, 17.99, 15.362 and 13.252 in SGF pH 1.2 for initial 2 hours. The study was continued up to 12 hours by changing the dissolution media to pH 7.4 PBS and the percentage of drug release at the end of 12 hours was obtained in the range of 94.58, 89.18, 83.12, 79.25 and 75.66 respectively. The Figure 5, explains that the increase in the concentration of polymer and diluent ratio significantly retards the release of aceclofenac sodium from the matrix tablets. The drug release in SGF pH 1.2 for initial 2 hours was found to be less than 15 % due to poor solubility of aceclofenac sodium and LBG in this environment. The drug release significantly increases in SIF pH 7.4 at 6 hours followed by sustaining up to 12 hours. The formulation AF-4 shows an optimum drug release compared to AF-1. The higher amount of Pharmatose 200M interact with lower amount of LBG and do not form thick polymeric gel layer which rapidly diffuses the drug at higher pH level. On other hand, increase the concentration of LBG in the matrix tablets which prolongs the drug release due to formation of thick hydrodynamic diffusion gel layer in the dissolution process. Thus, the drug release from the swellable matrices altered by both LBG and Pharmatose 200 M ratios present in the matrix system.
Table 3 Physicochemical evaluation of the formulated matrix tablets of aceclofenac sodium
Evaluation parameters
Average weight(mg) S. D. (%) Hardness (kg/cm2) Friability (%) Drug content (%)
AF1 498.70 0.85 6.0 ± 0.16 0.65 ± 0.05 82.96 ± 0.84
AF2 494.80 1.82 6.0 ± 0.32 0.66 ± 0.08 89.78 ± 0.56
AF3 496.90 1.23 6.2 ± 0.42 0.58 ± 0.02 94.62 ± 0.75
AF4 502.30 0.61 6.2 ± 0.58 0.57 ± 0.09 96.52 ± 0.22
AF5 498.40 0.82 6.4 ± 0.65 0.52 ± 0.03 97.42 ± 0.28
AF6 496.30 0.80 7.2 ± 0.33 0.30 ± 0.05 90.66 ± 0.84
AF7 498.20 0.70 7.0 ± 0.28 0.35 ± 0.12 92.82 ± 0.56
AF8 499.80 0.66 6.4 ± 0.44 0.65 ± 0.15 95.72 ± 0.75
AF9 500.40 1.42 6.2 ± 0.8 0.62 ± 0.6 98.62 ± 0.21
______________________________________________________________________________
Figure 4 Effect of LBG and Pharmatose 200M on swelling behaviors of aceclofenac matrix tablets in pH 6.8 PBS
Figure 5. Effect of LBG and Pharmatose 200M on In-vitro drug release profiles of formulated matrix tablets of aceclofenac sodium
Effect of HPMC K15M and Pharmatose 200M
From the Table 3, the weight variation of the matrix tablets observed within pharmacopeia limit and complied below ± 5% w/w of standard deviation from the average. The average weight of the matrix tablet of the batch AF-9 was obtained very nearer to theoretical weight. This suggested that by increasing the polymer and diluent ratio influences the formation of uniform size granules which ultimately increases the flow properties and minimizes the weight variation. The hardness of the formulated tablets obtained within acceptable range of 5.5 to 7.1 kg/cm2 followed by decreasing the percentage of friability except the batch AF-6. This indicates the low concentration of HPMC K15M used in the formulation decreases the mechanical strength due to the lower compressibility of Pharmatose 200M forms loose matrix granules. The percentage of aceclofenac sodium content in the matrix tablets of batches AF-6 to AF-10 was found in the range of 88.95 to 96.42 respectively. It was stated, that the percentage of drug content increases with higher concentration HPMC K15M due to formation of dense matrix entrapped more quantity of drug.
steady state swelling ratio for 6 hours. This states that the presence of optimum level of HPMC K15M and Pharmatose 200M enhances the formation of thick gel acts as a barrier inhibiting the water penetration into interior layer of polymeric gel, thus gradually swells with an increasing time period
[image:12.595.136.484.285.452.2]The percentage of aceclofenac sodium release from the matrix tablets (AF-6 to AF-10) was obtained in the range of 20.12, 17.83, 15.48, 14.42 and 11.85 in SGF pH 1.2 for initial 2 hours. The study was continued up to 12 hours by changing the dissolution media to pH 7.4 PBS and the percentage of drug release at the end of 12 hours was obtained in the range of 94.55, 89.98, 83.45, 79.66, and 72.15 respectively. The figure 7, explains that the aceclofenac sodium release from the matrix tablets significantly increases with increasing the concentration of HPMC K15M and Pharmatose 200M ratio in the formulation. The aceclofenac sodium release from the matrix tablets was very less (<10%) for initial 2 hours in SGF pH 1.2 because of poor solubility of drug and polymer in this media. The drug release significantly increases in SIF pH 7.4 at 6 hours followed by sustaining up to 12 hours. The formulation AF-6 shows rapid drug release compared to AF-10. The higher amount of Pharmatose 200M interact with lower amount of HPMC K15M forms loose network gel layer which rapidly diffuses the drug at higher pH level. On other hand, increase the concentration of HPMC K15M in the matrix tablets prolongs the drug release due to formation of thick diffusion gel layer, acts as a barrier that take prolonged time to diffuse aceclofenac sodium into bulk of the dissolution media.
[image:12.595.103.505.492.687.2]Figure 6. Effect of HPMC K15M and Pharmatose 200M on swelling behaviors of aceclofenac matrix tablets in pH 6.8 PBS
______________________________________________________________________________
Analysis of various drug release kinetics
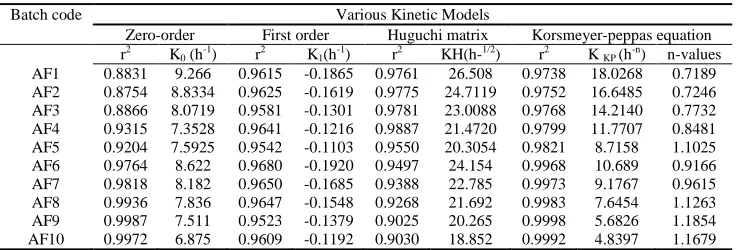
The in-vitro drug release of all the batches of AF-1 to AF-10 aceclofenac sodium matrix tablets was treated with various kinetic models. The mechanism of drug release was determined by using PCP-DISSOv2.08 software. The in vitro drug release pattern of batches AF-1 to AF-5 were found to be highest correlation co-efficient (r2) in the range of 0.9761, 0.9775, 0.9781, 0.9887, 0.9550 corresponding to huguchi matrix followed to Korsemeyer – Peppas model with coefficient of correlation (r2) in the range 0.9738, 0.9752, 0.9768, 0.9799, 0.9821 and 0.7189, 0.7246, 0.7732, 0.8481, 1.1025 diffusion coefficient (n) values are respectively (Table 4). The formulations AF-6 to AF-10 shows highest regression coefficient (r2) values were obtained in the range of 0.9764, 0.9818, 0.9936, 0.9987, 0.9972 corresponding to zero-order followed to Korsemeyer – Peppas model with coefficient of correlation (r2) values in the range of 0.9968, 0.9973, 0.9983, 0.9998, 0.9992 and 0.9166, 0.9615, 1.1263, 1.1854, 1.1679 the values of diffusion coefficient (n) are obtained respectively (Table 4) The results describes that the release mechanism from the batches of AF-1 to AF-5 matrix tablets shows highest correlation co-efficient corresponding to huguchi matrix followed to krosemeyer – peppas model. The formulation batches of AF-6 to AF-10 shows the mechanism of drug release zero-order followed to krosemeyer - peppas mixed order kinetics. All the formulation batches have shown the diffusion co-efficient (n) values in the range of 0.5810 to 1.185.This indicates, the drug release from matrix tablets by both diffusion and erosion mechanisms followed by super case-II transport
Table 4 In-vitro drug release of aceclofenac sodium matrix tablets fitted with various kinetic models
Batch code Various Kinetic Models
Zero-order First order Huguchi matrix Korsmeyer-peppas equation r2 K
0 (h-1) r2 K1(h-1) r2 KH(h-1/2) r2 K KP (h-n) n-values
AF1 0.8831 9.266 0.9615 -0.1865 0.9761 26.508 0.9738 18.0268 0.7189 AF2 0.8754 8.8334 0.9625 -0.1619 0.9775 24.7119 0.9752 16.6485 0.7246 AF3 0.8866 8.0719 0.9581 -0.1301 0.9781 23.0088 0.9768 14.2140 0.7732 AF4 0.9315 7.3528 0.9641 -0.1216 0.9887 21.4720 0.9799 11.7707 0.8481 AF5 0.9204 7.5925 0.9542 -0.1103 0.9550 20.3054 0.9821 8.7158 1.1025 AF6 0.9764 8.622 0.9680 -0.1920 0.9497 24.154 0.9968 10.689 0.9166 AF7 0.9818 8.182 0.9650 -0.1685 0.9388 22.785 0.9973 9.1767 0.9615 AF8 0.9936 7.836 0.9647 -0.1548 0.9268 21.692 0.9983 7.6454 1.1263 AF9 0.9987 7.511 0.9523 -0.1379 0.9025 20.265 0.9998 5.6826 1.1854 AF10 0.9972 6.875 0.9609 -0.1192 0.9030 18.852 0.9992 4.8397 1.1679
Where K0 is zero order proportionality constant, r2 is the regression coefficient; K1 is the first order release rate constant, KH is the Higuchi
constant, KKP is Peppas equation constant. n = Diffusion exponent related to mechanism of drug release, according to equation Mt/M=Ktn
CONCLUSION
In the present research work, the aceclofenac sodium oral sustained release matrix tablets have been developed by using hydrophilic release retardants and investigated the effects of polymer and diluent ratio on physicochemical properties and drug release potential. All the micromeritic properties of the granules show acceptable ranges that are free flowing during the compression of tablets. The compressed tablet properties such as percentage of drug content, hardness, average weight and weight variation obtained an acceptable range and the values meet pharmacopeias limits.The swelling behaviors of formulated tablets remarkably increase with optimum proportion of polymer and diluent level. The optimum proportion of HPMC K15M and Pharmatose 200M shows the gradual swelling behavior and gives a great contribution to sustain the drug release for extended period of time. The in-vitro drug release significantly decreases with variable concentration of polymer and diluent ratio. The formulated drug loaded matrix tablets in SGF pH 1.2 show less than 20% w/w of drug release due to hydrophobicity of drugs, but maximum amount of drug release (>60 %w/w) in pH 7.4 at 6 hours followed by sustaining up to 12 hours. The kinetic drug release mechanism of formulated aceclofenac sodium matrix tablets was found to be linear and close correlation with huguchi matrix diffusion followed to Korsmeyer and Peppa’s model and good regression co-efficient was observed due to diffusion and erosion mechanism of polymeric chains and shown the diffusion co-efficient (n) values in the range of 0.5810 to 1.185. This indicates, the drug release from matrix tablets by both diffusion and erosion mechanisms followed by super case-II transport. The developed formulations of aceclofenac sodium matrix tablets are physically and chemically stable and retain their pharmaceutical properties at various temperature and humidity conditions over a period of 6 months.Based on the investigated results, it was concluded that the polymer and diluent ratio modify the release of drug in different environmental pH conditions, capable of exhibiting the sustained release properties, environmentally stable and feasible for further scale up industrial production.
Acknowledgements
[image:13.595.123.492.282.407.2]DMV-Fonterra, Netherland Plasdone29/32 and Polyplasdone XL were gift samples from ISP Singapore PTE Ltd., Singapore.
REFERENCES
[1]. Kathleen parfitt and Marindale, The complete Drug reference part-I “Antiinflammatory drugs and antipyretics” 32nd, Edition, Philadelphia Pharmaceutical Press, 1996; Pp. 1-11
[2]. Florence, A.T, .Jani, P.U, Novel oral formulations, Their potential in modulating adverse effects, Drug safety, 1994; 10, (3), 233-266
[3]. Joseph R. Robinson Oral controlled drug delivery systems, 2nd Edition, Marcel-Dekker, Inc, New York, NY, 1992; pp. 365-368.
[4]. Tommasina Coviello, Pietro Matricardi, Journal of controlled release, 2007; 119; 5-24 [5]. Graham NB, McNeill, ME, Biomaterials, 1994; 5, 27–36.
[6]. Hogan, J.E, Drug Dev. and Ind. Pharmacy, 1989; 3, 975 - 999.
[7]. Willipaul P., Chandra P., Sharma A. Polysaccharides biomedical applications, Encyclo of surface and colloidal
sciences, 2003; 7, 305-325
[8]. Melia, DC, Critical Review in therapeutic drug carrier systems, 1991; 18, 395-421.
[9].Chandrakant M, Shital Kumar, Dhanya Kumar, Research journal Pharm and Technology, 2008; 1(4), 430.434 [10]. Martin Alfred, Physical Pharmacy” 4th Edition B.I. Waverly Pvt. Ltd., New Delhi, 1991; pp.760
[11]. Subrahmanyam CVS, Text Book of Physical Pharmaceutics, second edition, Vallabh Prakashan, New Delhi, 2000; pp. 85.
[12]. Indian Pharmacopoeia, Ministry of Health and Family Welfare, Government of India, 1996, Volume-II, 328-32.
[13].Efentakis M., Vlachou M., Choulis NH, Drug development and industrial pharmacy, 1997; 23(1), 107-112 [14]. Srinivas M, Krishnan M, Sreenivasa Reddy M, AAPS Pharm SciTech, 2008; 9(2), 651-659.
[15]. Tejal Soni., Chirag Nagda,Tejal Gandhi, and N. P. Chotai, Dissolution Technologies, 2008; 31-34 [16]. Shah, VP, Pharm Research, 1989; 6, 612–618.
[17]. Peppas, NA Colombo, P., Bettini. R., Journal of controlled release, 1999; 61, 83-91. [18]. Paulo Costa, Jose´ Manuel Sousa Lobo, Eur, J Pharm Sci, 2001; 13; 123–133
[19]. Eugene F. Fiese and Timothy A. Hagen “Preformulation”. The Theory and Practice of Industrial Pharmacy, 3rd Edition, Varghese Publishing House, Mumbai, 1991; pp.760.
[20]. Venkataraju, M. P. Gowda, D.V. Shivakumar, H. G, Asian journal of pharmaceutical sciences, 2007; 2 (6); 239-248.