XLR: A Free Excel Add-In for Introductory Business
Statistics
Pin T. Ng
W. A. Franke College of Business, Northern Arizona University, Flagstaff, USA Email: [email protected]
Received 2013
ABSTRACT
XLR is an Excel add-in that unifies the user friendly, widely popular interface of Excel with the powerful and robust computational capability of the GNU statistical and graphical language R. The add-in attempts to address the American Statistical Association’s comment that “Generic packages such as Excel are not sufficient even for the teaching of sta-tistics, let alone for research and consulting.” R is the program of choice for researchers in statistical methodology that is freely available under the Free Software Foundation’s GNU General Public License (GPL) Agreement. By wedding the interactive mode of Excel with the power of statistical computing of R, XLR provides a solution to the problem of numerical inaccuracy of using Excel and its various internal statistical functions and procedures by harnessing the computational power of R. XLR will be distributed under the GNU GPL Agreement. The GPL puts students, instructors and researchers in control of their usage of the software by providing them with the freedom to run, copy, distribute, study, change and improve the software, thus, freeing them from the bondage of proprietary software. The creation of XLR will not only have a significant impact on the teaching of an Introductory Business Statistics course by providing a free alternative to the commercial proprietary software but also provide researchers in all disciplines who require so-phisticated and cutting edge statistical and graphical procedures with a user-friendly interactive data analysis tool when the current set of available commands is expanded to include more advance procedures.
Keywords: Excel Add-ins; Statistical Computing; Teaching Business Statistics; R
1. Introduction
In the last decades, there has been a trend among busi-ness schools in the U.S. to shift the focus of an Introduc-tory Business Statistics course from the traditional ap-proach of teaching statistics via formulae to an interpre-tive approach which emphasizes interpretations of statis-tical output obtained with the help of some statisstatis-tical software. For example, see [1-3]. This encourages and enables students to concentrate on making more sense out of the statistical results instead of exerting most of their energy on the mechanics of calculating the various statistics. A survey of existing textbooks in the market reveals that a majority of them incorporate detailed in-structions on Excel and its add-ins. Only a small portion of the remaining textbooks utilize other statistical soft-ware such as Minitab, SPSS or SAS to perform the sta-tistical computations.
Excel and its add-ins remains the most popular route among instructors because students in business schools usually are expected to have a certain level of exposure and competency in Excel by the time they enroll in an Introductory Business Statistics course. So it makes sense to teach the course using Excel/add-ins rather than
other statistical software to improve students’ learning curve. However, in endorsement of the Mathematical Association of America Guidelines for Programs and Departments in Undergraduate Mathematical Sciences [4], the American Statistical Association commented that “Generic packages such as Excel are not sufficient even for the teaching of statistics, let alone for research and consulting.” Numerous studies have highlighted the defi-ciencies and dangers of using Excel as a statistical pack-age for teaching and research. Reference [5-9] performs extensive studies to reveal that several statistical algo-rithms used in Excel yield erroneous results. Reference [10] demonstrates the danger of using Excel to perform regression analysis that involves correlated independent variables. Reference [11,12] discuss additional problems in using Excel while [13] recommends researchers against using Excel for any scientific purpose.
StatTools®, UNISTAT®, and XLSTAT©. With the ex-ception of PopTools, which is written specifically to analyze ecological models, these add-ins are commercial products that have an annual single user license fee that ranges from $40.00 for statistiXL© to $300.00 for UNI-STAT®. In light of the ever rising textbook prices and costs of attending colleges/universities, it will be valu-able to the students, instructors and researchers to have the freedom of using an Excel add-in that utilizes the familiar interface of Excel, and offers a reliable and an extended range of statistical procedures without having to be burdened with the licensing cost.
XLR intends to serve this purpose by being a free software version of an Excel add-in that includes a fuller range of statistical procedures that are commonly cov-ered in a typical Introductory Business Statistics course and free the users from the constraints that come with proprietary software. It attempts to achieve this by har-nessing the power of the popular free software R [14] -- a language and environment for statistical computing and graphics.
2. Design Approach and Philosophy
Reference [15] provides a utility, R-Excel interface, to connect Excel to R. The R-Excel interface uses DCOM to embed R into Excel. Component object model (COM) is a technology used on Microsoft Windows platforms for server applications (e.g., R) to expose functionality of a component (set of objects, e.g., R functions) to client applications (e.g., Excel). DCOM is the distributed ver-sion of COM that makes COM objects (e.g., a set of R functions) transparently available across a network of computers.
Specifically, R-Excel provides three interface modes: (1) scratchpad and data transfer mode, (2) macro mode, and (3) spreadsheet mode. The first scatchpad and data transfer mode is designed for power users who have a reasonable amount of knowledge in R. We did not adopt this interface mode in XLR. We want to shield the users from all the details of R computations and coding so that the users think that they are working in Excel not R. The macro mode allows us to put any statistical procedures written in R on an Excel menu or button via VBA for Excel. This is the pre-dominant interface design in XLR. The spreadsheet mode, which retains the automatic re-calculation feature in Excel, is adopted to rewrite a list of commonly used Excel functions by making functional calls to the corresponding R functions and, hence, enable us to solve the notorious problems of incorrect handling of delicate numerical problems in Excel as reported in [5,7-10].
R has an extensive collection of statistical (linear and nonlinear modeling, classical statistical tests, time-series analysis, classification, clustering, etc.) and graphical
(box and whisker plots, pie charts, pairs plot, coplot, 3D plot, forest plot, etc.) procedures and is highly extensible through the add-on packages, which number more than 4,000 to date. This makes it perfectly suitable to act as the computational engine for Excel in the COM para-digm so that we do not have to be concerned about rein-venting the wheels of statistical computing procedures. In our XLR implementation, Excel (client application) utilizes R (server application) as a computational com-ponent object. The users are not expected to know any programming in R. Our goal is that they should not even be aware that R is involved at all. The distributed version of COM will be explored in a future project.
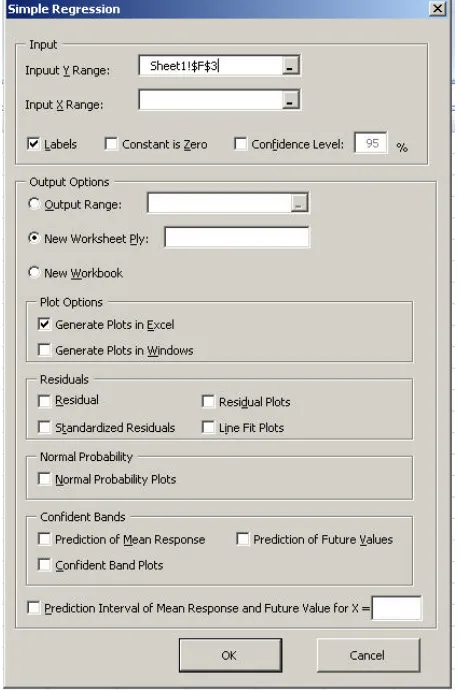
[image:2.595.309.539.363.708.2]Whenever possible, we adhere to the feel and look of the input dialogue box and output format of the various tools in Excel’s Analysis ToolPak. This will help make users feel more at home in their familiar Excel comput-ing environment. Figure 1 and Figure 2 show the dia-logue box and output for the Simple Linear Regression in XLR. Users can see that they look very much like the dialogue box and output of the Regression tool in EX-CEL’s Analysis ToolPak.
‘
Figure 2. The output from the Simple Linear Regression command in XLR.
3. Features
3.1. Commands
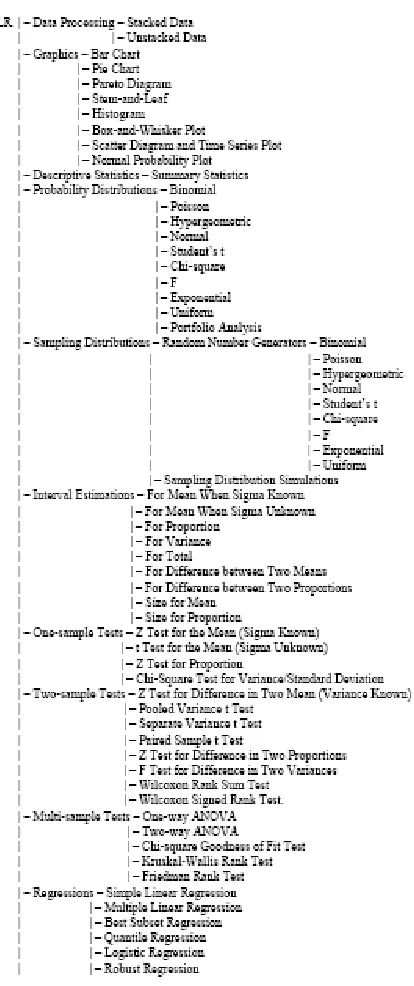
[image:3.595.58.289.396.625.2]The commands in XLR are grouped into 10 different group of functionality as shown in Figure 4. Figure 5 shows the menu tree of XLR commands.
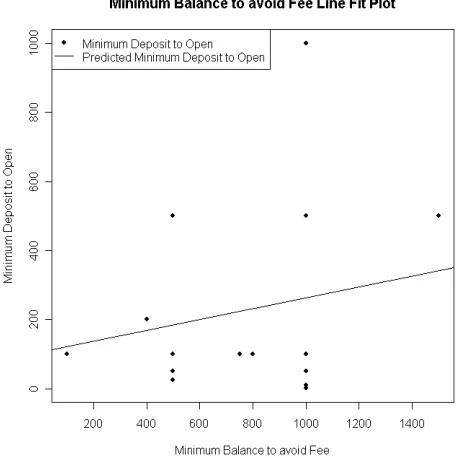
Figure 3. Scatter plot and fitted values generated by the Simple Linear Regression command in XLR using R’s graphic capability.
Excel’s Chart Tools are used in generating graphs so that users can continue to use the Chart Tools to modify their graphs. We also provide an option for the users to generate the higher quality R graphs that can be saved in
[image:3.595.332.513.475.722.2]Figure 5. The menu tree of XLR commands.
3.2. Other Functions
A group of functions like RAVERAGE, RSTDEV, RNORMINV, RNORMDIST, RCHIINV, RCHIDIST, etc. are meant to replace the native Excel AVERAGE, STDEV, NORMINV, NORMDIST, CHIINV, CHIDIST commands. There is also a group of statistical functions like pnorm, qnorm, dnorm to compute the probability, quantile and density of a normal distribution. There are groups for the other typical distributions like the Stu-dent’s t, F, Chi-square, etc. as well.
4. Future Extensions
Distributed under the GNU GPL Agreement, anyone who is interested can extend and modify the command set and functions in XLR to include more advanced, cur-rent and cutting edge procedures. Hence, potentially XLR will not only have a significant impact on the teaching of an Introductory Statistics course by providing a free alternative to the commercial proprietary software but also provide researchers in all disciplines who require sophisticated and cutting edge statistical and graphical procedures with a user-friendly interactive data analysis tool.
5. Acknowledgements
This project is partially funded by the Intramural Grant Program at the Northern Arizona University.
REFERENCES
[1] P. C. Bell, “Teaching Business Statistics with Microsoft Excel,” INFORMS Transactions on Education, Vol. 1, No. 1, 2000, pp. 18-26.
doi:10.1287/ited.1.1.18
[2] J. Garfield, B. Hogg, C. Schau and D. Whittinghill, “First Courses in Statistical Science: the Status of Educational Reform Efforts,” Journal of Statistics Education, Vol. 10, No. 2, 2002.
http://www.amstat.org/publications/jse/v10n2/garfield.ht ml
[3] T. E. Love and D. K. Hildenbrand, “Statistics Education and the Making Statistics More Effective in Schools of Business Conferences,” The American Statistician, Vol. 56, No. 2, 2002, pp. 107-112.
doi:10.1198/000313002317572772
[4] ASA, “Guidelines for Programs and Departments in Un-dergraduate Mathematical Sciences,” American Statistical Association (ASA) Endorsement of the Mathematical As-sociation of America (MAA), 2000.
http://www07.homepage.villanova.edu/michael.posner/si gmaastated/ASAendorsement2.html
[5] L. Knusel, “On the Accuracy of Statistical Distributions in Microsoft Excel 97,” Computational Statistics and Data Analysis, Vol. 26, No. 3, 1998, pp. 375-377. doi:10.1016/S0167-9473(97)81756-2
[6] B. D. McCullough and D. A. Heiser, “On the accuracy of statistical procedures in Microsoft Excel 2007,” Compu-tational Statistics & Data Analysis, Vol. 52, No. 10, 2008, pp. 4570-4578. doi:10.1016/j.csda.2008.03.004
[7] B. D. McCullough and B. Wilson, “On the Accuracy of Statistical Procedures in Microsoft Excel 97,” Computa-tional Statistics & Data Analysis, Vol. 31, No. 3, 1999, pp. 27-37.
doi:10.1016/S0167-9473(99)00004-3
XP,” Computational Statistics & Data Analysis, Vol. 40, No. 4, 2002, pp. 713-721.
doi:10.1016/S0167-9473(02)00095-6
[9] B. D. McCullough and B. Wilson, “On the accuracy of statistical procedures in Microsoft Excel 2003,” Compu-tational Statistics & Data Analysis, Vol. 49, No. 4, 2005, pp. 1244-1252. doi:10.1016/j.csda.2004.06.016
[10] J. Simonoff, “Statistical Analysis Using Microsoft Ex-cel,”2005.
http://pages.stern.nyu.edu/~jsimonof/classes/1305/pdf/exc elreg.pdf
[11] N. Cox, “Use of Excel for Statistical Analysis,”2000. http://users.df.uba.ar/sgil/tutoriales1/fisica_tutoriales/data _analisis/Statistical_analysis.pdf
[12] J. D. Cryer, “Problems with Using Microsoft Excel for Statistics,” the Joint Statistical Meetings, American Sta-tistical Association, 2001.
http://www.stat.uiowa.edu/~jcryer/JSMTalk2001.pdf
[13] A. T. Yalta, “The Accuracy of Statistical Distributions in Microsoft Excel 2007,” Computational Statistics and Data Analysis, Vol. 52, No. 10. 2008, pp. 4579-4586. doi:10.1016/j.csda.2008.03.005
[14] R. Core Team, “R: A Language and Environment for Statistical Computing,” R Foundation for Statistical Com-puting, Vienna, Austria, 2012. http://www.R-project.org