© 2017, IRJET | Impact Factor value: 6.171 | ISO 9001:2008 Certified Journal
| Page 633
Relevance of Particle Swarm Optimization Technique for the Solution of
Economic Load Dispatch Problem
Mr. Jatinder Kumar
1, Mr. Harkamal Deep Singh
21
M.tech. Research Scholar, Department of EEE, IKGPTU University, Punjab
2Assistant professor, Department of EEE, IKGPTU University, Punjab
---***---
Abstract- Economic Load Dispatch is very vital research in
generation of electrical power system. It is method by which we can make a plan of the preeminent achievable output of a number of generators power units so that to meet the domestic, industrial agriculture load demand at minimum possible cost, while satisfy all transmissions loss and operational constraints. This research paper tries to present the relevance of particle swarm optimization technique for the mathematical formulation of Economic load dispatch problem using soft computing technique in power generation system considering various parameters like load demand, physical and generation system constraints.
Index Terms- Economic Load Dispatch problem (ELDP),
relevance Particle Swarm Optimization, Basic mathematical formulation,.
I.
I
NTRODUCTIONIn electrical power system, seven types of generation system mostly are used in world like thermal, hydro, nuclear, bio-mass, tidal wave, solar and wind energy etc. Consumer load demand it may be (industrial, agriculture, domestic etc.) change according to load parameters and reaches the different maximum values. so, it is very essential to scheduling of power generating units by which units can turn off and on to meet the desire power load demand and also keeping in mind cost parameter order in which the units must be shut down. The entire effort of draw round and manufacture these evaluations are known as economic load dispatch. It means that generation unit output (Min. MW to Max. MW) are permissible to diverge within certain confines so that to meet a particular load demand obtained by minimum fuel cost.
II.
E
CONOMIC LOADD
ISPATCHEconomic Load Dispatch problem is very important in electric power generation plant units. The main objective of the Economic Load Dispatch problems is to create the best probable schedule of power generators outputs of all units so as to bring together the required load demand at
minimum operating cost while satisfying the equality and inequality constraints.[1] The cost function for each generators unit in Load Dispatch problems has been around defined by a quadratic function in which fuel cost, power load demand, equality and inequality constrained are involved.
III.
P
ROBLEMF
ORMULATIONThe economic dispatch problem is a constrained optimization problem and it can be expressed as
Follows.[1-4] Minimize 2 1 ( ) ( ) / NG
i i i i i i
i
F P a P b P c Rs h
(1)Where, ai (Rs/MW2h), bi (Rs/MWh) and ci (Rs/h) are fuel
cost coefficients of ith unit.
Subject to (i) the energy balance equation
1
NG
i D L
i
P P P
(2)(ii) The inequality constraints
min max
i 1,2,3,..., NG
i i i
P P P (3)
Where, a bi, i and ci are cost coefficients
L
P is power transmission Loss.
NG is the number of generation units
D
P is Load Demand.
i
P is real power generation and will act as decision
variable.
The very simple and fairly accurate method of expressing
© 2017, IRJET | Impact Factor value: 6.171 | ISO 9001:2008 Certified Journal
| Page 634
powers is through George's Formula using B-coefficients and mathematically can be expressed as:
1 1
i j
NG NG
L g ij g i j
P
P B P
MW (4)where,
P
gi andP
gj are the real power generations at theith and jth buses, respectively.
ij
B
are the loss coefficientswhich are constant under certain assumed conditions.
IV.
T
HERMAL CONSTRAINTSIn this system thermal generation unit needs to undergo gradual temperature vary and thus it takes some period of time to carry a thermal generation unit online. Also, thermal unit can be manually controlled. So a crew member is required to perform this task in operation.. This leads to a lot of limitations in the power system operation of thermal unit and thus it provide rise to many constraints.
V.
G
ENERATIONC
ONSTRAINTSIn order to convince the forecasted in power system load demand, the sum of all generating units on-line must equal the power system load over the time horizon.
(5)
Where, Dh is load demand at hth hour.
ih
P is the power output of ith unit at hth hour
ih
U is the On/Off status of the ith unit at the hth hour.
NG is the number of thermal generating units
VI.
U
NITG
ENERATION RESTRICTIONSThe power output induced by the individual units must be within max. and min. generation limits i.e.
(6)
Where, Pi(min) and Pi(max) is the minimum and maximum
power output of the ith unit.
VII.
P
ARTICLES
WARM OPTIMIZATIONParticle Swarm Optimization (PSO) is a soft computing technique. It is swarm-based intelligence algorithm predisposed by the group behaviour of animals such as a flock of birds finding a food source which likely fly in sky or a school of fish protecting them from a difficulty or predator. This soft computing technique particle swarm optimization first described by james Kennedy and Russell C. Eberhart in 1995 draw from two separate conce pts ,the idea of swarm intelligence based off the surveillance of swarming habits by certain kinds of animal s(such as fish & birds) and field of evolutionary computation.
VIII.
M
ATHEMATICSI
NVOLVED INPSO
This algorithm works by discretely maintaining a no. of
runner solutions in the search space. for the ( Pih ) is
period of all iteration of the algorithm, every candidate solution is calculated by objective function being optimized, determining fitness of that solution. Every runner solution can be thought of as particle ‘flying’ all the way through fitness landscape finding the max. or min. of the objective function. In beginning, particle swarm optimization algorithm select candidate solutions randomly within the search space.
Vinew w *Vij C1 R1 Pbbestij P ij C2 R2 G bestJ P
ij i 1, 2...NP;j 1, 2...NG
P
new Pij V new (8)
C1, C2are the acceleration constants
P is current position of jth member of ith particle at uth
iteration
NG is the no of members in a particle R1, R2is random
number between 0 and 1 and Wis the weighing function
or inertia weight factor NP is the number of particles in a
group.
In figure 1. Flow chart shows the initial parameter of state of PSO constant, C1, C2 particle ( P )and dimension (D) seeking the global maximum in a one-dimensional search space. The investigate space is composed of all the possible solutions along with the objective function. We know that the particle swarm optimization algorithm has no in sequence of the necessary objective function, and thus has no idea of knowing if someone of the candidate solutions are distance or far from a local or global max.
1
NG
i ih ih h
P U
D
(min) (max)
i ih i
© 2017, IRJET | Impact Factor value: 6.171 | ISO 9001:2008 Certified Journal
| Page 635
I
MPLEMENTATION OFC
LASSICALPSO
FORELD
SOLUTIONThe main objective of ELD is to obtain the amount of real power to be generated output by each committed generator, while achieving a minimum generation cost within the constraints. The details of the implementation of PSO components are summarized in the following subsections. The search procedure for calculating the optimal generation output of each unit is summarized as follows:
1. Initialization of the swarm: For a population size P, the particles are randomly generated in the range 0-1 and Searched between the maximum and the minimum operating
limits of the generators. If there are N generating units, the ith
particle is represented as
Pi = (Pi1, Pi2, Pi3………... PiN)
(9)The jth dimension of the ith particle is allocated a value of Pij as given below to satisfy the constraints.
Pij = Pjmin + r (Pjmax - Pjmin )
(10)Here r [0,1]
2. Defining the evaluation function: The merit of each individual particle in the swarm is found using a fitness function called evaluation function. The popular penalty function method employs functions to reduce the fitness of the particle in proportion to the magnitude of the equality constraint violation. The evaluation function is defined to minimize the non-smooth cost function given by equation The evaluation function is given as Min f(x)=f(x)+ lambda (equality constraints).
3. Initialization of P-best and G-best: The fitness values obtained above for the initial particles of the swarm are set as the initial Pbest values of the particle. The best value among all the Pbest values is identified as G-Best .
4. Evaluation of velocity: The update in velocity as per flow chart.
5. Check the velocity constraints of the members of each individual from the following conditions
If, Vid (k+1) > Vd max, then Vid (k+1) = vd max, (11)
Vid (k+1) < Vd min
then, Vid (k+1)=vd min
Where, Vdmin = -0.5 Pgmin, Vdmax = +0.5 Pg max
6. Modify the member position of each individual Pg according to the equation
Pgid (k+1) = Pgid (i) + Vid (k+1) (12)
Pgid (k+1) must satisfy the constraints, namely the generating limits. If Pgid (k+1) violates the constraints, then Pgid (k+1) must be modified towards the nearest margin of the feasible solution.
© 2017, IRJET | Impact Factor value: 6.171 | ISO 9001:2008 Certified Journal
| Page 636
8. If the number of iterations reaches the maximum, then go to step 10. Otherwise, go to step-2
IX.
TEST
SYSTEM
,
RESULT
AND
DISCUSSION
In order to show the effectiveness of the Proposed PSO Algorithm for Short-term Unit Commitment Problem, three different types of test systems have been taken into consideration:
o The first test system consists of 5-Generating
units has been taken from IEEE 14-Bus System with a time varying load demand for one day.
o The second test system consists of 6-Generating
units has been taken from IEEE 30-Bus System with a time varying load demand for one day.
o Proposed PSO result Compare the result of firefly
algorithm
Test System-I
[image:4.612.128.486.283.371.2]Table-I: Generator characteristics of 5-Unit Test System
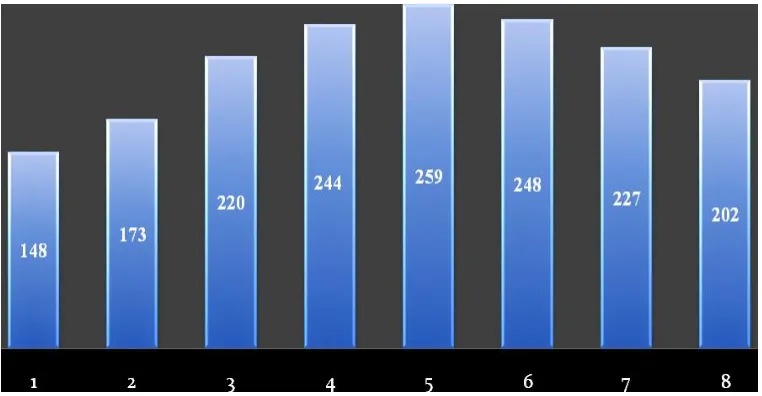
Table-II: Time varying load demand and result of 5 units
Table III. Optimal output of 5 units system which show the load demand fulfill with min. cost
UNITS Pmax Pmin A B C
Unit1 250 10 0.00315 2 0
Unit2 140 20 0.0175 1.75 0
Unit3 100 15 0.0625 1 0
Unit4 120 10 0.00834 3.25 0
Unit5 45 10 0.025 3 0
Load Demand
(MW) Iteration No. of U1 U2 U3 U4 U5 Min Cost Rs./h.
148 30000 86.9737 26.0257 15.0000 10.0000 10.0000 21276.6
173 30000 107.8218 30.1765 15.0000 10.0000 10.0000 25878.8
[image:4.612.124.505.410.608.2]© 2017, IRJET | Impact Factor value: 6.171 | ISO 9001:2008 Certified Journal
| Page 637
Test System-II
Table-IV: Generator characteristics of 6-Unit Test System
UNITS Pmax Pmin A B C
Unit1 200 50 0.00375 2 0
Unit2 80 20 0.0175 1.7 0
Unit3 50 15 0.0625 1 0
Unit4 35 10 0.00834 3.25 0
Unit5 30 10 0.025 3 0
[image:5.612.84.535.375.521.2]Unit6 40 12 0.025 3 0
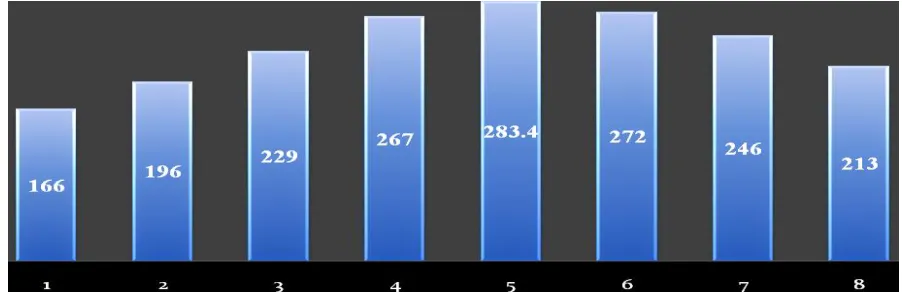
[image:5.612.74.539.561.707.2]Table-V: Time varying load demand and result of 6 units
Table VI. Optimal output of 6 units system which show the load demand fulfill with min. cost
244 30000 163.9007 42.2674 17.8340 10.0000 10.0000 38238.6
259 30000 175.7110 43.7893 18.5164 10.0000 10.0000 41198.0
248 30000 167.1512 42.9141 17.9329 10.0000 10.0000 39036.4
227 30000 130.5524 35.4128 15.0340 10.0000 10.0000 34985.6
202 30000 131.0699 35.2017 15.8565 10.0000 10.0000 30442.2
Load Demand (MW)
No. of
Iterations U1 U2 U3 U4 U5 U6 Min Cost Rs/h
166 30000 91.3180 27.6778 15.0000 10.0000 10.0000 12.0000 24561.6
196 30000 115.7033 33.2949 15.0000 10.0000 10.0000 12.0000 29516.6
229 30000 141.5913 38.9124 16.4955 10.0000 10.0000 12.0000 35383.1
267 30000 171.4119 45.3026 18.2847 10.0000 10.0000 12.0000 42651.5
283.4 30000 183.9935 48.1629 19.2428 10.0000 10.0000 12.0000 45965.8
272 30000 175.3349 46.1432 18.5211 10.0000 10.0000 12.0000 43632.6
246 30000 155.0839 41.6795 17.2346 10.0000 10.0000 12.0000 38571.8
© 2017, IRJET | Impact Factor value: 6.171 | ISO 9001:2008 Certified Journal
| Page 638
[image:6.612.85.530.145.198.2]COMPARISION OF RESULT
Table VII. Cost coefficients and power limits of 3-Unit system
Unit A B C Pmin. Pmax.
1 756.79886 38.53 0.15240 10 125
2 451.32513 46.15916 0.10587 10 150
3 1049.9977 40.39655 0.02803 35 225
Table VIII Comparison of test results of firefly and particle swarm optimization method.
S.No. Power Demand(MW) Fuel Cost (Rs/hr) Lambda iteration Fuel Cost (Rs/hr) Fuel Cost (Rs/hr)
method Firefly Algorithm Particle Swarm Optimization
1 350 18570.7 18564.5 18320.80
2 400 20817.4 20812.3 20469.83
3 450 23146.8 23112.4 22670.54
4 500 25495.2 25465.5 24909.77
5 550 27899.3 27872.4 27189.47
6 600 30359.3 30334.0 29506.31
7 650 32875.0 32851.0 31859.80
[image:6.612.84.530.232.371.2]8 700 35446.3 35424.4 34252.73
Table IX. Cost coefficients and power limits of 6-Unit system
Unit A B C Pmin. Pmax.
1 756.79886 38.53 0.15240 10 125
2 451.32513 46.15916 0.10587 10 150
3 1049.9977 40.39655 0.02803 35 225
4 1243.5311 38.30553 0.03546 35 210
5 1658.5696 36.32782 0.02111 130 325
6 1356.6592 38.27041 0.01799 125 315
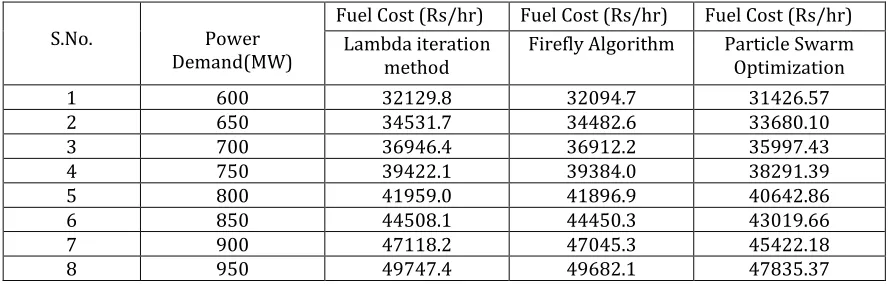
Table X Comparison of test results firefly and particle swarm optimization method.
S.No. Power
Demand(MW)
Fuel Cost (Rs/hr) Fuel Cost (Rs/hr) Fuel Cost (Rs/hr)
Lambda iteration
method Firefly Algorithm Particle Swarm Optimization
1 600 32129.8 32094.7 31426.57
2 650 34531.7 34482.6 33680.10
3 700 36946.4 36912.2 35997.43
4 750 39422.1 39384.0 38291.39
5 800 41959.0 41896.9 40642.86
6 850 44508.1 44450.3 43019.66
7 900 47118.2 47045.3 45422.18
[image:6.612.84.528.534.677.2]© 2017, IRJET | Impact Factor value: 6.171 | ISO 9001:2008 Certified Journal
| Page 639
The corresponding results has been obtained using Particle Swarm optimization Technique using Population Size=50 and Maximum Iteration=30000. The Flow chart for economic load dispatch Problem using PSO is shown in Figure-1. The MATLAB Simulation software 7.12.0 (R2010a) is used to obtain the corresponding results.
XI.
C
ONCLUSIONIn this research paper, researchers have done the relevance Particle Swarm Optimization Algorithm for solution of ELDP. The results for standard IEEE Bus system consisting of five and six Generating system units has been profitably evaluated using PSO. The following important points are observed throughout whole research works:
o By planned PSO algorithm, Fuel cost (FC) of 350
MW is 18564.5 and by firefly algorithm FC is 18320.80 for three unit system.
o Load demand 350 MW to700 MW is shown in
table (viii)
o By planned PSO algorithm, Fuel cost (FC) of 600
MW is 31426.57 and by firefly algorithm FC is 32094.7 for six unit system.
o Load demand 600 MW to 950 MW is shown in
table (x)
o Proposed algorithm has simple implementation,
require less computational time and very few algorithm parameters.
XI.
F
UTURES
COPE(1) Particle Swarm Optimization Algorithm is based on the intellect. It can be applied into both scientific engineering work and research purpose.
(2 The search can be carried out by the speed of the particle .Particle Swarm Optimization Algorithm has no overlapping and mutation calculation.
REFERENCES
[1] Zakaryia Mohammed and J. Talaq, " Economic Dispatch by Biogeography Based Optimization Method", 2011 International Conference on Signal, Image Processing and Applications With workshop of ICEEA-2011 IPCSIT ,vol.21, pp.161-165, 2011.
[2] Swarup, K.S and D.N. ‘‘A Hybrid Interior Point Assisted Differential Evolution Algorithm for Economic Dispatch ’’ Power Systems, IEEE Transactions on Volume: 26, Year 2011, pp. 541 – 549.
[3] Hardiansyah, Junaidi and Yohannes MS, “Application of Soft Computing Methods for Economic Load Dispatch Problems”, International Journal of Computer Applications (0975 – 8887), Vol. 58, No. 13, Nov. 2012, pp. 32-37.
[4] Taher Niknam and Faranak Golestaneh ‘‘Enhanced Bee Swarm Optimization Algorithm for Dynamic Economic Dispatch ’’ Systems Journal, IEEE Vol. 7, Year 2013 , pp. 754 – 762
[5] Divya Mathur ‘‘ New Methodology BBO for Solving Different Economic Dispatch Problems’’IJESIT , vol.2, jan. 2013, pp. 494-498
[6] Jyoti Jain, Rameshwar Singh," Biogeographic-Based Optimization Algorithm for Load Dispatch in Power System", International Journal of Emerging Technology and Advanced Engineering (ISSN 2250-2459), Volume 3, Issue 7, pp. 549-553, July 2013
[7] Tao Ding And Rui Bo (2014),‘‘Big-M Based MIQP Method for Economic Dispatch with Disjoint Prohibited Zones ’’IEEE Transactions on power systems, vol. 29, no. 2, march 2014pp 976-977
[8] M. S. P. Subathra (2014), ‘‘A Hybrid With Cross-Entropy Method and Sequential Quadratic Programming to Solve Economic Load Dispatch Problem’’ Year 2014,pp 1 – 14.
[9] David Naso and Ali Davoudi (2014), ‘‘A Distributed
Auction-Based Algorithm for the Nonconvex Economic
Dispatch Problem’’ IEEE Transactions on industrial
informatics, vol. 10, no. 2, may 2014pp 1124-1132
[10] Yare Y., Venayagamoorthy G. K., and Saber A. Y., “Economic Dispatch of a Differential Evolution Based Generator Maintenance Scheduling of a Power System”, in Power & Energy Society General Meeting, 2009( PES '09) IEEE , Calgary, Alberta, 26-30 July 2009, pp. 1-8.