© 2017, IRJET | Impact Factor value: 6.171 | ISO 9001:2008 Certified Journal | Page 76
STABILIZING SLOPES USING WASTES FROM INDUSTRIES
R.B.Narendran
11
Graduate, Dept. of Civil Engineering, Sri Sairam Engineering college, Tamil Nadu, India
---***---Abstract -
Increasing industrialization leads to largerquantity of waste getting accumulated leading to environmental degradation. The use of industrial wastes has shown effective results in accordance with stabilizing the soil as well as slope. In this study the slope is analyzed using Geo Studio, a slope modeling software and the soil is stabilized using additive method of stabilization. All the necessary inputs are provided into the software. The use of industrial wastes such as Ground granulated blast furnace slag(GGBS), Glass powder, Hypo sludge have shown effective results in accordance with stabilizing the soil as well as slope. GGBS is a byproduct from the iron and steel making, Glass powder is obtained from powdering the waste glass material, Hypo sludge is waste obtained from paper industries. The Slope/W function in Geo Studio provides analysis of slopes based on various methods. Morgenstern and Price method is used here which can be carried out under both normal and pore water pressure conditions. The cohesion of soil increased significantly with addition of industrial wastes. A maximum factor of safety of 1.05 (Normal condition) is obtained when 10% GGBS is added to soil. A maximum dry density of 19.5 KN/m3 is obtained when 4% Glass powder is added to soil.
Key Words: Industrial waste, Morgenstern and Price,
Slope Stabilization, Geo Studio, Hypo sludge, GGBS
1.INTRODUCTION
Slopes either occur naturally or are engineered by humans. Slope stability problems have been faced throughout history. Furthermore, the increasing demand for engineered cut and fill slopes on construction projects has only increased the need to understand analytical methods, investigative tools, and stabilization methods to solve slope stability problems. Slope stabilization methods involve specialty construction techniques that must be understood and modeled in realistic ways. An understanding of geology, hydrology, and soil properties is central to applying slope stability principles properly. Analyses must be based upon a model that accurately represents site subsurface conditions, ground behavior, and applied loads. Judgments regarding acceptable risk or safety factors must be made to assess the results of analyses. In most applications, the primary purpose of slope stability analysis is to contribute to the safe andeconomic design of excavations, embankments, earth dams, landfills, and spoil heaps. Slope stability evaluations are concerned with identifying critical geological, material, environmental, and economicparameters that will affect the project, as well as understanding the nature, magnitude, and frequency of slopes.
1.1 FACTORS AFFECTING SLOPE
Failure of Slope occurs because of the downward movements of material due to gravity and when shear stresses exceeds the shear strength. Therefore, factors that tend to increase the shear stresses or decrease the shear strength increase the chances of failure of a slope. Different processes can lead to reduction in the shear strengths of rock mass. Increased pore pressure, cracking, swelling, decomposition of clayey rock fills, creep under sustained loads, leaching, strain softening, weathering and cyclic loading are common factors that decrease the shear strength of rock mass. In contract to this the shear stress in rock mass may increase due to additional loads at the top of the slope and increase in water pressure in cracks at the top of the slope, increase in soil weight due to increased water content, excavation at the bottom of the slope and seismic effects. In addition to these reasons factor contributing in failure of slope are properties of rock mass, (slope geometry), state of stress, temperature and erosion.
1.2 SOIL STABILIZATION
© 2017, IRJET | Impact Factor value: 6.171 | ISO 9001:2008 Certified Journal | Page 77
1.3 METHODS OF STABILIZATION
1. Mechanical method of Stabilization
In this procedure, soils of different gradations are mixed together to obtain the desired property in the soil. This may be done at the site or at some other place from where it can be transported easily. The final mixture is then compacted by the usual methods to get the required density.
2. Additive method of stabilization
It refers to the addition of manufactured products into the soil, which in proper quantities enhances the quality of the soil. Materials such as cement, lime, bitumen, fly ash, GGBS are used as chemical additives. Sometimes different fibers are also used as reinforcements in the soil.
2. TEST RESULTS:
2.1 SOIL PROPERTIES
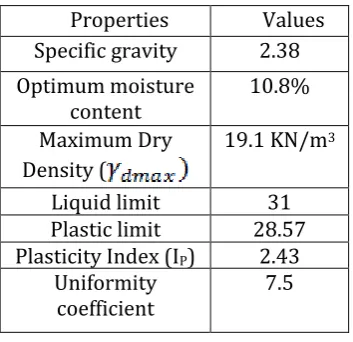
Soil characteristics were determined using Atterberg limits, Specific gravity, Sieve analysis, Standard proctor compaction test.
Properties
Values
Specific gravity
2.38
Optimum moisture
content
10.8%
Maximum Dry
Density (
19.1 KN/m
3Liquid limit
31
Plastic limit
28.57
Plasticity Index (I
P)
2.43
Uniformity
[image:2.595.311.558.84.241.2]coefficient
7.5
Table -1: Native soil properties
Based on the liquid limit and plastic limit values the soil is classified as follows:
IS Classification of Soil IP = 0.73 x (WL-20)
= 0.73 x (31-20) = 8.03
[image:2.595.313.558.279.440.2]Hence the soil is classified as low compressible silt as per IS classification
[image:2.595.74.251.393.564.2]Fig -1: Particle Size Distribution for Plain Soil
Figure -2: Liquid limit for the soil
Figure 4.3 Proctor compaction test curve
2.2 MAXIMUM DRY DENSITY AND OPTIMUM
MOISTURE CONTENT
2.2.1 GROUND GRANULATED BLAST FURNANCE
SLAG
The native soil has a maximum dry density and optimum moisture content of 19.1KN/m3 and 10.8%
[image:2.595.320.547.465.644.2]© 2017, IRJET | Impact Factor value: 6.171 | ISO 9001:2008 Certified Journal | Page 78 dry density and optimum moisture content has increased to
19.8 KN/m3 and 11%. The maximum dry density is obtained
[image:3.595.30.285.155.303.2]by adding 10% GGBS.
Table 4.2
Proctor compaction for GGBS
2.2.2 GLASS POWDER
The native soil has a maximum dry density and optimum moisture content of 19.1KN/m3 and 10.8%
respectively on adding Glass powder it was seen that the maximum dry density has increased to 20.2 KN/m3 and
optimum moisture content has decreased to 9%. The maximum dry density is obtained by adding 4% Glass powder.
Table 4.3
Proctor compaction for Glass powder
2.2.3 HYPO SLUDGE
The native soil has a maximum dry density and optimum moisture content of 19.1KN/m3 10.8% respectively on
adding Hypo Sludge it was seen that the maximum dry density has increased to 19.45 KN/m3 and Optimum
moisture content has decreased to 10.4%. The maximum dry density is obtained by adding 1% Hypo Sludge.
Table 4.4
Proctor compaction for Hypo sludge
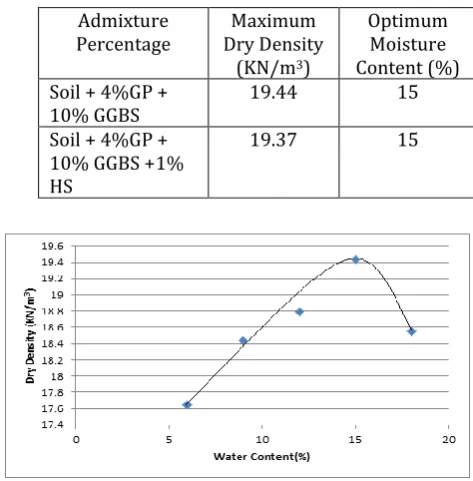
4.2.4MIX PROPORTIONS
The maximum dry density of soil and optimum moisture content has increased from 19.1 KN/m3 and 10.8% to 19.44
KN/m3 and 15% respectively on adding optimum percentage
of Glass powder and GGBS.The maximum dry density of soil and optimum moisture content has increased from 19.1 KN/m3 and 10.8% to 19.37 KN/m3 and 15% respectively on
[image:3.595.326.563.241.482.2]adding optimum percentage of Glass powder, GGBS, and Hypo sludge.
[image:3.595.317.555.517.645.2]Table 4.5 Proctor compaction for Mix proportions
Figure 4.4 Proctor Compaction Test Curve for S+GGBS+GP
Figure 4.5 Proctor Compaction Test Curve for S+GGBS+GP+HS
4.3 DIRECT SHEAR TEST
The table shows the shear stress of soil of native soil and with admixtures. On adding glass powder it is seen that the shear stress is increased from 0.048 Kg/cm2 to 0.084
Kg/cm2 for normal stress of 0.5 Kg/cm2. On adding GGBS the
shear stress increases from 0.048Kg/cm2 to 0.080Kg/cm2 for
normal stress of 0.5 Kg/cm2. On adding Hypo sludge the
Admixture
Percentage Maximum Dry Density (KN/m3)
Optimum Moisture Content
(%)
Soil + 2% GGBS 19 12
Soil + 4% GGBS 19.02 9 Soil + 6% GGBS 18.84 9 Soil + 8% GGBS 19.51 12 Soil + 10% GGBS 19.8 11 Soil + 12% GGBS 19.65 12
Admixture
Percentage Dry Density Maximum (KN/m3)
Optimum Moisture Content (%) Soil + 1% HS 19.45 10.4 Soil + 2% HS 18.99 12 Soil + 4% HS 18.32 15
Admixture
Percentage Density (KN/mMaximum Dry 3)
Optimum Moisture Content (%) Soil + 2% GP 19.45 12 Soil + 4% GP 20.02 9 Soil + 6% GP 19.6 11
Admixture
Percentage Dry Density Maximum (KN/m3)
Optimum Moisture Content (%) Soil + 4%GP +
10% GGBS 19.44 15
Soil + 4%GP + 10% GGBS +1% HS
© 2017, IRJET | Impact Factor value: 6.171 | ISO 9001:2008 Certified Journal | Page 79 shear stress increases from 0.048Kg/cm2 to 0.091Kg/cm2 for
normal stress of 0.5 Kg/cm2.
Admixture
Percentage Normal Stress (Kg/cm2) Shear Stress (Kg/cm2)
Plain soil 0.2 0.5 0.7
0.035 0.048 0.091 Soil + 4% Glass
powder 0.2 0.5 0.7
0.041 0.084 0.11 Soil + 10% GGBS 0.2
0.5 0.7
0.033 0.080 0.112 Soil + 1% HS 0.2
0.5 0.7
[image:4.595.311.559.86.218.2]0.037 0.091 0.114
Table 4.6
Direct shear test for soil and industrial wastesFigure 4.6 Mohr coulomb envelopes for plain soil
From Graph,
Cohesion, C = 0.014 kg/cm2
= 1.37 KN/m2
[image:4.595.310.558.318.438.2]Angle of Internal Friction, ϕ = 20o
Figure 4.7 Mohr coulomb envelope for soil with glass powder
From Graph,
Cohesion, C = 0.02 kg/cm
2= 1.96 KN/m
2Angle of Internal Friction, ϕ = 33
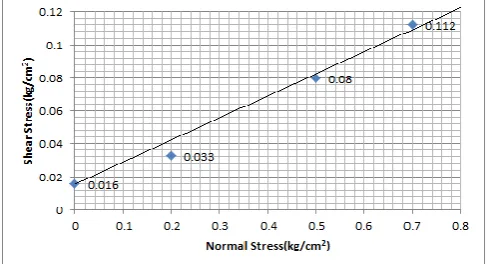
oFigure 4.9 Mohr coulomb envelope for soil with GGBS
From Graph,
Cohesion, C = 0.016 kg/cm2
= 1.56 KN/m2
Angle of Internal Friction, ϕ = 36o
Figure 4.10 Mohr coulomb envelope for soil with Hypo sludge
From Graph,
Cohesion, C = 0.014 kg/cm2
= 1.37 KN/m2
Angle of Internal Friction, ϕ = 34o
4.3.1 MIX PROPORTIONS
The table shows the shear stress of soil of native soil and with admixtures. On adding glass powder and GGBS it is seen that the shear stress is increased from 0.048 Kg/cm2 to
0.081 Kg/cm2 for normal stress of 0.5 Kg/cm2. On adding
GGBS+GP+HS the shear stress increases from 0.048Kg/cm2
to 0.080Kg/cm2 for normal stress of 0.5 Kg/cm2.
Admixture
Percentage Normal Stress (Kg/cm2)
Shear Stress (Kg/cm2)
Soil + 4% Glass powder + 10% GGBS 0.2 0.5 0.7 0.043 0.081 0.12 Soil + 4% Glass
powder + 10% GGBS + 1% Hypo sludge 0.2 0.5 0.7 0.036 0.080 0.119
[image:4.595.38.285.328.457.2] [image:4.595.40.281.553.685.2]© 2017, IRJET | Impact Factor value: 6.171 | ISO 9001:2008 Certified Journal | Page 80
Figure 4.11 Mohr coulomb envelope for soil with GP and GGBS
From Graph,
Cohesion, C = 0.02 kg/cm2
= 1.96 KN/m2
[image:5.595.40.285.81.219.2]Angle of Internal Friction, ϕ = 30o
Fig 4.12 Mohr coulomb envelope for soil with GP, GGBS, and Hypo sludge
From Graph,
Cohesion, C = 0.01 kg/cm2
= 0.981 KN/m2
Angle of Internal Friction, ϕ = 33o
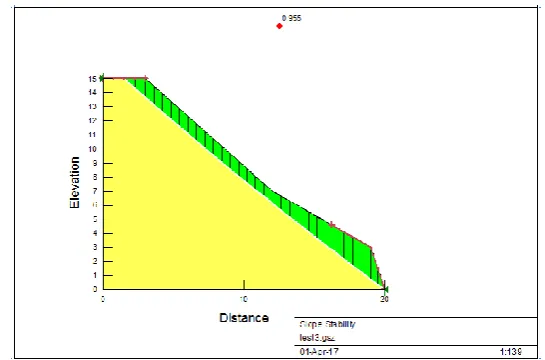
4.4CRITICAL SLIP SURFACES
4.4.1 PLAIN SOIL
[image:5.595.35.290.307.433.2]Fig 4.13 Critical Slip Surface with pore pressure for Plain soil
Fig 4.14 Critical Slip Surface without pore pressure for Plain soil
4.4.2 SOIL WITH GLASS POWDER
[image:5.595.309.562.320.495.2]Fig 4.15 Critical Slip Surface with pore pressure for S+GP
[image:5.595.309.559.534.703.2]© 2017, IRJET | Impact Factor value: 6.171 | ISO 9001:2008 Certified Journal | Page 81
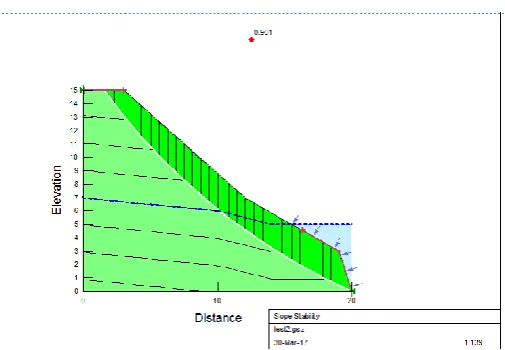
[image:6.595.46.554.38.762.2]4.4.3 SOIL WITH GGBS
[image:6.595.303.576.83.263.2]Fig 4.17 Critical Slip Surface with pore pressure for S+GGBS
Fig 4.18 Critical Slip Surface without pore pressure for S+GGBS
4.4.4 SOIL WITH HYPO SLUDGE
Fig 4.19 Critical Slip Surface with pore pressure for S+HS
Fig 4.20 Critical Slip Surface without pore pressure for S+HS
4.4.5 SOIL WITH GLASS POWDER AND GGBS
Fig 4.21 Critical Slip Surface with pore pressure for S+GP+GGBS
[image:6.595.308.561.323.509.2] [image:6.595.28.558.508.752.2]© 2017, IRJET | Impact Factor value: 6.171 | ISO 9001:2008 Certified Journal | Page 82
[image:7.595.310.557.203.299.2]4.4.6 SOIL WITH GLASS POWDER + GGBS + HYPO SLUDGE
[image:7.595.311.558.462.572.2]Fig 4.23 Critical Slip Surface with pore pressure for S+GP+GGBS+HS
Fig 4.24 Critical Slip Surface without pore pressure for S+GP+GGBS+HS
4.5DISCUSSIONS
1. Comparison between MDD of Soil with Industrial Wastes
The maximum dry density was obtained when 4% of glass powder was added. Other wastes showed significant increase in dry density with respect to that of native soil. This is due to excessive bonding of glass powder with soil
Chart -1: Variation of Max dry density of Soil with Industrial Wastes
2. Variation of Cohesion of soil with Industrial wastes
Maximum cohesion value of 1.96 KN/m2 is obtained while
adding glass powder and GP+GGBS. This is due to less optimum moisture content of glass powder with soil. While adding it along with GGBS it showed similar values of cohesion. Hypo sludge and its combinations were not significant they had same cohesion values as that of native soil.
Chart -2: Variation of Cohesion of soil with Industrial wastes
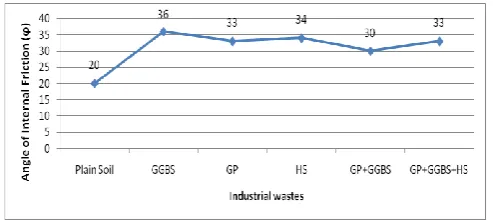
3. Variation of Angle of Internal friction of soil with Industrial wastes
Maximum angle of internal friction of 36⁰ is obtained when GGBS is added to soil. This is generally due to low optimum moisture content of GGBS with soil. Even in case of glass powder there was only a fraction of decrease in angle. The angle increased variably with respect to native soil on adding other admixtures.
Chart -3: Variation of Angle of internal friction of soil with Industrial wastes
4. Variation of Factor of safety of slope with Industrial waste (With pore pressure)
© 2017, IRJET | Impact Factor value: 6.171 | ISO 9001:2008 Certified Journal | Page 83
Chart -4:Variation of factor of safety of slopes with industrial wastes under pore water pressure conditions
5. Variation of Factor of safety of slope with Industrial waste (Without pore pressure)
Maximum factor of safety of 1.033 is obtained when 10% of GGBS is added to soil.This is due to the larger angle of internal friction values of the admixture with soil. The factor of safety increased significantly on adding ad mixtures.
Chart -5: Variation of factor of safety of slopes with industrial wastes under normal conditions
3. CONCLUSIONS
1. Based on proctor compaction of soil with industrial wastes, it was found that the Maximum dry density of soil increased by 3.66%, 4.81%, and 0.89% on adding GGBS, Glass powder, Hypo sludge respectively. When these were used in combinations the maximum dry density increased on a small margin viz. 1.78% and 1.41% for GGBS+GP and GGBS+GP+HS respectively.
2. Based on Direct Shear tests with the industrial wastes, the cohesion value increased by 13.86%, 43.06%, 0%, 43.06% for GGBS, Glass powder, Hypo Sludge, GGBS+GP respectively. In case of GP+GGBS+HS the cohesion value decreased by 28.39%. The angle of internal friction increased by 80%, 65%, 70%, 50%, and 65% for GGBS, Glass powder, Hypo Sludge, GGBS+GP, GGBS+GP+HS respectively.
3. On determining the factor of safety of soil with industrial wastes from geo studio under pore waster
pressure conditions it was found that the factor od safety increased by 88.75%,74.61%, 74.41%, 56.97%, and 63.56% for GGBS, Glass powder, Hypo Sludge, GGBS+GP, GGBS+GP+HS respectively. In case of normal conditions the factor of safety increased by 93.80%, 79.17%, 79.17%, 61.91%, and 66.79% GGBS, Glass powder, Hypo Sludge, GGBS+GP, GGBS+GP+HS respectively.
Over all it can be concluded that on using industrial wastes with soil it provides a significant increase in factor if safety, hence they can be used for small slopes along such as railways embankments, along river banks etc. Since they also have good Maximum Dry Density they can be used for construction of small structures.
REFERENCES
[1] K., Dr. S. K. Prasad, Dr. P. Nanjundaswamy(JULY-2016), “Critical Analysis of Slope Stability Analysis Methods”, International Journal of Engineering Research & Technology (IJERT) Vol. 5 Issue 07.
[2] Amritha R, K V Manjunath and Dr R Prabhakara (AUG-2015),“Effect of Slope Stability on Stabilized Soil due to Earthquake Loads using GeoStudio, International Research Journal of Engineering and Technology (IRJET) Volume: 02 Issue: 05.
[3] K. Mahendran and N. P. Vignesh, “Utilization of Hypo Sludge for the Stabilization of Red Soils along with Cement and Molasses”, Indian Journal of Science and Technology Volume 9(2) January 2016.
[4] Mrs.M.Usha, “Soil Stabilization for pavement using lime and Hypo Sludge”, International Journal of Advanced Research Trends in Engineering and Technology (IJARTET) Vol. 3, Special Issue 2, March 2016.