https://doi.org/10.5194/hess-21-4347-2017 © Author(s) 2017. This work is distributed under the Creative Commons Attribution 3.0 License.
An assessment of the performance of global rainfall estimates
without ground-based observations
Christian Massari1, Wade Crow2, and Luca Brocca1
1Research Institute for Geo-Hydrological Protection, National Research Council, Perugia, Italy
2United States Department of Agriculture – Hydrology and Remote Sensing Laboratory, Beltsville, Maryland, USA
Correspondence to:Christian Massari ([email protected]) Received: 21 March 2017 – Discussion started: 10 April 2017
Revised: 10 July 2017 – Accepted: 1 August 2017 – Published: 5 September 2017
Abstract. Satellite-based rainfall estimates over land have great potential for a wide range of applications, but their validation is challenging due to the scarcity of ground-based observations of rainfall in many areas of the planet. Recent studies have suggested the use of triple collocation (TC) to characterize uncertainties associated with rainfall estimates by using three collocated rainfall products. However, TC re-quires the simultaneous availability of three products with mutually uncorrelated errors, a requirement which is difficult to satisfy with current global precipitation data sets.
In this study, a recently developed method for rainfall estimation from soil moisture observations, SM2RAIN, is demonstrated to facilitate the accurate application of TC within triplets containing two state-of-the-art satellite rain-fall estimates and a reanalysis product. The validity of differ-ent TC assumptions are indirectly tested via a high-quality ground rainfall product over the contiguous United States (CONUS), showing that SM2RAIN can provide a truly inde-pendent source of rainfall accumulation information which uniquely satisfies the assumptions underlying TC. On this basis, TC is applied with SM2RAIN on a global scale in an optimal configuration to calculate, for the first time, reliable global correlations (vs. an unknown truth) of the aforemen-tioned products without using a ground benchmark data set.
The analysis is carried out during the period 2007–2012 using daily rainfall accumulation products obtained at 1◦×1◦ spatial resolution. Results convey the relatively high perfor-mance of the satellite rainfall estimates in eastern North and South America, southern Africa, southern and eastern Asia, eastern Australia, and southern Europe, as well as comple-mentary performances between the reanalysis product and SM2RAIN, with the first performing reasonably well in the
Northern Hemisphere and the second providing very good performance in the Southern Hemisphere.
The methodology presented in this study can be used to identify the best rainfall product for hydrologic models with sparsely gauged areas and provide the basis for an optimal integration among different rainfall products.
1 Introduction
of high-quality (and sufficiently dense) ground-based rainfall instrumentation (e.g. rain gauge and radars).
Many studies (e.g. Ebert et al., 2007; Sapiano and Arkin, 2009; Tian et al., 2007; Stampoulis and Anagnostou, 2012) have investigated error associated with remotely sensed pre-cipitation products by comparing their estimates with those collected by ground-based observations assuming they rep-resent the zero-error rainfall. However, the physical char-acteristics of precipitation, particularly at finer spatial and temporal resolutions, necessitate frequent, systematic and sufficiently dense validation measurements – requirements that are often not met within data-scarce regions of Africa, Asia and South America. Indeed, despite their relative accu-racy, the distribution of available gauges significantly varies around the world. Much of the land surface (representing 25– 30 % of the Earth’s surface) have measurement networks, al-though those networks with good gauge densities are limited (Kidd et al., 2017).
The current networks of surface observations are therefore often insufficient for the quantitative assessment of the error associated with satellite rainfall estimates. Moreover, despite the relatively higher accuracy of rainfall estimates that can be obtained by rain gauges, they are not error-free (Peter-son et al., 1998; Villarini et al., 2008). Therefore, evaluating the performance of different satellite rainfall products with ground-based observations is challenging due to the scarcity of such observations and of the inherent error contained in their estimates.
Based on the work of Adler et al. (2009), Tian and Peters-Lidard (2010) estimated the uncertainties of satellite rainfall estimates by using the measurement spread of coincidental and collocated estimates from an ensemble of six different satellite-based data sets, thus providing a globally consistent methodology that does not require ground-based validation data. The analysis yielded a lower bound estimate of the un-certainties, and a consistent global view of the error charac-teristics and their regional and seasonal variations. However, the authors showed that the analysis is able to provide only a relative estimation of the measurement uncertainties because these data sets are not entirely independent measurements.
An alternative approach for assessing the quality of satel-lite rainfall products was proposed by Roebeling et al. (2012) and Alemohammad et al. (2015) based on the triple collo-cation (TC) method (Stoffelen, 1998). The first applicollo-cations of TC concerned geophysical variables such as ocean wind speed and wave height (Stoffelen, 1998). More recently, it has been used extensively to estimate errors in soil mois-ture (SM) products (Crow and Van Den Berg, 2010; Miralles et al., 2010; Dorigo et al., 2010; Draper et al., 2013; Su et al., 2014; Gruber et al., 2016). Given three estimates of the same variable, the main assumptions of the method are the (i) sta-tionarity of the statistics, (ii) linearity between the three esti-mates (vs. the same target) across all timescales and (iii) ex-istence of uncorrelated error between the three estimates.
In the work of Roebeling et al. (2012), the authors deter-mined the spatial and temporal error characteristics of three precipitation data sets over Europe (a visible/near-infrared data set, a weather radar data set and gridded rain gauge products) showing that it can provide realistic error esti-mates. The authors ensured a Gaussian distribution of the error by averaging the data set over a sufficiently long pe-riod (10 days) and re-gridding to a sufficiently low spatial resolution (0.25×0.25◦). Alemohammad et al. (2015) ap-plied TC to 14-day cumulated rainfall estimates derived from satellite, gauges, radars and models in order to retrieve the er-ror and the correlation of each data set in the United States. They also proposed the use of a logarithmic (i.e. multiplica-tive) error model which almost certainly provides a more realistic description of rainfall accumulation errors at fine space/timescales. In addition, they calculated the theoretical correlation of each product with the unknown truth by using the extended TC (ETC) (McColl et al., 2014) by analysing the covariance matrix of the three data sets.
TC can theoretically provide error and correlations of three products (a triplet) without use of ground-based observations – provided that each of the three products is afflicted by mu-tually independent errors. However, given that state-of-the-art satellite rainfall products use a highly overlapping set of common sensors for the retrieval of rainfall (see Sect. 2.1, for further details), there is an inherent difficulty in obtaining triplets with mutually independent errors. Therefore, addi-tional – highly independent – sources of rainfall accumula-tion estimates are needed.
Recently, Brocca et al. (2014) developed a method for es-timating rainfall accumulation amounts directly from satel-lite SM observations based on the principle that the soil can be treated as a “natural rain gauge”. In contrast with classical satellite rainfall products, this new bottom-up ap-proach attempts to measure rainfall by calculating the dif-ference between two successive SM measurements derived from a satellite SM product. In this respect, SM2RAIN of-fers a unique opportunity for applying the TC analysis be-cause, being wholly independent of any other rainfall esti-mate, it can be used in place of a ground-based product. This opportunity has not yet been explored and could provide an appropriate basis for applying TC on a global scale without requiring the availability of ground-based rainfall accumula-tion data.
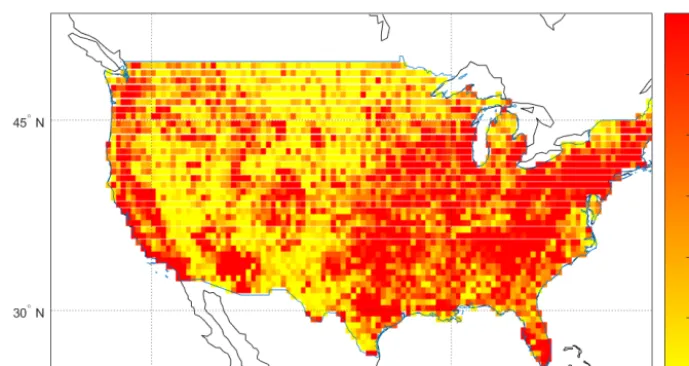
“un-Figure 1.CPC gauge coverage during 2007–2012 expressed as average number of working rain gauges per day within each 0.25◦spatial grid cell.
known” truth (ETC; McColl et al., 2014), the assessment of the products will be carried out in terms of correlation against “true” rainfall values. As a result, the word “performance” and “TC results” will be hereinafter referred to this correla-tion (addicorrela-tional clarificacorrela-tion is provided in Sect. 2.3).
An assessment of the reliability of subsequent TC results is conducted by direct comparison with the analogous eval-uation results obtained via direct comparisons with the Cli-mate Prediction Center (CPC) Unified Gauge-Based Analy-sis of Global Daily Precipitation (hereafter as CPC) product. These assessments will be carried out with and without the use of SM2RAIN rainfall accumulation products to isolate the value of SM-based rainfall estimates for the evaluation of global rainfall products. Note that, given the number of com-mon sensors shared by CMORPH and TMPA 3B42RT, the application of TC to the triplet containing both products will serve to demonstrate the difficulties of using both of them in the same triplet within the TC analysis and evaluate the potential benefits of utilizing SM2RAIN-based accumulation products in a TC analysis.
The paper is organized as follows. Section 2 contains data and methods; in particular, the products used for the analysis are described in Sect. 2.1, the theoretical background for TC is in Sect. 2.2 and 2.2.1, the description of the performance scores used for the evaluation of the results is discussed in Sect. 2.3, and Sects. 2.4 and 2.5 describe SM2RAIN and the experiment setup. Results are presented and discussed in Sect. 3 and final remarks are presented in Sect. 4.
2 Data and methods
2.1 Rainfall and soil moisture products 2.1.1 CPC
The 0.5◦×0.5◦gauge-based CPC product is used to evalu-ate the sevalu-atellite-based rainfall estimevalu-ates over the CONUS and verify evaluations provided by TC. Given the high rain gauge density associated with this product across CONUS (Fig. 1), along with the common practice of using ground-based rain-fall data to validate satellite-based rainrain-fall retrievals (Huff-man et al., 1997), CPC is expected to provide a reasonable proxy of true rainfall accumulation over the CONUS. Never-theless, this assumption will be verified below. Figure 1 illus-trates that the spatial density of CPC gauge coverage (calcu-lated as average number of rain gauge observations per day) during 2007–2012 is high in the Eastern CONUS and along the western coast of CONUS but relatively lower in many parts of the central CONUS. CPC rainfall observations are aggregated to a 1◦×1◦spatial resolution by simple averag-ing.
2.1.2 ASCAT data
[image:3.612.125.470.64.247.2]val-ues. Here, we used the ASCAT data set produced using the Soil Water Retrieval Package (WARP) (Naeimi et al., 2009) (v5.5) from Vienna University of Technology (TU-Wien), and distributed as SM product H109 by the EUMETSAT Satellite Application Facility on Support to Operational Hy-drology and Water Management (H-SAF). Prior to the ap-plication of SM2RAIN to ASCAT data, the points character-ized by a surface state flag (SSF) of the ASCAT product that indicates frozen (SSF=2), temporary melting/water on the surface (SSF=3) or permanent ice (SSF=4) were excluded from the analysis. For further details about the application of SM2RAIN to ASCAT, the reader is referred to Sect. 2.4. 2.1.3 TMPA 3B42RT
TMPA 3B42RT, version 7 (http://trmm.gsfc.nasa.gov), com-bines rainfall estimates from various satellite sensors. The multisatellite platform uses the TRMM Microwave Imager (TMI) on board of TRMM satellite, the Special Sensor Mi-crowave Imager (SSM/I) on board the Defense Meteoro-logical Satellite Program (DMSP) satellites, the Advanced Microwave Scanning Radiometer for Earth observing sys-tem (AMSRE) on board the National Aeronautic and Space Administration (NASA) AQUA satellite, the Advanced Mi-crowave Sounding Unit-B (AMSU-B) on board the National Oceanic and Atmospheric Administration (NOAA) satellite series and GEO IR rainfall estimates. The TMPA 3B42RT estimates are produced in three steps: (1) the PMW esti-mates are calibrated with sensor-specific versions of the God-dard Profiling Algorithm (GPROF; Kummerow et al., 1996) and combined, (2) IR rainfall estimates are created using the PMW estimates for calibration, and (3) PMW and IR esti-mates are then combined. The 3B42RT product is provided by NASA with a temporal resolution of 3 h and a spatial reso-lution of 0.25◦. The cumulated daily rainfall, available from March 2000, is obtained by simply summing the eight 3 h time windows for each day. The global coverage of the prod-uct is+50◦/−50◦latitude. To match the CPC spatial resolu-tion, collocated TMPA 3B42RT estimates are aggregated to 1◦spatial resolution by simple averaging.
2.1.4 CMORPH
CMORPH uses a Lagrangian approach to construct high-resolution global precipitation maps from the satellite IR and PMW observations (Joyce et al., 2004). This technique uses precipitation estimates that have been derived from PMW ob-servations exclusively, and whose features are transported via spatial propagation information which is obtained entirely from IR data. It incorporates precipitation estimates derived from the PMW on board of the DMSP 13, 14 and 15 (SSM/I) and NOAA-15, 16, 17 and 18 (AMSU-B) satellites as well as AMSR-E and TMI aboard NASA’s Aqua and TRMM space-craft, respectively. Precipitation estimates are obtained as fol-lows. First, advection vectors of cloud and precipitation
sys-tems are computed using consecutive geostationary IR im-ages in 30 min intervals. These advection vectors are then ap-plied to propagate the precipitating cloud systems observed by the PMW measurements along the advection vectors in both forward and backward directions toward the target time of the precipitation analysis. The final precipitation analysis value at a grid box is defined as the weighted mean of the estimates from the forward and backward propagations with the weights inversely proportional to the time separation be-tween the target analysis time and the PMW observations. In this study, we used the daily (derived from 3-hourly aggre-gation) estimates of precipitation at 0.25◦latitude/longitude resolution, distributed over the globe (+60◦/−60◦of lati-tude) by the NOAA Center for Weather and Climate Predic-tion. Note that the CMORPH version used in this study is the raw version which does not use gauge information. To match the CPC spatial resolution, collocated CMORPH estimates are aggregated to 1◦spatial resolution.
2.1.5 ERA-Interim
The European Centre for Medium-Range Weather Fore-casts (ECMWF) produces the ERA-Interim atmospheric, ocean and land reanalysis. ERA-Interim provides medium-range global forecasts for environmental variables including soil temperature, evaporation, SM and rainfall. Products are available from 1 January 1979 to now. The forecast model incorporated in the ERA-Interim reanalysis is based on the ECMWF Integrated Forecast System (Cy31r2) forecast model (Dee et al., 2011), with a spectral horizontal resolution of about 80 km and 60 vertical levels. The ERA-Interim fore-cast precipitation is the sum of two components which are computed separately in the model: large-scale stratiform pre-cipitation (Tompkins et al., 2007) and smaller-scale precip-itation which originates solely from the parameterization of convection (Bechtold et al., 2004). Further information can be found at the ECMWF website (http://www.ecmwf.int). In this study, daily precipitation values are obtained from the temporal aggregation of ERA-Interim 12-hourly precipita-tion accumulaprecipita-tion estimates (http://apps.ecmwf.int/datasets/) while co-location with CPC observations is determined by the nearest-neighbour method. Note that we considered only liquid precipitation in the analysis. Solid precipitation were excluded by masking out periods experiencing snowfall (us-ing the “large-scale snowfall” variable of ERA-Interim). 2.2 TC analysis: general concepts
Here we apply the method of McColl et al. (2014) to robustly estimate the correlation of a particular rainfall measurement system with the truth. Suppose we have three systemsXi,
measuring the true variabletand afflicted by additive random error
whereXi (i=1, 2, 3) are collocated measurement systems
linearly related to the true underlying valuet with additive random errorsεi, andαiandβiare the ordinary least squares
intercepts and slopes. Assuming that the errors from each system have zero mean (E(εi)=0), are mutually
uncorre-lated (Cov(εi, εj)=0, withi6=j) and orthogonal with
re-spect tot (Cov(εi, t )=0), the covariance betweenXi is
Qij=Cov(Xi, Xj)=
βiβjσt2, fori6=j
βi2σt2+σε2
i, fori=j.
(2) By defining the new variableθi=βiσt, known as the
sen-sitivity of the variableXi, Eq. (2) becomes
Qij=
(
θiθj, i6=j
θi2+σε2
i, fori
=j, (3)
which is a system of six equations in six unknowns from which we derive (McColl et al., 2014):
σε=
r
Q11−
Q12Q13
Q23 r
Q22−
Q12Q23
Q13 r
Q33−
Q12Q23
Q12 . (4)
From Eq. (2), using the definition of the correlation and covariance we can write
θi=ρt,Xi
p
Qii, (5)
whereρt,Xi is the correlation coefficient betweent andXi.
Since√Qiiis already estimated from the data, and we can
solve forθi using Eq. (4),ρt,Xi(McColl et al., 2014):
ρt,X= ±
r
Q12Q13
Q11Q23
sign(Q13Q23) r
Q12Q23
Q13Q22
sign(Q12Q23) r
Q13Q23
Q12Q33 , (6)
which provides the temporal correlation of each product with the unknown truth. Hereinafter, when talking aboutρt,Xi or
its squared value ρt,Xi
2, we will refer to the correlation of the productXi with the unknown truth.ρ will be also used
to refer to this variable but in more general terms. 2.2.1 Rainfall error model
It is generally accepted that a multiplicative model is more appropriate for describing errors in rainfall estimates (Hos-sain and Anagnostou, 2006; Tian et al., 2013). Based on this assumption, Alemohammad et al. (2015) proposed the appli-cation of TC to the rainfall by introducing a multiplicative error model:
Ri=aiTβieεi, (7)
in whichR is the rainfall intensity estimate from producti,
T is the true rainfall intensity andaiis a multiplicative error.
By transforming Eq. (7) in the log space we obtain an equa-tion equivalent to Eq. (1), whereX=log(R),t=log(T )and
αi=log(ai). In this way, the development of TC expressed
in Eqs. (2)–(6), can be applied to the – potentially more rel-evant – case of multiplicative rainfall accumulation errors. The resulting log RMSE can then be back-transformed into linear rainfall accumulation errors by exploiting a Taylor se-ries expansion of the logarithm operator (see Alemohammad et al., 2015 for further details).
The main difficulty of this approach is its inability to con-sider the presence of zero values in the rainfall time series. To reduce their presence, Alemohammad et al. (2015) con-sidered fortnightly rainfall estimates and simply removed re-maining zeros in this time series. This has two implications. First, the fortnightly rainfall error may differ from the error of a shorter accumulation period (e.g. daily) because the daily signal has a substantially different character with respect to the fortnightly one due to the higher presence of zero values. Second, the method may not be appropriate in very dry cli-mates, where even fortnightly values of rainfall can contain a significant number of zero accumulation values.
For the reasons mentioned above, we apply TC in two dif-ferent ways: (i) to the rainfall time series using an additive er-ror model and (ii) to log-transformed rainfall estimates using the multiplicative error model (by first removing rainfall ac-cumulation values equal to zero). Comparisons of these two different approaches will provide insights regarding the ap-propriateness of various error model assumptions for rainfall estimates at a daily accumulation timescale.
2.3 Performance scores
In Sect. 2.2, it has been demonstrated that TC can provide both error variances and correlation against an unknown truth for three collocated estimates of the same variable. When dealing with error variances, the products have to be rescaled to a common reference data space. However, such a rescal-ing imposes spatial patterns within the derived error metric which reflects the climatology of the chosen reference (Gru-ber et al., 2016). To this end, McColl et al. (2014) noted that correlation coefficients can provide important new informa-tion about the performance of the measurement systems with respect to the absolute error variances obtained via Eq. (4) with the added advantage of not requiring the arbitrary def-inition of one system as a scaling reference. Indeed,ρ2 rep-resents the unbiased signal to noise ratio, scaled between 0 and 1, which provides a measure of the relative similarity between two signals, independently from their phase differ-ences. This was also underlined by Gruber et al. (2016), who showed thatρ2is the complement of thefRMSE=σε2/σ2
ref-erence. Gruber et al. (2016) also pointed out that the absolute error variance provides only limited information about the true data set quality because a certain amount of noise can be either acceptable or unacceptable depending on the strength of the underlying signal (i.e. its variance). Therefore, we fo-cus here only onρ2or, analogously, on its root squareρ, i.e. Eq. (6).
As discussed above, a key goal is determining the rela-tive accuracy of TC correlations obtained with and without the use of SM2RAIN-based rainfall accumulation products. Assuming thatRXi (or simplyR) is the Pearson correlation
coefficient between the productXiand CPC, the main
ques-tion is, how accurately can (TC-based)ρt,Xi, which utilize
no ground observations, reproduce spatial patterns in (CPC-based)RXi? We should expect a bias between the two (i.e. RXi≤ρt,Xi) because – while relatively accurate – CPC
es-timates still contain representativeness errors (due to limita-tions in rain gauge density) and measurement errors due to wind and instrument inaccuracies. In contrast, Eq. (6) pro-vides the correlations with an error-free truth. Nevertheless, if the TC hypothesis holds, the relative rank between the products predicted by TC should accurately reflect that ob-tained via direct comparisons with ground observations.
In order to evaluate the similarity between correlation-based maps of ρt,Xi andRXi a spatial correlation index SC
was calculated as the spatial Pearson correlation coefficient between maps ofRXi andρt,Xi. The closer SC is to 1, the
more spatially similar the two maps are and the more satis-fied the assumptions of TC. In addition, based on the values ofρt,Xi andRXi, we are able to sort the products according
to their relative performance for each pixel in the analysis. That is, considering three productsXi, the rank value to be
assigned to each product i will be 1 ifρt,Xi is the highest,
3 if it is the lowest and 2 if it is neither. If the same is done withRXi, the consistency of the resulting rank maps for each
product provide feedback regarding the validity of assump-tions underlying the application of TC. For the quantification of the discrete maps, we also calculate the number of pixels providing equivalent relative sorting of the products based on
RXivs.ρt,Xi.
2.4 SM2RAIN and its application to ASCAT data SM2RAIN (Brocca et al., 2014) is a method of rainfall esti-mation which uses two successive SM retrievals to estimate the rainfall accumulated between the two retrievals. It ex-ploits the soil water balance equation with appropriate sim-plifications valid only for liquid precipitation (Tian et al., 2014):
Z∗ds(τ )/dτ =p(τ )−r(τ )−e(τ )−g(τ ), (8) where Z∗ is the soil water capacity (soil depth times soil porosity), s(τ )is the relative saturation of the soil or rela-tive SM; τ is the time; and p(τ ),r(τ ),e(τ ) andg(τ ) are the rainfall, surface runoff, evapotranspiration and drainage
rates, respectively. Under unsaturated soil conditions, and as-suming negligible evapotranspiration rate during rainfall and Dunnian runoff, solving Eq. (8) for rainfall yields
p(τ )=Z∗ds(τ )/dτ+as(τ )b. (9)
Note that in Eq. (9) the drainage rate has been expressed with a power law function of the typeg=asb (Famiglietti and Wood, 1994), whereaandbare two model parameters. When the soil is fully saturated, no rainfall can be estimated from SM; however, at the scale of satellite pixel, the soil is rarely saturated (except in some exceptional places like trop-ical forests).
The SM2RAIN parametersa,bandZ∗can be estimated either by using a rainfall data set as a reference or assigned based on soil properties. In this study, in order to maximize the independence of SM2RAIN predictions, SM2RAIN pa-rameters were not calibrated and were instead assumed con-stant in space as in Koster et al. (2016). In particular, the drainage rate (the second term in Eq. 9) was assumed lin-early related with SM (b=1) and a=3.7 mm day−1 and
Z∗=62 mm based on results obtained in previous studies (Brocca et al., 2014). Note thatZ∗does not have a significant influence on the results because we are using a correlation-based metric. In addition, it should be noted that, while maxi-mizing the independence of SM2RAIN rainfall accumulation estimates, the use of this default calibration approach results in sub-optimal SM2RAIN performance. Superior SM2RAIN can easily be obtainable via calibration against existing satel-lite rainfall accumulation products.
Daily rainfall estimates from SM2RAIN were obtained by using linearly interpolated (at 00:00 UTC) ASCAT data with a maximum allowable data gap of 5 days. The obtained 0.25◦×0.25◦rainfall estimates were then aggregated to the 1◦×1◦ spatial resolution through simple averaging of the collocated pixels with CPC. Finally, 1◦×1◦grid cells were masked if more than 50% of their sub-grid areas consisted of ASCAT observations characterized by a SSF equal to 2, 3 or 4. Hereinafter, the thus obtained product is referred to as SM2RAIN for simplicity.
2.5 Experimental setup
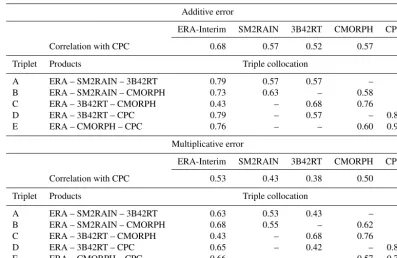
Table 1.Mean correlation with CPC (R) and TC-based correlation (ρ) for various triplets assuming additive and multiplicative error models. The “Triplet” column refers to the naming convention applied in the text.
Additive error
ERA-Interim SM2RAIN 3B42RT CMORPH CPC
Correlation with CPC 0.68 0.57 0.52 0.57 –
Triplet Products Triple collocation
A ERA – SM2RAIN – 3B42RT 0.79 0.57 0.57 – –
B ERA – SM2RAIN – CMORPH 0.73 0.63 – 0.58 –
C ERA – 3B42RT – CMORPH 0.43 – 0.68 0.76 –
D ERA – 3B42RT – CPC 0.79 – 0.57 – 0.87
E ERA – CMORPH – CPC 0.76 – – 0.60 0.91
Multiplicative error
ERA-Interim SM2RAIN 3B42RT CMORPH CPC
Correlation with CPC 0.53 0.43 0.38 0.50 –
Triplet Products Triple collocation
A ERA – SM2RAIN – 3B42RT 0.63 0.53 0.43 – –
B ERA – SM2RAIN – CMORPH 0.68 0.55 – 0.62 –
C ERA – 3B42RT – CMORPH 0.43 – 0.68 0.76 –
D ERA – 3B42RT – CPC 0.65 – 0.42 – 0.84
E ERA – CMORPH – CPC 0.66 – 0.57 0.79
As a result, they will only be used for initial considerations about TC robustness and to evaluate the relative quality of the CPC product. Triplets A, B and C will be then used in the remainder of the paper to demonstrate the potential utility of SM2RAIN.
The analysis was carried out first across CONUS and then on a global scale using only ERA-Interim, 3B42RT, CMORPH and SM2RAIN during the period 2007–2012. Over CONUS it was confirmed that the available sample size was sufficient (about 500) over the entire study domain (Gru-ber et al., 2016), while for the global analysis, grid cells with inadequate sample size were individually masked out of the analysis. The extended TC analysis was applied for both ad-ditive and multiplicative error model assumptions. For the latter, we first removed days with zero rainfall constituting about 80 % of daily values and leaving approximately 450 non-zero daily values in the 2007–2012 time series and then applied a log transformation to the remaining daily rainfall estimates. This reduction in sample size may affect TC re-sults by making the analysis with log-precipitation estimates statistically less robust.
3 Results and discussion
In this section, we present the results obtained from the appli-cation of TC (for both additive and multiplicative error mod-els) by following the subsequent methodological steps: (1) calculating TC-based correlations (ρt,Xi) for Triplets A, B,
C, D and E over the CONUS and providing an assessment of the CPC product (Sect. 3.1), (2) understanding the ade-quacy of TC results based on the spatial similarity between (TC-based)ρt,Xiand (CPC-based)RXi (along with their
rel-ative rank) over the CONUS in order to identify the optimal configuration for applying TC and (3) applying the optimal-configured TC on a global scale to calculateρt,Xi globally
for the selected rainfall products (Sect. 3.3). 3.1 Assessment of the CPC product
As described above, our first goal is to assess the relative performance of the CPC product. Table 1 shows meanρt,Xi
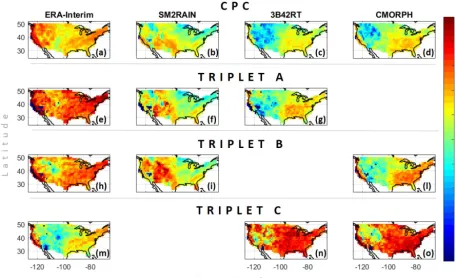
Figure 2.CPC-based(a–d)and TC-based(e–o)correlation coefficient obtained for the triplets: (i) ERA-Interim-SM2RAIN-3B42RT (Triplet A: e–g), (ii) ERA-Interim-SM2RAIN-CMORPH (Triplet B:h–l) and (iii) ERA-Interim-3B42RT-CMORPH (Triplet C:m–o) during the period 2007–2012 using an additive error model.
3.2 Optimal TC configuration
Figure 2a–d plot CPC-based Pearson correlation coeffi-cients (i.e. RXi) for ERA-Interim, 3B42RT, CMORPH and
SM2RAIN obtained with the assumption of additive error model (for multiplicative error model results the reader is referred to Fig. S1 of the Supplement). A comparison of these results with TC-based correlations (i.e. ρt,Xi) shows
that ρt,Xi are biased high with respect to RXi. This is
ex-pected given that CPC is not free of errors, whereas TC should theoretically provide the correlation with respect to an error-free truth.
The spatial agreement between ρt,Xi andRXi is
exam-ined in Table 2 and Fig. 2. In particular, Fig. 2 shows that Triplets A (panels e, f, g) and B (panel h, i, l) accurately reproduce CPC-based results plotted in Fig. 2a–d, although they are characterized by higher values as underlined above (see Sect. 2.3 for further details). This similarity is higher in the eastern and western US and lower in the central US es-pecially for ERA-Interim and SM2RAIN. This lower agree-ment in the central US is likely due to the lower rain gauge density of CPC here (see Fig. 1), which degrades the quality of the CPC product as benchmark. However, in contrast, TC results based on Triplet C predicts a substantial different be-haviour with correlation patterns which differ substantially relative to CPC-based benchmark results in Fig. 2a–d. This
suggests those triplets not containing SM2RAIN (or CPC) provide unreliable results. In particular, the simultaneous use of two satellite-based rainfall products in Triplet C leads to an overly optimistic assessment of their performance. This is likely due to cross-correlated errors in 3B42RT and CMORPH rainfall accumulation products which cause TC to misinterpret their mutual consistency as an indication of high accuracy (Yilmaz and Crow, 2014).
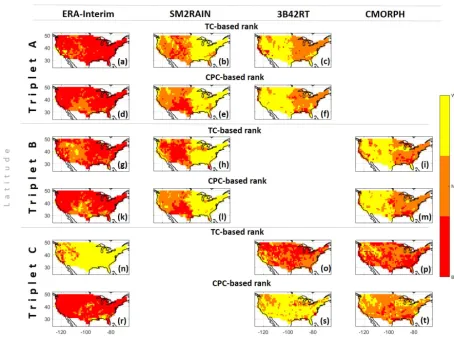
It is often important to understand which is the best rainfall product among those available in a specific location. As de-scribed in Sect. 2.3, we ranked the products based upon how well they compare relative to each other using bothRandρ. Figure 3 shows the distribution – three products at time (pan-els d–f, k–m, r–t) – of the relative rank based on comparisons with the (CPC-based)RXi of each triplet, while panels a–c,
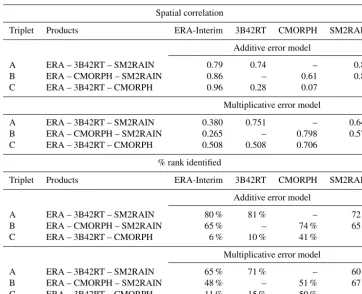
Table 2.Spatial correlation betweenρt,XiandRXiand percentage of rank correctly identified obtained for various triplets considered in the study. The “Triplet” column refers to the naming convention applied in the text.
Spatial correlation
Triplet Products ERA-Interim 3B42RT CMORPH SM2RAIN
Additive error model
A ERA – 3B42RT – SM2RAIN 0.79 0.74 – 0.84
B ERA – CMORPH – SM2RAIN 0.86 – 0.61 0.84
C ERA – 3B42RT – CMORPH 0.96 0.28 0.07 –
Multiplicative error model
A ERA – 3B42RT – SM2RAIN 0.380 0.751 – 0.648
B ERA – CMORPH – SM2RAIN 0.265 – 0.798 0.570
C ERA – 3B42RT – CMORPH 0.508 0.508 0.706
-% rank identified
Triplet Products ERA-Interim 3B42RT CMORPH SM2RAIN
Additive error model
A ERA – 3B42RT – SM2RAIN 80 % 81 % – 72 %
B ERA – CMORPH – SM2RAIN 65 % – 74 % 65 %
C ERA – 3B42RT – CMORPH 6 % 10 % 41 % –
Multiplicative error model
A ERA – 3B42RT – SM2RAIN 65 % 71 % – 60 %
B ERA – CMORPH – SM2RAIN 48 % – 51 % 67 %
C ERA – 3B42RT – CMORPH 11 % 15 % 50 % –
The same analysis carried out with the assumption of mul-tiplicative error model (see Fig. S2 in the Supplement) shows similar findings but larger differences between the spatial dis-tribution of the rank obtained with CPC and the one with TC, especially for Triplet B. To quantity this agreement, we have calculated the percentage of pixels which are ranked the same in both TC-band CPC results (% of rank identified in Table 2). The table confirms the patterns observed in Figs. 3 and S2 of the Supplement with Triplets A and B yielding the highest percentage of pixels with a common rank – rang-ing from 65 to 81 % for the additive error model, and 48 to 71 % for the multiplicative error model. As discussed above, inferior results are obtained in both cases for Triplet C (per-centage of correct ranking between 5 and 60 %).
A quantification of the agreement between the spatial vari-ations of the correlvari-ations both for additive and multiplicative error models was also derived by the use of the spatial cor-relation SC in Table 2. The table shows that for Triplets A and B, when TC is used with the assumption of additive er-ror model, SC is relatively high with values ranging from 0.61 to 0.84 while for Triplet C provides substantially lower SC for 3B42RT and CMORPH. A slightly different situation can be observed for the multiplicative error model. Here, SC values are generally lower than those obtained by TC (based on an assumed additive error model), likely due to the
neces-sity of removing zero-rain days, which modifies the original precipitation time series and reduces the sample size of TC calculations. In particular, ERA-Interim provides the worst score. This is not clearly evident in the spatial distribution of
R andρ (see Fig. S1 in the Supplement for further details) which show some similarities at least for Triplets A and B.
In summary, the application of TC to the different triplets shows the following:
1. CPC product performs relatively well over the CONUS with a TC-derived correlation vs. truth of 0.9 (assum-ing an additive error model) demonstrat(assum-ing its relatively high quality here and supporting its application as a benchmark data set within CONUS.
2. TC-based correlations are similar among the triplets except for Triplet C (i.e. ERA-Interim, 3B42RT and CMORPH). This is likely due to the existence of non-negligible cross-correlated errors between 3B42RT and CMORPH.
3. A comparison betweenρt,Xi andRXi shows thatρt,Xi
are biased high with respect toRXi. In addition, the
pat-tern ofρt,XiandRXiis similar for all triplets except for
Figure 3.Rank based on CPC-based correlation (CPC-based rank in the figure) and TC-based correlation (TC-based rank in the figure) of the triplets: (i) ERA-Interim-SM2RAIN-3B42RT (Triplet A:a–cfor TC-based rank andd–ffor CPC-based rank) , (ii) ERA-Interim-SM2RAIN-CMORPH (Triplet B:g–ifor TC-based rank andk–mfor CPC-based rank) and (iii) ERA-Interim-3B42RT-CMORPH (Triplet C:n–pfor TC-based rank andr–tfor CPC-based rank) during the period 2007–2012 using an additive error model.
terms of spatial correlation (Table 2), provides higher scores for an additive error model assumption relative to a multiplicative one. This is likely due to a reduction of sampling power associated with the removal of daily rainfall accumulations equal to zero, which are not ac-ceptable in the log-transformation process. Therefore, it is possible that the observed differences in TC perfor-mance may shrink for larger sample sizes.
4. Retrieved spatial patterns ofρt,Xi for the triplets
con-taining SM2RAIN (Fig. 2) show a higher degree of sim-ilarity with (CPC-based)RXi when we assume an
ad-ditive (vs. multiplicative) error model for daily rainfall accumulations.
On this basis, we can conclude that (i) TC results are un-reliable unless SM2RAIN is used in the triplets and (ii) the assumption of multiplicative error model in the application of TC at a daily timescale does not appear necessary.
3.3 Application of optimized TC approach
Based on the superior performance for Triplets A and B un-der the assumption of additive error model, we will apply this particular TC configuration approach to assess the per-formance (in terms ofρ) of daily rainfall accumulation es-timates derived from 3B42RT, CMORPH, SM2RAIN and ERA-Interim first over the CONUS (Sect. 3.3.1 and Fig. 2) and then on a global scale (Sect. 3.3.2 and Fig. 4).
3.3.1 CONUS
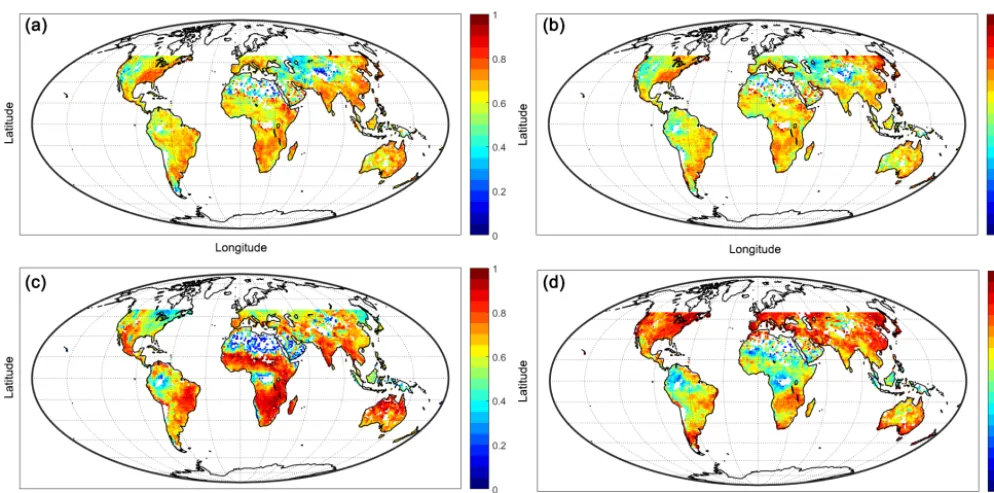
corre-Figure 4.Global correlation of the 3B42RT(a), CMORPH(b), SM2RAIN(c)and ERA-Interim(d)products obtained by TC using Triplet A (ERA-Interim-SM2RAIN-3B42RT) for 3B42RT, ERA-Interim and SM2RAIN and Triplet B (ERA-Interim-SM2RAIN-CMORPH) for CMORPH.
lations is similar to those found in Gottschalck et al. (2005) and Ebert et al. (2007), who showed a generally lower level of correlation of satellite-only rainfall products in the central US due to the effects of snow cover and frozen surface condi-tions. This corroborates results presented in Alemohammad et al. (2015) using TC, who found a similar pattern of correla-tion of 3B42RT in a box covering a large part of southeastern US (however, the authors here assumed a multiplicative error model and fortnightly rainfall accumulation estimates).
3.3.2 Global
On a global scale, 3B42RT (Fig. 4a) shows relatively good performances in eastern and central South America, south-ern and central Africa, southsouth-ern and eastsouth-ern Asia, eastsouth-ern Australia, and southern Europe, while it performs relatively worse in central Asia, western Australia and in the southern part of the Sahel. The performance of CMORPH (Fig. 4b) is similar to 3B42RT with slightly lower correlations in Aus-tralia, in the Horn of Africa and in southern Asia. SM2RAIN (Fig. 4c) performs reasonably well in Africa (except in the tropical forest), Australia, Mexico, eastern South America and India and generally in the Southern Hemisphere, while worse results are obtained in the Northern Hemisphere, in the tropical forests and at high latitudes. In contrast, ERA-Interim (Fig. 4d) provides much better results in the North-ern Hemisphere with respect to the south of the planet (e.g. South America and southern Africa) and performs relatively
poorly in central and northern Africa as well as in the tropical forests.
[image:11.612.49.546.63.309.2]dif-ferences between our study and the studies of Beck et al. (2017) and Yong et al. (2015) can likely be attributed to the quality of the benchmark data set used for the evaluations. This is the main limitation of rainfall validation studies re-lying upon ground-based observations for assessment. With our proposed TC-based approach, this issue can be overcome because ground observations are no longer required.
An interesting feature of the global evaluation of the prod-ucts (Fig. 4a–d), but also over the CONUS between 3B42RT (or CMORPH) and SM2RAIN (Fig. 2 triplets A and B), is the complementary nature of the products. Especially for Fig. 4c and d, it can be seen that ERA-Interim performs very well in the Northern Hemisphere and worse in the Southern Hemi-sphere, whereas SM2RAIN is relatively good in the south and worse in the Northern Hemisphere. Similar findings can be seen between the two state-of-the-art satellite rainfall products (i.e. 3B42RT and CMORPH) and SM2RAIN over the CONUS with the first performing better in eastern US and the second in the central and western US. This opens up new possibilities for the integration of multiple products to obtain a higher-quality merged rainfall estimate – as outlined in Ciabatta et al. (2015) and in Beck et al. (2017).
4 Summary and conclusions
The assessment of the performance of satellite rainfall prod-ucts on a global scale is challenging due to significant limita-tions in the spatial coverage of high-quality, ground-based rain gauge observations. Provided that its underlying as-sumption are respected (see Sect. 2.2), TC provides an alter-native approach for evaluating global rainfall products with-out reliance on ground-based observations. Here, we de-scribe how a new method for rainfall estimation based on SM observations (i.e. SM2RAIN) provides a rainfall prod-uct that is uniquely suited to satisfy the error independent assumptions at the heart of the TC approach.
The extended version of TC introduced by McColl et al. (2014) was applied to provide the correlation with the (unknown error-free) truth for each of the products ap-plied within a particular triplet. To assess the robustness of correlated-based results obtained with TC, we used an area characterized by a high-quality rainfall product (CPC data set over the CONUS; see Fig. 1) with the assumption that it represents a good proxy of the true rainfall field. Therefore, if TC assumptions hold, Pearson correlation coefficients com-puted against CPC should match those of TC – at least in terms of their relative values. Since we have two different error model options (i.e. additive and multiplicative) for the application of TC to rainfall data, we explored both.
Results demonstrate that daily rainfall accumulations pro-vided by the CPC product are indeed relatively high quality compared to competing products (Table 1), thus supporting the assumption that it provides an acceptable proxy of the true rainfall field. Once it is established as a credible
bench-mark, CPC is used to evaluate (1) what type of triplets can be considered for a robust application of TC, and (2) which model error assumption can be considered more appropri-ate. Triplets containing SM2RAIN and assuming an addi-tive error model (Table 2) appear to provide the most ro-bust TC results. Based on this, an optimal TC configuration was applied (for the first time) to globally evaluate daily rain-fall accumulation derived from the 3B42RT and CMORPH, ERA-Interim and SM2RAIN products (Fig. 4a–d) without the use of any ground-based data. Results demonstrate the relatively high performance of daily rainfall accumulations derived from the satellite rainfall products (i.e. 3B42RT and CMORPH) in eastern North and South America, southern Africa, southern and eastern Asia, eastern Australia, and southern Europe, as well as complementary performances between ERA-Interim and SM2RAIN, with the first perform-ing reasonably well in the Northern Hemisphere and the sec-ond providing very good performance in the Southern Hemi-sphere.
Based on the results obtained, we can therefore conclude the following:
1. Despite the abundance of satellite rainfall estimates, their relative dependency impedes their use within the same triplet for the TC analysis, thus alternative inde-pendent products must be used for obtaining meaningful TC results. In particular, the use of two remotely sensed rainfall products in a single triplet entails significant risk of a biased TC analysis.
2. Wholly independent daily rainfall accumulation prod-ucts obtained from SM2 RAIN are uniquely valuable for obtaining robust global evaluation statistics in absence of ground-based gauge observations. This is important not only for simple validation purposes but also for hy-drological studies and applications within developing countries, where ground-based rain gauge networks are often limited or absent and an alternative product has to be chosen.
3. At the time/space scales examined here, the assump-tion of additive error model provides reasonable and robust results and no advantage is observed for a log transformation of the time series (which allows for the consideration of a multiplicative error model). However, this result is likely to be scale dependent and implies at the timescale resolution of this analysis is sufficiently coarse such that averaging produces approximate ad-ditive/Gaussian distributions (via the central limit the-orem). Therefore, different results may be obtained at finer timescales.
these rainfall estimates may be unreliable at high lati-tudes and in mountainous regions. In these areas, a re-analysis product (i.e. ERA30 Interim) provides higher-quality rainfall estimates and should be considered in place of satellite-based estimates. SM-based rainfall es-timates also work reasonably well in semi-arid climates (e.g. Sahel, central Australia and Mexico) where the state-of-the-art satellite products report problems due to sub-cloud evaporation of hydrometeors (Ebert et al., 2007). Conversely, in wet climates (e.g. tropical forests) 3B42RT and CMORPH seem to be the only reliable op-tion given that neither SM2RAIN nor ERA-Interim pro-vide reasonable results.
5. Given the existence of complementary performances among the products, TC can potentially be a valuable tool for the characterization of their relative perfor-mances so as to be used for data fusion and assimilation experiments for obtaining more accurate rainfall esti-mates.
The question of whether this analysis is valid for differ-ent spatio-temporal scales remains to be addressed and will be addressed in future studies. Also, removing zeros for ob-taining log-transformed rainfall may not be ideal for testing the validity of the model error assumptions since it shortens the sample size, thus providing less robust TC results. Other strategies should be considered.
Data availability. This study is based on third-party data. The ci-tations to the data sets along with the data providers can be found in the data description section (Sect. 2). The reader can find nec-essary information for downloading the data in the website of the providers.
The Supplement related to this article is available online at https://doi.org/10.5194/hess-21-4347-2017-supplement.
Competing interests. The authors declare that they have no conflict of interest.
Acknowledgements. This research was supported by the Short Term Mobility Program of the National Research Council of Italy and by the United States Department of Agriculture (USDA) and the NASA Terrestrial Hydrology Program award 13-THP13-0022 entitled “Integrating Satellite-based Surface Soil Moisture and Rainfall Accumulation Products for Improved Hydrologic Model-ing”. The first author wants to be grateful to Thomas Holmes and Concha Arroyo for their support and kindness during his period at the USDA-ARS Hydrology and Remote Sensing Laboratory (HRSL) in Beltsville (MD). We also would like to thank Luca Ciabbatta for processing part of the data used in the paper.
Edited by: Lixin Wang
Reviewed by: Viviana Maggioni and one anonymous referee
References
Adler, R. F., Wang, J.-j., Gu, G., and Huffman, G. J.: A Ten-Year Tropical Rainfall Climatology Based on a Composite of TRMM Products, J. Meteorol. Soc. Jpn., 87, 281–293, https://doi.org/10.2151/jmsj.87A.281, 2009.
Alemohammad, S. H., McColl, K. A., Konings, A. G., En-tekhabi, D., and Stoffelen, A.: Characterization of precipita-tion product errors across the United States using multiplica-tive triple collocation, Hydrol. Earth Syst. Sci., 19, 3489–3503, https://doi.org/10.5194/hess-19-3489-2015, 2015.
Bartalis, Z., Wagner, W., Naeimi, V., Hasenauer, S., Sci-pal, K., Bonekamp, H., Figa, J., and Anderson, C.: Ini-tial soil moisture retrievals from the METOP-A Advanced Scatterometer (ASCAT), Geophys. Res. Lett., 34, L20401, https://doi.org/10.1029/2007GL031088, 2007.
Bechtold, P., Chaboureau, J.-P., Beljaars, A., Betts, A., Köh-ler, M., MilKöh-ler, M., and Redelsperger, J.-L.: The simulation of the diurnal cycle of convective precipitation over land in a global model, Q. J. Roy. Meteorol. Soc., 130, 3119–3137, https://doi.org/10.1256/qj.03.103, 2004.
Beck, H. E., van Dijk, A. I. J. M., Levizzani, V., Schellekens, J., Miralles, D. G., Martens, B., and de Roo, A.: MSWEP: 3-hourly 0.25◦global gridded precipitation (1979–2015) by merg-ing gauge, satellite, and reanalysis data, Hydrol. Earth Syst. Sci., 21, 589–615, https://doi.org/10.5194/hess-21-589-2017, 2017. Brocca, L., Ciabatta, L., Massari, C., Moramarco, T., Hahn, S.,
Hasenauer, S., Kidd, R., Dorigo, W., Wagner, W., and Levizzani, V.: Soil as a natural rain gauge: Estimating global rainfall from satellite soil moisture data, J. Geophys. Res.-Atmos., 119, 5128– 5141, https://doi.org/10.1002/2014JD021489, 2014.
Ciabatta, L., Brocca, L., Massari, C., Moramarco, T., Puca, S., Rinollo, A., Gabellani, S., and Wagner, W.: Integra-tion of Satellite Soil Moisture and Rainfall ObservaIntegra-tions over the Italian Territory, J. Hydrometeorol., 16, 1341–1355, https://doi.org/10.1175/JHM-D-14-0108.1, 2015.
Crow, W. T. and Van Den Berg, M. J.: An improved approach for estimating observation and model error parameters in soil moisture data assimilation, Water Resour. Res., 46, 1–12, https://doi.org/10.1029/2010WR009402, 2010.
Dee, D. P., Uppala, S. M., Simmons, A. J., Berrisford, P., Poli, P., Kobayashi, S., Andrae, U., Balmaseda, M. A., Balsamo, G., Bauer, P., Bechtold, P., Beljaars, A. C. M., van de Berg, L., Bid-lot, J., Bormann, N., Delsol, C., Dragani, R., Fuentes, M., Geer, A. J., Haimberger, L., Healy, S. B., Hersbach, H., Hólm, E. V., Isaksen, L., Kållberg, P., Köhler, M., Matricardi, M., McNally, A. P., Monge-Sanz, B. M., Morcrette, J.-J., Park, B.-K., Peubey, C., de Rosnay, P., Tavolato, C., Thépaut, J.-N., and Vitart, F.: The ERA-Interim reanalysis: configuration and performance of the data assimilation system, Q. J. Roy. Meteorol. Soc., 137, 553– 597, https://doi.org/10.1002/qj.828, 2011.
Earth Syst. Sci., 14, 2605–2616, https://doi.org/10.5194/hess-14-2605-2010, 2010.
Draper, C., Reichle, R., de Jeu, R., Naeimi, V., Parinussa, R., and Wagner, W.: Estimating root mean square er-rors in remotely sensed soil moisture over continental scale domains, Remote Sens. Environ., 137, 288–298, https://doi.org/10.1016/j.rse.2013.06.013, 2013.
Ebert, E. E., Janowiak, J. E., and Kidd, C.: Comparison of Near-Real-Time Precipitation Estimates from Satellite Observations and Numerical Models, B. Am. Meteorol. Soc., 88, 47–64, https://doi.org/10.1175/BAMS-88-1-47, 2007.
Famiglietti, J. S. and Wood, E. F.: Multiscale modeling of spatially variable water and energy balance processes, Water Resour. Res., 30, 3061–3078, https://doi.org/10.1029/94WR01498, 1994. Gottschalck, J., Meng, J., Rodell, M., and Houser, P.:
Anal-ysis of Multiple Precipitation Products and Preliminary As-sessment of Their Impact on Global Land Data Assimilation System Land Surface States, J. Hydrometeorol., 6, 573–598, https://doi.org/10.1175/JHM437.1, 2005.
Gruber, A., Su, C.-H., Zwieback, S., Crow, W., Dorigo, W., and Wagner, W.: Recent advances in (soil moisture) triple collocation analysis, Int. J. Appl. Earth Obs., 45, 200–211, https://doi.org/10.1016/j.jag.2015.09.002, 2016.
Hossain, F. and Anagnostou, E. N.: A two-dimensional satellite rainfall error model, IEEE T. Geosci. Remote, 44, 1511–1522, https://doi.org/10.1109/TGRS.2005.863866, 2006.
Hou, A. Y., Kakar, R. K., Neeck, S., Azarbarzin, A. A., Kum-merow, C. D., Kojima, M., Oki, R., Nakamura, K., and Iguchi, T.: The global precipitation measurement mission, B. Am. Me-teorol. Soc., 95, 701–722, https://doi.org/10.1175/BAMS-D-13-00164.1, 2014.
Huffman, G. J., Adler, R. F., Arkin, P., Chang, A., Ferraro, R., Gruber, A., Janowiak, J., McNab, A., Rudolf, B., Schnei-der, U., Huffman, G. J., Adler, R. F., Arkin, P., Chang, A., Ferraro, R., Gruber, A., Janowiak, J., McNab, A., Rudolf, B., and Schneider, U.: The Global Precipitation Clima-tology Project (GPCP) Combined Precipitation Dataset, B. Am. Meteorol. Soc., 78, 5–20, https://doi.org/10.1175/1520-0477(1997)078<0005:TGPCPG>2.0.CO;2, 1997.
Huffman, G. J., Bolvin, D. T., Nelkin, E. J., Wolff, D. B., Adler, R. F., Gu, G., Hong, Y., Bowman, K. P., and Stocker, E. F.: The TRMM Multisatellite Precipitation Analy-sis (TMPA): Quasi-Global, Multiyear, Combined-Sensor Precip-itation Estimates at Fine Scales, J. Hydrometeorol., 8, 38–55, https://doi.org/10.1175/JHM560.1, 2007.
Joyce, R. J., Janowiak, J. E., Arkin, P. A., and Xie, P.: CMORPH: A Method that Produces Global Precipita-tion Estimates from Passive Microwave and Infrared Data at High Spatial and Temporal Resolution, J. Hy-drometeorol., 5, 487–503, https://doi.org/10.1175/1525-7541(2004)005<0487:CAMTPG>2.0.CO;2, 2004.
Kidd, C., Becker, A., Huffman, G. J., Muller, C. L., Joe, P., Skofronick-Jackson, G., Kirschbaum, D. B., Kidd, C., Becker, A., Huffman, G. J., Muller, C. L., Joe, P., Skofronick-Jackson, G., and Kirschbaum, D. B.: So, How Much of the Earth’s Sur-face IS Covered by Rain Gauges?, B. Am. Meteorol. Soc., 98, 69–78, https://doi.org/10.1175/BAMS-D-14-00283.1, 2017. Koster, R. D., Brocca, L., Crow, W. T., Burgin, M. S., and De
Lannoy, G. J. M.: Precipitation estimation using L-band and
C-band soil moisture retrievals, Water Resour. Res., 52, 7213–7225, https://doi.org/10.1002/2016WR019024, 2016.
Kummerow, C., Oison, W. S., and Giglio, L.: A simplified scheme for obtaining precipitation and vertical hydrometeor profiles from passive microwave sensors, IEEE T. Geosci. Remote, 34, 1213–1232, https://doi.org/10.1109/36.536538, 1996.
McColl, K. A., Vogelzang, J., Konings, A. G., Entekhabi, D., Piles, M., and Stoffelen, A.: Extended triple collocation: Es-timating errors and correlation coefficients with respect to an unknown target, Geophys. Res. Lett., 41, 6229–6236, https://doi.org/10.1002/2014GL061322, 2014.
Menne, M. J., Durre, I., Vose, R. S., Gleason, B. E., and Hous-ton, T. G.: An Overview of the Global Historical Climatology Network-Daily Database, J. Atmos. Ocean. Tech., 29, 897–910, https://doi.org/10.1175/JTECH-D-11-00103.1, 2012.
Miralles, D. G., Crow, W. T., and Cosh, M. H.: Estimating Spa-tial Sampling Errors in Coarse-Scale Soil Moisture Estimates Derived from Point-Scale Observations, J. Hydrometeorol., 11, 1423–1429, https://doi.org/10.1175/2010JHM1285.1, 2010. Naeimi, V., Scipal, K., Bartalis, Z., Hasenauer, S., and Wagner,
W.: An improved soil moisture retrieval algorithm for ERS and METOP scatterometer observations, IEEE T. Geosci. Remote, 47, 1999–2013, https://doi.org/10.1109/TGRS.2008.2011617, 2009.
Peterson, T. C., Easterling, D. R., Karl, T. R., Groisman, P., Nicholls, N., Plummer, N., Torok, S., Auer, I., Boehm, R., Gul-lett, D., Vincent, L., Heino, R., Tuomenvirta, H., Mestre, O., Szentimrey, T., Salinger, J., Førland, E. J., Hanssen-Bauer, I., Alexandersson, H., Jones, P., and Parker, D.: Homogeneity ad-justments of in situ atmospheric climate data: a review, Int. J. Climatol., 18, 1493–1517, https://doi.org/10.1002/(SICI)1097-0088(19981115)18:13<1493::AID-JOC329>3.0.CO;2-T, 1998. Roebeling, R. A., Wolters, E. L. A., Meirink, J. F., and
Lei-jnse, H.: Triple Collocation of Summer Precipitation Re-trievals from SEVIRI over Europe with Gridded Rain Gauge and Weather Radar Data, J. Hydrometeorol., 13, 1552–1566, https://doi.org/10.1175/JHM-D-11-089.1, 2012.
Sapiano, M. R. P. and Arkin, P. A.: An Intercomparison and Validation of High-Resolution Satellite Precipitation Estimates with 3-Hourly Gauge Data, J. Hydrometeorol., 10, 149–166, https://doi.org/10.1175/2008JHM1052.1, 2009.
Schamm, K., Ziese, M., Becker, A., Finger, P., Meyer-Christoffer, A., Schneider, U., Schröder, M., and Stender, P.: Global grid-ded precipitation over land: a description of the new GPCC First Guess Daily product, Earth Syst. Sci. Data, 6, 49–60, https://doi.org/10.5194/essd-6-49-2014, 2014.
Stampoulis, D. and Anagnostou, E. N.: Evaluation of Global Satel-lite Rainfall Products over Continental Europe, J. Hydrome-teorol., 13, 588–603, https://doi.org/10.1175/JHM-D-11-086.1, 2012.
Stoffelen, A.: Toward the true near-surface wind speed: Error mod-eling and calibration using triple collocation, J. Geophys. Res., 103, 7755, https://doi.org/10.1029/97JC03180, 1998.
Tian, Y. and Peters-Lidard, C. D.: A global map of uncertainties in satellite-based precipitation measurements, Geophys. Res. Lett., 37, L24407, https://doi.org/10.1029/2010GL046008, 2010. Tian, Y., Peters-Lidard, C. D., Choudhury, B. J., and Garcia, M.:
Multitemporal Analysis of TRMM-Based Satellite Precipitation Products for Land Data Assimilation Applications, J. Hydrom-eteorol., 8, 1165–1183, https://doi.org/10.1175/2007JHM859.1, 2007.
Tian, Y., Huffman, G. J., Adler, R. F., Tang, L., Sapiano, M., Mag-gioni, V., and Wu, H.: Modeling errors in daily precipitation mea-surements: Additive or multiplicative?, Geophys. Res. Lett., 40, 2060–2065, https://doi.org/10.1002/grl.50320, 2013.
Tian, Y., Liu, Y., Arsenault, K. R., and Behrangi, A.: A new approach to satellite-based estimation of precipitation over snow cover, Int. J. Remote Sens., 35, 4940–4951, https://doi.org/10.1080/01431161.2014.930208, 2014.
Tompkins, A. M., Gierens, K., and Rädel, G.: Ice supersaturation in the ECMWF integrated forecast system, Q. J. Roy. Meteorol. Soc., 133, 53–63, https://doi.org/10.1002/qj.14, 2007.
Villarini, G., Mandapaka, P. V., Krajewski, W. F., and Moore, R. J.: Rainfall and sampling uncertainties: A rain gauge perspective, J. Geophys. Res., 113, D11102, https://doi.org/10.1029/2007JD009214, 2008.
Wagner, W., Lemoine, G., and Rott, H.: A Method for Estimating Soil Moisture from ERS Scatterometer and Soil Data, Remote Sens. Environ., 70, 191–207, 1999.
Yilmaz, M. T. and Crow, W. T.: Evaluation of Assumptions in Soil Moisture Triple Collocation Analysis, J. Hydrometeorol., 15, 1293–1302, https://doi.org/10.1175/JHM-D-13-0158.1, 2014. Yong, B., Liu, D., Gourley, J. J., Tian, Y., Huffman, G. J., Ren,