ScholarWorks @ Georgia State University
ScholarWorks @ Georgia State University
Public Health Theses School of Public Health
5-11-2012
Associations of Youth Weight Status Categories and Cholesterol
Associations of Youth Weight Status Categories and Cholesterol
Levels: Analysis of Data from the National Health and Nutrition
Levels: Analysis of Data from the National Health and Nutrition
Examination Survey
Examination Survey
Sandra Metcalf Georgia State University
Follow this and additional works at: https://scholarworks.gsu.edu/iph_theses
Recommended Citation Recommended Citation
Metcalf, Sandra, "Associations of Youth Weight Status Categories and Cholesterol Levels: Analysis of Data from the National Health and Nutrition Examination Survey." Thesis, Georgia State University, 2012. https://scholarworks.gsu.edu/iph_theses/212
ASSOCIATIONS OF YOUTH WEIGHT STATUS CATEGORIES AND CHOLESTEROL LEVELS:
ANALYSIS OF DATA FROM THE
NATIONAL HEALTH AND NUTRITION EXAMINATION SURVEY
by
SANDRA C. METCALF
B.S.N., UNIVERSITY OF NORTH FLORIDA
A Thesis Submitted to the Graduate Faculty of Georgia State University in Partial Fulfillment
of the
Requirements for the Degree
MASTER OF PUBLIC HEALTH
APPROVAL PAGE
ASSOCIATIONS OF YOUTH WEIGHT STATUS CATEGORIES AND CHOLESTEROL LEVELS:
ANALYSIS OF DATA FROM THE
NATIONAL HEALTH AND NUTRITION EXAMINATION SURVEY
by
SANDRA C. METCALF
Approved:
Rodney Lyn, PhD___________________________ Committee Chair
Richard Rothenberg, MD_____________________ Committee Member
Theresa Chapple-McGruder, PhD, MPH_________ Committee Member
DEDICATION
For my mother,
ACKNOWLEDGEMENTS
I would like to thank the faculty and staff of Georgia State University’s Institute of Public Health who enriched my knowledge of public health. I would especially like to thank my thesis committee members, Dr. Rodney Lyn, Dr. Richard Rothenberg and Dr. Theresa Chapple-McGruder for providing their expertise and guidance throughout the thesis process. Many thanks go to my family and friends for their support and encouragement. I am
Author’s Statement Page
In presenting this thesis as a partial fulfillment of the requirements for an advanced degree from Georgia State University, I agree that the Library of the University shall make it available for inspection and circulation in accordance with its regulations governing materials of this type. I agree that permission to quote from, to copy from, or to publish this thesis may be granted by the author or, in his/her absence, by the professor under whose direction it was written, or in his/her absence, by the Associate Dean, Institute of Public Health. Such quoting, copying, or publishing must be solely for scholarly purposes and will not involve potential financial gain. It is understood that any copying from or publication of this dissertation which involves potential financial gain will not be allowed without written permission of the author.
Notice to Borrowers Page
All theses deposited in the Georgia State University Library must be used in accordance with the stipulations prescribed by the author in the preceding statement.
The author of this thesis is:
Student’s Name: Sandra C. Metcalf Street Address: 2 Peachtree Street
City, State, and Zip Code: Atlanta, GA 30303 The Chair of the committee for this thesis is: Professor’s Name: Rodney Lyn, PhD Department: Public Health
College: Health and Human Sciences Georgia State University P.O. Box 3995
Atlanta, Georgia 30302-3995
Users of this thesis who not regularly enrolled as students at Georgia State University are required to attest acceptance of the preceding stipulation by signing below. Libraries borrowing this thesis for the use of their patrons are required to see that each user records here the
information requested.
NAME OF USER ADDRESS DATE TYPE OF USE
CURRICULUM VITAE
Sandra C. Metcalf
2 Peachtree Street Atlanta, GA 30303
Education
2008 to 2012 Georgia State University Atlanta, Georgia GPA: 4.0
Master of Public Health Candidate - May 2012
1990 to 1993 University of North Florida Jacksonville, Florida
GPA: 4.0 Summa Cum Laude
Bachelor of Science in Nursing – Dec 1993
1977 to 1985 Miami Dade Community College Miami, Florida
GPA: 3.44
Associate in Science Degree in Nursing – May 1985 Associate in Arts Degree – Dec 1983
Work History
Sept 2008 to Present Program Consultant
State of Georgia, Department of Public Health Atlanta, Georgia
Sept 2007 to Aug 2008 Public Health Nurse
DeKalb County Board of Health Decatur, Georgia
Aug 2004 to April 2005 Secondary Teacher
Harlingen High School South Harlingen, Texas
July 2002 to Oct 2003 Registered Nurse/Breastfeeding Educator
Valley Baptist Medical Center Harlingen, Texas
Nov 1990 to Aug 2000 Senior Community Health Nurse/CHN Supervisor
HRS Clay County Health Department Green Cove Springs, Florida
July 1989 to Sept 1990 Registered Nurse
TABLE OF CONTENTS
Page
ACKNOWLEDGMENTS ... iv
LIST OF TABLES ... vi
CHAPTER 1. INTRODUCTION ... 1
1.1 Background ...……….……….….. 1
1.2 Purpose of the Study and Hypothesis ... 4
2. REVIEW OF THE LITERATURE ... 6
2.1 Cardiovascular Disease ...………...…..… 6
2.2 Expert Guidelines and Recommendation s …....…….…. 7
2.3 Atherosclerosis ………..…... 9
2.4 Childhood Risk Factors for Adult CVD ………... 10
2.5 Childhood Risk Factors Track into Adulthood .……... 14
2.6 Childhood Obesity Tracks into Adulthood …..…….… 19
2.7 BMI as a Predictor of Dyslipidemia ………...…………. 21
2.8 Lipid Profile Statistics for US Youth ..………...… 23
2.9 Reliability of BMI at 85th Percentile as a Risk Factor .... 27
3 METHODOLOGY ………... 31
3.1 Subjects ... 31
3.2 Definition of Terms ... 34
3.3 Statistical Analysis …... 37
4 RESULTS ... 40
4.1 Study Sample Demographics ...……….. 40
4.2 Test Agreement … …………...………...……….. 51
4.3 Simple Logistic Regression ……….………....…... 57
4.4 Multivariate Logistic Regression …..……...………… 59
5 DISCUSSION AND CONCLUSION ... 61
5.1 Study Purpose ...………...… 61
5.2 Descriptive Data ....………...… 61
5.3 Test Agreement … .……….… 64
5.4 Logistic Regression …………....……… 66
5.5 Public Health Implications ……….… 67
5.6 Strengths and Limitations ....………. 68
5.7 Recommendations ..……… 69
5.8 Conclusion .………....…. 71
LIST OF TABLES
Page
Table 1. Total Cholesterol (TC) Values Descriptive Statistics of Study Sample ….... 42
Table 2. High-Density Lipoprotein Cholesterol (HDL-C) Values Descriptive Statistics of Study Sample ………. 43
Table 3. Non-High-Density Lipoprotein Cholesterol (Non-HDL-C) Values Descriptive Statistics of Study Sample ………. 44
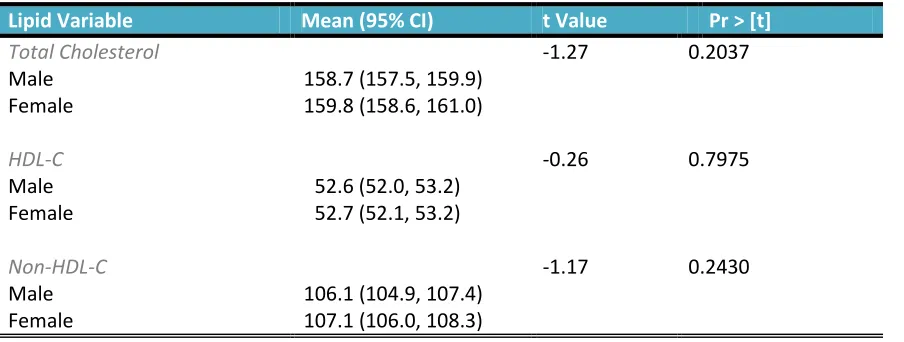
Table 4. Lipid Factors Independent-Samples t-Test ……… 45
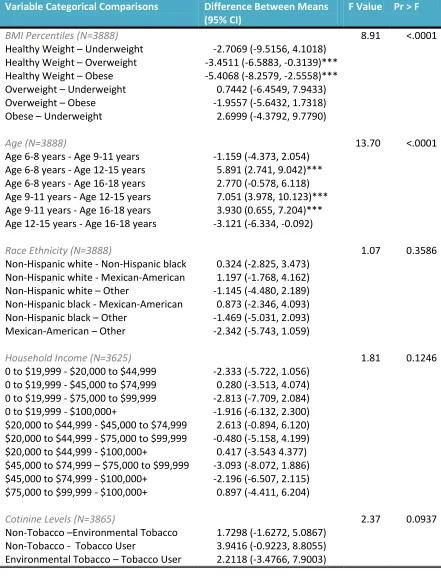
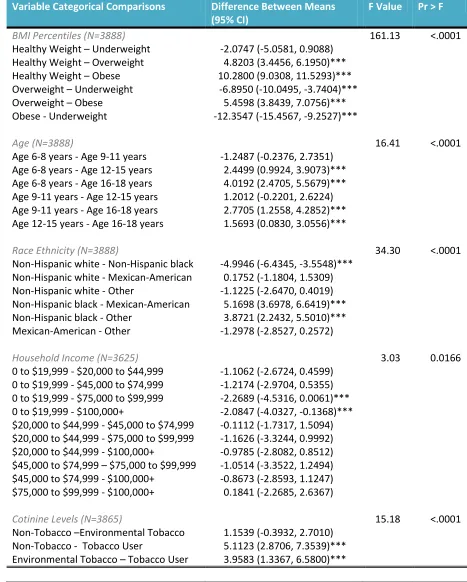
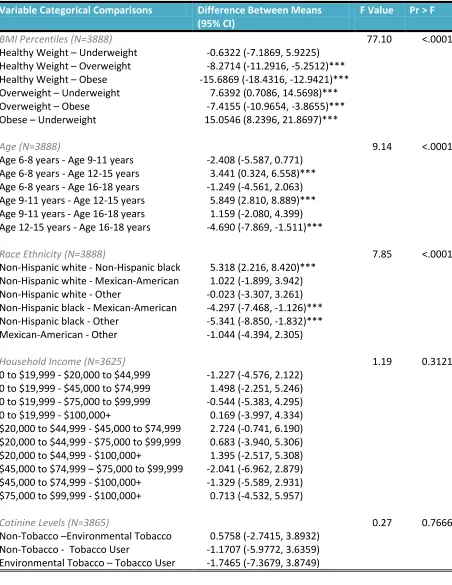
Table 5. Total Cholesterol (TC) Analysis of Variance ……… 46
Table 6. High-Density Lipoprotein (HDL-C) Analysis of Variance ……… 48
Table 7. Non-High-Density Lipoprotein Cholesterol (Non-HDL-C) Analysis of Variance ……… 50
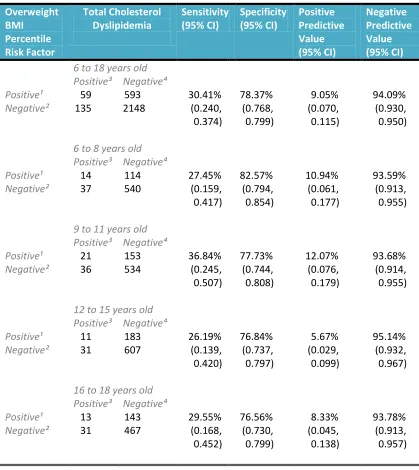
Table 8. Agreement between Overweight BMI Percentile as a Risk Factor and Dyslipidemia of Total Cholesterol in Study Participants ……….… 52
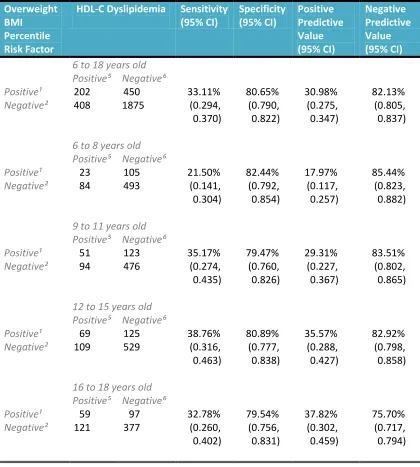
Table 9. Agreement between Overweight BMI Percentile as a Risk Factor and Dyslipidemia of High Density Lipoprotein-Cholesterol (HDL-C) in Study Participants ……..………..… 54
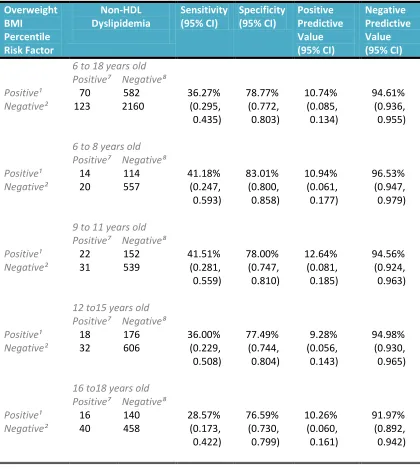
Table 10. Agreement between Overweight BMI Percentile as a Risk Factor and Dyslipidemia of Non-High Density Lipoprotein-Cholesterol (Non-HDL-C) in Study Participants ……….…...…… 56
Table 11. Simple Logistic Regression for Dyslipidemias ………... 58
CHAPTER I INTRODUCTION
1.1 Background
Atherosclerotic cardiovascular disease is the leading cause of death in the United
States. Cardiovascular disease (CVD) events such as a heart attack, stroke and peripheral
arterial disease are the culmination of a disease process that begins at a young age and
spans decades of a person’s life (Roger et al., 2012). Although CVD rarely manifests in
childhood, many risk factors and risk behaviors for the development and acceleration of
atherosclerosis begin in childhood (Daniels et al., 2011).
Predominant risk factors for CVD are family history, age, gender, hypertension,
dyslipidemia, overweight/obesity, diabetes, tobacco exposure, diet and physical
inactivity. There is increasing evidence that the number and/or severity of risk factors is
associated with CVD and that reducing risk factors delays disease progression (Berenson
et al., 1992; Magnussen et al., 2011). Thus, the aim of primary prevention for children
and adolescents is to identify and manage those at increased risk due to their identified
risk factors with the ultimate goal of risk reduction and thwarting CVD progression
(Raitakari et al., 2003; Webber, Srinivasan, Wattigney, & Berenson, 1991; Strong et al.,
1999).
Dyslipidemia is a term that describes abnormalities in lipoprotein metabolism and
often includes elevations in total cholesterol (TC), low-density lipoprotein cholesterol
(LDL-C) or triglycerides or deficiencies in high-density lipoprotein cholesterol (HDL-C).
risk factors as described above (US Preventive Services Task Force, 2007).
Non-high-density lipoprotein cholesterol (non-HDL-C) has recently emerged as a significant
predictor of atherosclerosis in both children and adults. Non-HDL-C appears to be more
predictive than TC, LDL-C or HDL-C for detecting dyslipidemia, atherosclerosis and
future CVD events (Frontini et al., 2008; Srinivasan, Frontini, Xu, & Berenson, 2006).
Non-HDL-C is especially advantageous in pediatric clinical practice because it can be
measured from non-fasting samples. Non-HDL-C is calculated by subtracting HDL-C
from TC which can be accurately obtained from non-fasting serum samples. Evidence
supports the use of non-HDL-C as a screening measure for dyslipidemia in youth and the
most recent screening guidelines include parameters for Non-HDL-C (Daniels et al.,
2011).
A series of observational studies exist which clearly demonstrate the correlation of
dyslipidemia with atherosclerotic development in youth (Daniels et al., 2011).
Postmortem studies on children, adolescents and young adults have found significant
associations between abnormal lipid levels and early atherosclerotic development of fatty
streaks and fibrous plaque (Berenson et al., 1992; Daniels et al., 2011). Childhood
dyslipidemia is also a predictor for increased carotid intima-media thickness, which is a
precursor for atherosclerosis (Raitakari et al., 2003).
Pediatric guidelines include targeted dyslipidemia screening for youth at risk
beginning at 2 years of age and universal screening between the ages of 17 and 21 years.
The primary risk factors used in this targeted approach are a family history of premature
CVD or dyslipidemia (Hagan, Shaw, & Duncan, 2008). In December 2011, the
Guidelines for Cardiovascular Health and Risk Reduction in Children and Adolescents
(Expert Panel), which added to the existing recommendations, universal screening of all
children once between the ages of 9 and 11 years (Kavey, Simons-Morton, & de Jesus,
2011). This change was made in part, because recent research has shown that using
family history of premature CVD or dyslipidemia as the primary risk factor for pediatric
screening misses 30-60% of children with dyslipidemias (Derinoz et al., 2007). Other
predominant risk factors used to identify youth for targeted screening include
hypertension, diabetes, smoking and overweight. Of these risk factors, overweight
children and adolescents are especially of concern given the preponderance of obesity in
the US and the propensity of obesity itself to accelerate atherosclerosis (McGill et al.,
2001; Ogden, Carroll, Curtin, Lamb, & Flegal, 2010).
The American Academy of Pediatrics (AAP) follows the Centers for Disease
Control and Prevention (CDC) body mass index (BMI) overweight percentile cutoffs to
determine which youth meet the criteria for dyslipidemia screening. In children and
adolescents the preferred screening tool for weight status is the child’s BMI percentile
distribution relative to gender and age which is derived from CDC 2000 growth charts
(Kuczmarski et al., 2000; Daniels et al., 2011). Overweight children are defined as those
with BMIs at the 85th percentile or greater and obese youth are those with BMIs at the
95th percentile or greater. Overweight youth, those at the 85th percentile or greater are
considered at risk and dyslipidemia screening is advised (Barlow & the Expert
Committee, 2007).
Extensive research has shown a positive relationship between adiposity status and
at the 85th percentile or greater are suggesting a need for additional research. Research
conducted on US children has predominantly examined the relationship of obese, not
overweight children and the development of atherosclerosis through pathology studies,
carotid artery imaging studies or lipid levels. International studies have found positive
associations between increasing levels of adiposity and more severe dyslipidemias.
However, this research is not readily generalized to the US population because
researchers used different classification systems for obesity and some studies were
conducted in Asian populations whose diets are dissimilar to American western foods
(Flechtner-Mors et al., 2011; Holl et al., 2011; Katzmarzyk, Tremblay, Perusse, Despres,
& Bouchard, 2003; Kim Soh Ye, Hong Kyung Hee, Jang Ki Hyo, Kang Soon Ah, &
Choue Ryo Won, 2005; Takada et al., 1998; Zhai et al., 2004). Additionally, in a recent
study Lee et al. (2009) found BMI did not provide effective discrimination for detecting
youth with elevated TC or LDL-C levels.
National expert organizations have designated BMI at the 85th percentile as the
screening threshold for youth at risk for dyslipidemia, however additional research to
support this cutpoint is needed. Although, the association of childhood obesity and CVD
is well documented, studies on US youth specific to the relationship of BMI percentiles
and dyslipidemia are lacking. There is a need to improve our understanding of
overweight youth and their risk for dyslipidemias.
1.2 Purpose of Study and Hypothesis
Although overweight children with BMIs at or greater than the 85th percentile
meet the at risk criteria for dyslipidemia screening, there is a scarcity of research on US
CDC obesity BMI cutoffs to have low sensitivity and high specificity (Freedman, Mei,
Srinivasan, Berenson, & Dietz, 2007). This finding is important because sensitivity and
specificity respectively, refer to the ability of a test to correctly identify individuals with
or without disease. Additionally, a recent study on NHANES subjects using current
recommended screening thresholds found that BMI did not adequately identify youth
with abnormal TC and LDL-C levels and called into question the current screening
recommendations (Lee et al., 2009). Given the prevalence of overweight and obese
youth in the United States, screening recommendations based on a threshold of the 85th
BMI percentile results in a large number of children and adolescents to receive
dyslipidemia screening.
The purpose of this research is to add to the body of knowledge on childhood and
adolescent weight categories and their association with dyslipidemia. This research seeks
to elucidate whether US youth with BMIs at the 85th percentile or greater are at increased
risk for dyslipidemia compared to children and adolescents who are at a healthy weight.
The study group will consist of youth 6 to 18 years of age who participated in NHANES
during the cycle years from 2007 to 2010. The objective of using sample groups from the
latest NHANES surveys is to more closely mirror the current US population. The study
hypothesizes that children and adolescents who are overweight are at greater risk for
CHAPTER II
REVIEW OF THE LITERATURE
2.1 Cardiovascular Disease
Cardiovascular disease (CVD) is the leading cause of death and disability
worldwide. In 2008, 17.3 million deaths occurred worldwide due to CVD. Of these
deaths, 7.3 million were from heart attacks and 6.2 million from strokes (Mendis, Puska,
& Norrving, 2011). In the United States, for the past 90 years CVD has accounted for
more deaths than any other cause. Approximately one in three persons in the United
States has some form of CVD and one in three deaths are attributed to CVD.
Cardiovascular disease causes more deaths each year than cancer, accidents and chronic
lower respiratory diseases combined (Lloyd-Jones et al., 2009).
Cardiovascular disease includes diseases of the heart and vascular diseases of the
blood vessels to the heart, brain and peripheral arteries. In the adult, acute CVD events,
such as myocardial infarction and stroke, occur after the long-term development of
atherosclerosis and thrombotic events associated with atherosclerotic plaque instability.
In pediatrics, the primary component of this process is the development of
atherosclerosis, because CVD thrombosis does not occur in the absence of
atherosclerosis. Although CVD in children and adolescents is rare, risk factors and
behaviors that contribute to atherosclerosis often begin in childhood and there is
2.2 Expert Guidelines and Recommendations
To address this health issue, in 2006, an Expert Panel was appointed by the
National Heart, Lung, and Blood Institute (NHLBI) to conduct a formal evidence review
and to develop cardiovascular health and risk reduction guidelines for pediatric care
providers. The Expert Panel’s approach to this guideline development was characterized
by formal evidence review and integration of multiple major CVD risk factors into one
document. The Full Report of the Expert Panel is available on the NHLBI website and
these Expert Panel guidelines were endorsed by the American Academy of Pediatrics
(AAP) in 2011 (Daniels et al., 2011).
Prior to release of the Expert Panel’s report, guidance for dyslipidemia screening
in children was primarily presented through two publications, the AAP policy statement
Lipid Screening and Cardiovascular Health in Childhood and Bright Futures 3rd Edition
Guidelines. The AAP policy statement, published in 2008, presented three different sets
of guidelines to use in determining normal and abnormal lipid levels. One set of
guidelines was adapted from the 1992 National Cholesterol Education Program: Report
of the Expert Panel on Blood Cholesterol Levels in Children and Adolescents. Another
was adopted from the American Heart Association, while a third, percentile ranking
table, was adapted from the Lipid Research Clinic Pediatric Prevalence Study. Although
the National Cholesterol Education Program (NCEP) and AAP recommend a targeted
approach to screen children with certain risk factors (i.e., family history of premature
CVD or hypercholesterolemia, diabetes, hypertension and obesity) research to optimize
screening protocols has not led to consensus in pediatric screening (Daniels, Greer, & the
In 2007, the US Preventive Services Task Force (USPSTF) (2007) concluded that
evidence was insufficient to recommend for or against routine screening for dyslipidemia
in youth and young adults up to age 20. The USPSTF could not address key questions
about screening and treatment of dyslipidemia in children and adolescents because
studies were lacking. However, due to the nature of pediatric research, pediatric
prevention unfortunately is often based upon less rigorous scientific evidence, and
“Insufficient” recommendations from the USPSTF are not uncommon (Daniels, Greer, &
Stettler, 2008; Moyer & Nelson, 2008). The lack of studies in this area of pediatric
research is due in part because longitudinal studies linking childhood risk factors to CVD
would involve extensive periods of time in the range of 50 to 60 years duration and
clinical trials of voluntary risk exposure in children are unethical (Daniels et al., 2011).
The recent report of the Expert Panel on Integrated Guidelines for Cardiovascular
Health and Risk Reduction in Children and Adolescents is a comprehensive review and
critical appraisal of every relevant study available on the multiple risk factors for CVD
development, progression and management. The Expert Panel followed an Evidence
Grading System adapted from the American Academy of Pediatrics Steering Committee
on Quality Improvement and Management. The Expert Panel assigned the Evidence
Review for Lipid Assessment in Childhood and Adolescence a Grade B (strongly
recommended). Evidence for a Grade B was based on randomized controlled trials or
diagnostic studies with minor limitations, genetic natural history studies, and/or
overwhelmingly consistent evidence from observational studies. The definition for a
strong recommendation as included in the report is that the benefits clearly exceed the
circumstances, strong recommendations were made on the basis of lesser evidence when
high-quality evidence was impossible to obtain and the anticipated benefits clearly
outweighed the harms. Unlike earlier policy statements and guidelines, the Expert Panel
Report has integrated the evidence and produced conclusive detailed tables and
algorithms to follow for lipid assessment that address age variance. The Expert Panel
determined that CV risk reduction in children and adolescents addresses the disease
process atherosclerosis, in which the clinical endpoint of manifest CVD occurs much
later in life (Daniels et al., 2011).
2.3 Atherosclerosis
Atherosclerosis is responsible for a large proportion of cardiovascular diseases. It
is an underlying pathological process in the blood vessels that develops over many years.
In atherosclerosis, plaque which consists of fatty substances and cholesterol, builds up in
arteries. Over time the plaque hardens and the arterial lumen narrows with resultant
decreased blood flow and potential clot formation. The atherosclerotic process often
leads to disruption of blood supply to vital organs such as the heart and brain, resulting in
cardiac and cerebral events (Mendis, Puska, & Norrving, 2011).
The earliest sign of atherosclerosis is the fatty streak, which is an accumulation of
lipid-filled macrophages in the intimal layer of the artery. Progression of atherosclerosis
occurs with accumulation of smooth muscle cells and fibrous tissue produced by the fat
laden smooth muscle cells. Over time the fatty streak evolves into a fibrous plaque, the
hallmark of established atherosclerosis. The buildup of plaque restricts blood flow by
supply causes lack of oxygen and tissue infarction, which damages the affected tissues or
organs (Crowther, 2005; Daniels, Greer, & the Committee on Nutrition, 2008).
2.4 Childhood Risk Factors for Adult CVD
Most of the clinical burden of atherosclerosis occurs in middle to older adulthood,
but the pathological process of atherosclerosis begins in childhood (Juonala et al., 2010).
Pathology studies have confirmed the atherosclerotic process begins at a young age.
Autopsy studies of young soldiers killed in the Korean and Vietnam Wars found evidence
of atherosclerosis (Enos, Homes, & Beyer, 1953; McNamara, Molot, Stremple, &
Cutting, 1971). In the Korean War study, 300 soldiers who were battle casualties were
examined for gross lesions in the coronary arteries. The ages of the first 98 soldiers were
not recorded, except that the oldest was 33 years of age. The average recorded age of the
remaining 200 soldiers was 22 years of age, ranging from 18 to 48 years. Cases with
known clinical evidence of coronary disease were excluded from the study. Findings
indicated 77% had evidence of atherosclerosis (Enos, Homes, & Beyer, 1953; Le, Zhang,
Menees, Chen, & Raghuveer, 2009). In the Vietnam War study, postmortem
examination of 105 soldiers with coronary angiography and heart dissection revealed
45% with some evidence of atherosclerosis and 5% with gross evidence of severe
coronary atherosclerosis (McNamara et al., 1971).
The study, Pathobiological Determinants of Atherosclerosis in Youth (PDAY) was
a multi-institutional study which was initiated to document the natural history of
atherosclerosis, its relationship to risk factors, and the pathobiology of lesion
development in young subjects (Strong for the Pathobiological Determinants of
from 1987 to 1994, examined subjects from 15 to 34 years of age, because this is the age
when fatty streaks are prevalent and fibrous plaques begin to appear (Strong et al., 1999).
This study included 1079 males and 364 females, black and white, who died from
external causes (suicide, homicide and accidents).
PDAY studies have described the effects of age, sex, race, dyslipidemias,
smoking, hypertension, diabetes and obesity on the microscopic development of
atherosclerosis in youth and young adults. The extent of arterial intima involved with
fatty streaks and raised lesions increased with age in both sexes and race groups.
Investigators found strong relationships between the degree of atherosclerosis and the
extent of known risk factors, including increasing age, increasing levels of non-HDL-C,
lower HDL-C, hypertension, impaired glucose tolerance, smoking, and obesity in males.
The severity of atherosclerosis was markedly increased in subjects with multiple risks
(McGill et al., 2001; Strong for the Pathobiological Determinants of Atherosclerosis in
Youth (PDAY) Research Group, 1995).
PDAY researchers devised youth risk scores for predicting advanced
atherosclerotic lesions using modifiable risk factors of dyslipidemia, tobacco use,
hypertension, obesity and hyperglycemia. Subjects with higher risk scores had
significantly higher odds ratios for atherosclerotic lesions. The prevalence of advanced
atherosclerosis in the high-risk 15 to 19 year olds was nearly the same as low-risk 30 to
34 year old subjects (McMahan et al., 2006).
The Bogalusa Heart Study was a long-term epidemiologic study of cardiovascular
disease risk factors in persons from birth through 38 years of age. The study began in
performed autopsy studies on 204 persons, 2 through 39 years of age. The causes of
death varied, but principally were due to accidents and homicide. Subjects were
evaluated for extent of atherosclerotic lesions in the aorta and coronary arteries.
Investigators found the extent of fatty streaks and fibrous plaque increased with age.
This age related trend was especially significant in the coronary arteries where the
prevalence of fibrous plaques increased from 8% in the 2 to 15 year old group, to 69% in
the 26 to 39 year old group (Berenson et al., 1998).
In the Bogalusa study, investigators conducted six cross-sectional surveys which
included over 3,500 children. The first survey examined 5 to 14 year old subjects.
Subsequent surveys were conducted throughout school age and beyond high school.
Findings from Bogalusa report on the positive association of cardiovascular risk factors,
body mass index (BMI), blood pressure, lipid levels and the development of
atherosclerosis in the aorta and coronary arteries (Berenson et al., 1998; Berenson et al.,
1992; Newman et al., 1986).
Two large studies utilized ultrasonography, a non-invasive method, to detect
atherosclerosis by measurement of carotid artery intima-media thickness (IMT), a
surrogate measure for CVD. The validity of using carotid IMT as a reliable marker for
atherosclerosis is well documented (de Groot et al., 2004; Roger et al., 2012). The
Rotterdam Study and the Atherosclerosis Risk in Communities (ARIC) Study found that
carotid IMT correlates positively and significantly with vascular risk factors and
cardiovascular disease. Additionally, in the ARIC study, carotid ultrasonography was
able to determine all stages of atherosclerosis (Bots, Hoes, Koudstaal, Hofman, &
The Muscatine study was a longitudinal cohort study which began in 1971 with
biennial examinations of school children 8 to 18 years of age in Muscatine, Iowa.
Ultrasonography was used in the Muscatine study in the 1990s to determine the
relationship of higher carotid IMT with cardiovascular risk factors that occurred in
childhood and beyond. The study included 725 male and female participants who had
previously participated in at least one childhood survey and had reached the age of 33 to
42 years. In this cohort, childhood risk factors measured as early as 8 to 11 years of age
and predictive of high adult carotid IMT were TC for both men and women and BMI for
women (Davis, Dawson, Riley, & Lauer, 2001).
In the Bogalusa study, investigators measured carotid IMT to evaluate the
influence of gender, ethnicity and risk factors on early stages of atherosclerosis. The
study included 518 male and female subjects, with a mean age of 32 years. The subjects
were overweight, but otherwise healthy, asymptomatic young adults. Cardiovascular risk
factors evaluated included obesity, hypertension, dyslipidemia, hyperinsulinemia and
smoking. After adjustments for age, race and sex, carotid IMT was associated
significantly and positively with waist circumference, systolic blood pressure, diastolic
blood pressure, and LDL cholesterol. Carotid IMT was inversely correlated with
high-density lipoprotein (HDL) cholesterol levels. Participants with greater numbers of
adverse risk factors had stepwise increases in mean carotid IMT levels (Urbina et al.,
2002).
Probably the most compelling evidence that childhood dyslipidemia risk factors
are related to adult CVD is the manifestation of cardiovascular conditions. Familial
abnormally high concentrations of LDL-C. FH is one of the most common inherited
disorders with an estimated worldwide prevalence of 1 in 500 (Austin, Hutter, Zimmern,
& Humphries, 2004). The dyslipidemia associated with FH leads to increased risk for
CVD and death. Risk for coronary heart disease (CHD) and cardiac events is much
higher with 50% of FH men and 25% of FH women experiencing clinical coronary
events by 50 years of age (Neil et al., 2008; Stone, Levy, Fredrickson, & Verter, 1974).
Adding to the evidence of causation, the use of statin medications to reduce dyslipidemia
in FH subjects has been shown to reduce morbidity and mortality (Neil et al., 2008).
Furthermore, the ARIC study found that persons with genetic traits associated with low
cholesterol had conferred protection against CHD and significantly lower measures of
carotid IMT (Cohen, Boerwinkle, & Hobbs, 2006). Collectively these studies helped to
establish the association of childhood dyslipidemia as a risk factor for adult CVD.
2.5 Childhood Risk Factors Track into Adulthood
Risk factors for CVD and atherosclerosis can be categorized as life conditions
(e.g., family history, age, gender), pathophysiologic (e.g., hypertension, dyslipidemia,
overweight, diabetes), behavioral (e.g., tobacco exposure, nutrition, physical activity) and
emerging (e.g., metabolic syndrome, inflammatory markers, perinatal factors) (Daniels et
al., 2011). The strongest risk factors include obesity, dyslipidemia, hypertension,
diabetes, and tobacco use (Daniels, Greer, & The Committee On Nutrition, 2008; Wilson
et al., 1998). Research has demonstrated that these pathophysiologic risk factors can be
present at young ages and track into adulthood (Berenson et al., 1998; Juonala et al.,
2005). A detailed review of all risk factors is beyond the scope of this thesis. Obesity
screening indices in childhood are the focus of this study, this literature review will aim
to present research findings relevant to childhood overweight/obesity and its’ associations
with dyslipidemia, although brief mention of other risk factors and related components of
overweight/obesity and dyslipidemia may be included.
In epidemiologic studies, tracking describes consistency and longitudinal
development of risk factors over time (Magnussen et al., 2011; Twisk, Kemper, &
Mellenbergh, 1994). From a pediatric viewpoint, tracking analyses are beneficial
because they can predict future values from early life measurements and aid in
determining which risk factors to target for primary prevention or treatment. Tracking
indicators are generally correlations between repeated measurements of an attribute at
different times and the proportion of participants that remain in the group. Due to
established associations of dyslipidemia and CVD in adults, blood lipid levels have been
studied for tracking in children and adolescents.
A number of prospective studies on the tracking of lipids from youth into
adulthood exist. In the Bogalusa Heart Study, a study cohort was derived and monitored
for an average of 27 years. There were 1163 subjects, 30% black and 55% female who
were 5 to 14 years at baseline. Investigators studied persistence of ranking of
non-HDL-C and LDL-non-HDL-C levels in quintile levels from childhood to adulthood. For both cholesterol
levels 66% of subjects who were above the 60th percentile in childhood remained above
the 60th percentile as an adult. Of the variables studied, baseline levels of non-HDL-C
and LDL-C were the best predictors for adult levels with standardized regression
coefficients of 0.36 and 0.40 respectively. Change in BMI from childhood to adulthood
0.20 for non-HDL-C and 0.22 for LDL-C. Children in age-, gender- and race-specific top
quartiles of non-HDL-C and LDL-C were compared to those in the bottom quartiles and
had odds ratios of 4.5 and 3.5 respectively to develop dyslipidemia (Srinivasan, Frontini,
Xu, & Berenson, 2006).
Muscatine investigators found that increased cholesterol values during childhood
were associated with increased values as adults. A cohort of 2446 subjects were initially
examined at 8 to 18 years of age, then re-examined between 20 to 30 years of age.
Eighty one percent of children who had cholesterol values above the 50th percentile
remained above the 50th percentile as an adult. Of those that were at or above the 75th
percentile, 62% remained at this level as an adult. For the highest level at or above the
90th percentile, 43% remained as adults. Fifty to 87% of children whose cholesterol
levels exceeded the 90th percentile were above the 75th percentile as adults. Conversely,
if children’s cholesterol levels were less than the 90th
percentile, 78 – 84% were below
the 75th percentile as adults. The 75th percentile cutoff was used in this study because it
was the National Cholesterol Education Program recommended benchmark to implement
dietary interventions in adults with dyslipidemias (Lauer, Lee, & Clarke, 1989).
In the Cardiovascular Risk in Young Finns Study tracking and predictiveness of
lipid measurements of Finnish youth were analyzed over a 12 year period. The cohort
included 883 subjects from 3 to 18 years of age with 47% male. Spearman’s correlation
coefficients for 12–year tracking were as follows: TC 0.48-0.58, LDL-C 0.53-0.58,
HDL-C 0.53-0.58, LDL:HDL cholesterol ratio 0.57-0.59 and triglycerides 0.33-0.37.
Approximately 50% of participants who were in the extreme quintiles for TC, LDL-C
regression analyses, conducted by Porkka, Viikari, Taimela, Dahl, and Akerblom (1994)
childhood obesity, exercise, diet, and smoking habits did not markedly aid the prediction
of adult serum lipid values.
Friedman (2006) found a wide range of test agreement values in tracking of lipid
abnormalities from childhood to adulthood. The Princeton Lipid Research Clinics
Prevalence Program Follow-Up Study was a prospective study to determine sensitivity
and specificity of National Cholesterol Education Program (NCEP) pediatric cutoff
points during youth for adult lipid status. The derived cohort included children 5 to 19
years of age when initially studied in the Cincinnati Clinic of the Lipid Research Clinics
(LRC) Prevalence Study from 1972-1978. Study participants for the Princeton
Follow-Up Study (PFS) were students in 1st to 12th grade in public and parochial schools in the
Princeton School District. The study group was 73% white, 27% black, 52% male and
48% female. A total of 844 subjects were evaluated for LDL-C tracking and 897 subjects
for TC tracking. Guidelines from the NCEP were followed for determining adult
elevated TC and LDL-C levels (Friedman, 2006).
Reported overall sensitivities were 43 to 46% and specificities were 82 to 86% for
total and low-density lipoprotein cholesterol levels respectively. The positive predictive
values were 39% for TC and 31% for LDL-C. Negative predictive values were 88% for
TC and 91% for LDL-C. Researchers examined sensitivity and specificity of the entire
cohort according to age. Sensitivities ranged from 18% (16 years old) to 63% (11 years
old) for TC, and 22% (15 years old) to 69% (9 years old) for LDL-C. The highest
sensitivities occurred in the younger age groups between 5 and 11 years of age and the
to 19 year old groups (~49% TC and ~65% LDL-C) to levels similar to the younger ages.
The specificities were high ranging from 77 to 96%. This study was especially of merit
in delineating the variability in sensitivities at different ages.
Childhood to adult lipid tracking was described in another prospective study by
Stuhldreher et al., (1991). In the Beaver County Lipid Study investigators conducted
follow-up screening on 295 adults who had initially participated as children in a
school-based screening program at the ages of 11 to 14 years. The follow-up phase of the study
was conducted 16 years after the baseline study conducted in 1972 -1973 when the
subjects had reached a mean age of 28 years. Overall correlation coefficients between
the baseline and follow-up study for TC levels were 0.44 (P<0.0001). Correlation
coefficients for women were higher (r = 0.51) compared to men (r = 0.38). Based on
recommended guidelines, cutoffs for elevated TC levels or positive test results were
established at 175 mg/dl in children and 200 mg/dl in adults. Researchers reported
sensitivity of 63%, specificity of 67% and a positive predictive value of 47% for
screening at 12 years of age and predicting elevated adult TC levels.
For this Beaver study, a false-positive test was a child who was above the cutoff as
a child, but not as an adult. A false-negative test was a child who was below the cutoff as
a child, but not as an adult. A comparison of test results found that male and female
subjects with positive results smoked significantly less than those with
false-negative results. In addition, false-positive males had a greater improvement between
evaluation periods in cholesterol-lowering dietary practices. Comparisons also revealed
that female subjects with false-positive results were less overweight and had a lower
were misclassified as a result of childhood screening, some misclassification was
associated with adopting changes that would be promoted through a screening and
intervention program such as tobacco cessation, achieving healthy weight and dietary
changes.
2.6 Childhood Obesity Tracks into Adulthood
Of all the aforementioned pathophysiologic risk factors, obesity tracks from
childhood to adulthood the strongest (Daniels et al., 2011). Childhood levels of obesity
are epidemic in the US and since 1980 obesity prevalence in school aged children has
tripled. Data from the 2007 National Survey of Children’s Health and the 2007-2008
NHANES find approximately 32% of youth are overweight and approximately 17% are
obese (Odgen, Carroll, Curtin, Lamb, & Flegal, 2010 ; Singh, Kogan, & van Dyck,
2010). Reports from the most recent NHANES survey 2009-2010 indicate no change in
childhood obesity prevalence from 2007-2008 (Ogden et al., 2010).
Centers for Disease Control and Prevention (CDC) growth charts with BMI
percentiles relative to age and gender are the preferred reference to identify overweight
and obesity in youth from 2 to 18 years of age. Expert committee recommendations with
representation from 15 national health care organizations, recommend using BMI on
individual children in order to assess weight-for-height relationships. BMI as an obesity
measure has limitations such as, it does not directly measure body fat, and does not take
into account skeletal size or muscle mass (Wilk, 2007). Thus, a very muscular person
may have a BMI which falls into an overweight category. Although there are some
limitations, BMI is easily calculated, correlates strongly with direct measure of body fat
body fat, e.g. those above the 85th percentile. The expert committee convened by the
American Medical Association, the CDC and the Maternal and Child Health Bureau
(MCHB) has defined childhood and adolescent obesity as a BMI at or greater than the
95th percentile and BMIs between the 85th and 94th percentiles as overweight (Barlow &
the Expert Committee, 2007; Daniels et al., 2011).
Investigators from the Bogalusa Heart Study reported that childhood BMI is
associated with adult obesity. In this study with over 2600 participants, 77% of obese
youth (BMI at or greater than the 95th percentile) remained obese (BMI at or greater than
30 kg/m²) as an adult. Children 2 to 17 years of age were re-examined at 18 to 37 years
of age. The mean follow-up time was 17 years. The magnitude of correlations between
childhood and adult obesity increased with age of childhood measurement. The BMIs of
2 to 5 year olds were moderately associated with Spearman’s correlation coefficients at
0.50 and 0.45 for males and females respectively. Associations increased with age with
the strongest BMI association occurring in 15 to 17 year old adolescents 0.74 and 0.66
for males and females respectively (Freedman, Khan, Dietz, Srinivasan, & Berenson,
2001; Freedman et al., 2005).
Muscatine researchers report even higher tracking correlations for BMI that range
from 0.58 to 0.91. This study involved 2631 children from 9 to 18 years of age that were
followed into their young adult life and re-examined between the ages of 23 and 33 years.
An interesting finding in this study was that approximately 31% of children in the top
quintile of BMI became adults that fell into a much lower weight category and that
approximately the same percentage of lean children became obese adults. Similar to the
childhood age increased with correlations of adult Quetelet Index (weight divided by
height²) lowest at 0.45 in the 7 to 8 year old female group and reaching a maximum of
0.74 in the 13 to 14 year old males (Clarke & Lauer, 1993).
In the National Heart, Lung and Blood Institute Growth and Health Study (NGHS)
a cohort of 2379 bi-racial females were examined annually from the age of 9 or 10
through 18 to 19 years of age. NGHS-Wave II was conducted as a follow-up telephone
interview when the subjects were between 21 to 23 years of age. There were 2054
participants in NGHS-Wave II which included 991 Caucasians and 1063
African-American girls. Overweight in youth up to 18 years of age was defined by attainment of
the 95th percentile for BMI, and for young adults 21 years of age and older BMI was
defined as at or greater than 30 kg/m². Study participants who were overweight from age
9 to 18 years were 11 to 30 times more likely to be obese as adults compared to not
overweight girls. Investigators noted the limitation that self-reported body measurements
in the follow-up study presented, but nonetheless found these strong associations
noteworthy (Thompson et al., 2007).
2.7 BMI as a Predictor for Dyslipidemias
Bogalusa researchers found that dyslipidemia was associated with increased BMI.
In the Bogalusa study, overweight children 5 to 17 years of age compared to normal
weight children were 2.4 times as likely to have elevated levels of TC, 3.0 times more
likely to have high LDL-C and 3.4 times as likely to have low HDL-C (Freedman, Dietz,
Srinivasan, & Berenson, 1999). NGHS researchers found strong associations between
obesity and some dyslipidemia markers. Obese females 9 to 18 years of age were 6.3
have triglyceride levels at or greater than 130 mg/dl. Obesity in this cohort was not
significantly associated with elevated TC or elevated LDL-C levels. Researchers
adjusted for pubertal maturation as there was some association with lipids. In this
secondary analysis with adjustment for pubertal maturation, elevated LDL-C levels were
significantly associated with obesity with OR = 3.0 (P = .01). Total cholesterol remained
not significantly associated (Thompson et al., 2007).
Holl et al. (2011) report on their findings from a large cross-sectional study
conducted in Germany on subjects that were analyzed beginning in 2003. The study
purpose was to report on the effects of age, gender and obesity category on dyslipidemia
components. Participants included 29,711 overweight and obese subjects from the
German, Austrian and Swiss APV registry (mean age 12.61 + 3.14) and the comparison
group of 11,110 normal-weight subjects from the German Health Interview and
Examination Survey for Children and Adolescents, KIGGS (mean age 9.8 + 4.7).
Cutoffs for abnormal lipid values were based on American Heart Association
recommendations, and with conversion from mmol/L to mg/dl were approximately TC
greater than 200 mg/dl, HDL-C less than 35 mg/dl, LDL-C greater than 130 mg/dl, and
triglycerides greater than 150 mg/dl. Weight classifications used were different than the
customary US standard, and were based on BMI-SDS values calculated with German
normative data. Youth were normal weight with BMI less than the 90th percentile,
overweight with BMI from the 90th to 97th percentile, obese with BMI between the 97th to
99.5th percentile and extremely obese with BMI greater than the 99.5th percentile.
findings which are especially pertinent to the analysis section of this thesis, it is worthy of
inclusion in this review.
As BMI categories increased, the prevalence of hypertriglyceridemia and reduced
HDL-C increased rapidly. A weaker relationship was present for LDL-C and TC,
however still with high significance (p<0.0001). Holl et al. (2011) reported at least one
abnormal lipid value was found in 13.4% of normal-weight subjects, 24.3% of
overweight patients, 27.9% of obese subjects and 31.9% in the extremely obese group
(p<0.0001). Multiple logistic regression analysis with age and gender as covariates in
addition to BMI categories resulted in significant relative risk (RR) increases according
to BMI category increases. The RRs in comparison to normal weight subjects were as
follows: for reduced HDL-C 1.52 (1.24-1.86) in overweight subjects to 4.39 (2.89-3.97)
in extremely obese subjects, for elevated triglycerides 3.21 (1.18-8.75) in overweight
subjects to 4.86 (1.79-13.18) in extremely obese subjects, for LDL-C the RR increased to
1.94 (1.76-2.14) and for TC to 1.43 (1.31-1.57). If the criterion of at least one abnormal
lipid component was applied the RRs were as follows: 2.07 (1.87-2.28) for overweight
subjects, 2.49 (2.33-2.67) for obese subjects and 3.02 (2.83-3.24) for extremely obese
subjects (Holl et al., 2011).
2.8 Lipid Profile Statistics for US Youth
In an effort to present data that is more relevant to the state of current US youth
lipid levels, this review will focus on recent studies that used data from the National
Health and Nutrition Examination Survey (NHANES). NHANES conducted by the
CDC’s National Center for Health Statistics is a population based survey that examines
Data from NHANES is used to produce national estimates of US health and nutrition
status. Previous National Health and Nutrition Examination Survey (NHANES) studies
have found prevalence of dyslipidemias in children and adolescents of approximately
10% for TC, 26% for triglycerides, 6.6% for LDL-C and 19% for HDL-C (Ford, Li,
Zhao, & Mokdad, 2009; Johnson et al., 2009; Li et al., 2010).
Li and colleagues (2010) compared statistics from a large national insurance
claims database and NHANES 1999-2004 survey data. In analysis of data from the
NHANES cohort an estimated 7.4 million children out of 30 million US children
(weighted frequency with fasting weights, unweighted n=585) had laboratory-defined
dyslipidemia. Laboratory defined dyslipidemia was identified by subjects having at least
one abnormal lipid measure regardless of fasting status. The dyslipidemic measurements
were as follows: TC >200 mg/dl, HDL-C < 35 mg/dl, LDL-C > 130 mg/dl, Triglycerides
> 130 mg/dl, Apolipoprotein A-I, (Apo-A) < 110 mg/dl, or Apolipoprotein B (Apo-B) >
100 mg/dl. With application of mobile examination center (MEC) and fasting weights
this yielded a prevalence of approximately 19.9% (95% CI: 18.3-21.6) to 23.9% (95%
CI: 21.60-26.27) respectively.
Children from 10 to 18 years of age with laboratory defined dyslipidemia were
defined from the Integrated Healthcare Information Services (IHCIS) database for the
years from 2003-2006. The IHCIS database contained 273,064 children with at least one
laboratory lipid value. Of these children 22.9% (n=62451) had laboratory defined
dyslipidemia. A comparison cohort of 10 to 18 year old children was derived from
NHANES survey years 1999-2004. Prevalence for the IHCIS and NHANES cohorts
overall dyslipidemia was similar, the prevalence for TC, HDL-C and LDL-C was lower
in the IHCIS cohort (TC 9.6% vs. 7.7%, HDL-C 6.7% vs. 4.1%, and LDL-C 7.2% vs.
3.2%). Several theories for this were suggested by the researchers, such as insured status,
health status, interventions and selection bias (Li et al., 2010).
The occurrence of dyslipidemias differed by age and gender amongst the two
cohorts. In the NHANES cohort 10 to11 year old boys displayed the highest prevalence
(58%) of TC compared to 16-18 year old boys with the lowest prevalence (27%).
Whereas TC prevalence for girls in the NHANES group was 45% in the 12 to 13 year old
group and increased to 63% in the 16 to 18 year old girls. The same trends were seen in
the IHCIS cohorts for boys and girls.
For HDL-C, age-related dyslipidemia was reversed, with 10 to 11 year old boys in
the NHANES group at the lowest prevalence (24%) compared to 16 to 18 year boys with
the highest prevalence (57%). This same trend was found in the IHCIS cohort, with the
boys steadily increasing prevalence of dyslipidemic HDL-C with age. There were
differences between the cohorts for girls with dyslipidemic HDL-C. In the NHANES
cohort, dyslipidemic HDL-C decreased as the girls increased in age, whereas in the
IHCIS girl’s cohort this did not occur.
For dyslipidemic triglycerides no age-related changes were found in the NHANES
groups, whereas in the IHCIS cohort boys demonstrated an age-related increase. LDL-C
dyslipidemias were highest in the NHANES 10 to 13 year old boys at 37% compared to
prevalence of 23% in the 16 to 18 year group. Smaller age-related increases were also
found in the IHCIS boys. Girls in both cohorts experienced age-related increases (J. Li
IHCIS cohort data shows a decrease in TC dyslipidemia prevalence in the 12 to 13
year old female group and 14 to 15 year old male group which then begins to rebound
with increasing age. This same trend occurs for LDL-C. Detailed data on the NHANES
cohort was not available for comparison. This change in dyslipidemic TC and LDL-C
prevalence at pubertal ages is consistent with other reported research where TC and
LDL-C levels decreased by 10 to 20% during puberty (Berenson, Srinivasan, LDL-Cresanta, Foster,
& Webber, 1981; Kwiterovich et al., 1997).
Hickman et al. (1998) report on lipid distributions of NHANES data (1988-1994)
which demonstrate similar trends for TC and HDL-C. Children in the 9 to 11 year old
group had the highest mean TC values (171 mg/dl). Females had higher mean TC (167
mg/dl) than males (163 mg/dl). Among racial groups non-Hispanic blacks had
significantly higher mean TC values (170 mg/dl) than non-Hispanic whites (164 mg/dl)
or Mexican Americans (164 mg/dl). Consistent with research on pubertal changes, boys
mean TC levels were significantly less in the 12 to 15 year old group compared to boys 9
to 11 years of age (P < 0.0001). Hickman and colleagues report that mean TC levels
among adolescents decreased by 7 mg/dl (P<0.0001) from 1966 to 1994. This same
trend had previously been reported in adults and is believed to have contributed to the
decrease in mortality from CHD during the same period of time.
HDL-C levels were relatively constant across all age groups, except that boys
mean HDL-C levels decreased significantly from the 9 to 11 age group to the 12 to 15
year old group (P < 0.0001). Overall, the means for HDL-C were similar for both sexes.
Although in females the mean steadily increased with age, whereas in boys the mean was
the highest mean HDL-C levels (55 male, 56 female) compared to non-Hispanic whites
(48 male, 50 female) and Mexican Americans (51 male, 52 female).
The Expert Panel on Integrated Guidelines for Cardiovascular Health and Risk
Reduction in Children and Adolescents include in their report that differences exist
according to race and ethnicity according to geography and that these differences could
be explained in part by socioeconomic status. However, the Expert Panel also points out
“that no group in the U.S. is without a significant prevalence of risk” (Kavey,
Simons-Morton, & de Jesus, 2011, p. S4). Several longitudinal cohort studies have included
biracial populations, but longitudinal studies that include Hispanic, Asian and Native
American youth are lacking. The Expert Panel acknowledges that differences exist in
risk factor prevalence according to gender and race and that low socioeconomic status
alone confers substantial risk. However, the “evidence is not adequate” for the Expert
Panel to make recommendations specific to racial or ethnic groups or socioeconomic
status (Kavey et al., 2011, p. S4).
2.9 Reliability of BMI at 85th percentile as a Risk Factor
As previously described, a number of prospective studies have reported tracking of
lipid levels from childhood into adulthood. These studies have found that youth to adult
levels correlate in the range of 0.4 (Daniels et al., 2011). However, Magnussen et al.
(2008) report on the instability of the classification of blood lipid levels in youth, to
predict dyslipidemias in adults. The results of their study show that 60% of youth who
were identified with high risk LDL cholesterol levels did not have abnormal levels as
as youth. These findings contribute to the uncertainty surrounding the approach to and
utility of screening for pediatric dyslipidemias (Magnussen et al., 2011, p. 68).
There is a volume of research that has examined the relationship between
adiposity status and CVD risk factors in youth and which demonstrate positive
correlations. However studies are lacking which assess relationships with dyslipidemia
and BMI at the 85th percentile or greater, the AAP screening criteria in youth. The
majority of research on US children has examined the relationship of obese, not
overweight children and atherosclerosis development through pathology studies,
sub-clinical measures or lipid levels. There are a number of international studies that have
found positive associations between increasing levels of adiposity and more severe
dyslipidemias (Flechtner-Mors et al., 2011; Katzmarzyk, Tremblay, Perusse, Despres, &
Bouchard, 2003; Kim Soh Ye, Hong Kyung Hee, Jang Ki Hyo, Kang Soon Ah, & Choue
Ryo Won, 2005; Takada et al., 1998; Zhai et al., 2004). These studies however, are not
readily generalized to the US pediatric population because many studies were conducted
in Asian populations whose diets are often dissimilar to western foods and because they
used different classification systems for childhood obesity making them difficult to
compare (Cole, Bellizzi, Flegal, & Dietz, 2000).
In a more recent US study Lamb, Ogden, Carroll, Lacher, and Flegal (2011),
analyzed National Health and Nutrition Examination Survey data (1999-2004) for
associations between childhood adiposity and lipid levels. However, due to concern
about the accuracy of BMI as an adiposity measure, researchers instead measured body
fat percentage by dual-energy X-ray absorptiometry. A recent study by Lee and
or LDL-C levels and called into question the current screening recommendations. The
study population was a NHANES cohort from 1999-2004 survey years. Children 3 to 18
years of old were evaluated for TC and HDL-C levels and 12 to 18 years of age for
LDL-C and triglycerides. The researchers used receiver operating characteristic (ROLDL-C) curves
to evaluate the performance of specific BMI percentiles in predicting dyslipidemias.
ROC analysis for BMIs at the 85th percentile produced area under the curve values of
0.60 for TC, 0.63 for LDL-C, 0.69 for HDL-C and 0.72 for triglycerides.
Lee et al. (2009) also calculated sensitivity, specificity, positive predictive values
(PPVs), and negative predictive values (NPVs) for each lipid factor at different BMI
percentile thresholds. BMI at the 85th percentile as a threshold screening test for TC
dyslipidemia resulted in sensitivity and specificity levels of 53% and 63% respectively,
PPV (14%) and NPV (93%). BMI at the 85th percentile as a screening test for HDL-C
dyslipidemia resulted in sensitivity and specificity of 63% and 65% respectively, PPV
(11%) and NPV (97%).
National expert guidelines recommend BMI at the 85th percentile as the screening
threshold for children and adolescents at risk for dyslipidemia, although research to
support this cutpoint is unclear. Even the Expert Panel Guidelines, with their extensive
research review, do not include studies on this specific relationship. The association of
childhood obesity and cardiovascular disease is well documented. However, additional
research is needed on the relationship of overweight youth and dyslipidemia prevalence.
Cardiovascular disease primary prevention goals for youth address two main areas:
prevention of the development of risk factors and prevention to recognize and manage
guidelines which delineate children at risk who should receive targeted screening.
Screening guidelines include recommendations to perform serum lipid evaluations on
overweight children. The objective of this thesis is to add to the body of knowledge
concerning the relationship between youth with BMIs at the 85th percentile or greater and
CHAPTER III METHODOLOGY
3.1 Subjects
The data source for this study is the National Health and Nutrition Examination
Survey (NHANES) 2007-2008 and 2009-2010 survey years. NHANES is conducted
through the National Center for Health Statistics of the Centers for Disease Control and
Prevention (CDC). The survey program began in the 1960s and since has evolved into a
continuous program that is conducted every two years. NHANES is highly regarded as
the most comprehensive study of the health and nutrition status of adults and children in
the US. Strict confidentiality is maintained throughout the process. De-identified survey
data are publicly available through the NHANES website. The survey combines
interview and physical examination data from a nationally representative sample of
approximately 5,000 persons each year. The NHANES interview is conducted in the
sample person’s home and includes demographic, socioeconomic, nutrition and
health-related questions. The examination section is conducted in the mobile examination
center (MEC) by physicians and highly trained medical personnel. The examination
includes medical, dental, and physiological measurements and laboratory tests (Centers
for Disease Control and Prevention, 2012).
NHANES is conducted according to strict protocol and informed consent is
obtained from participants. For each survey cycle, NHANES undergoes National Center
for Health Statistics (NCHS) Research Ethics Review Board Approval. Manuals
NHANES website. These manuals contain exact details on all policies, procedures and
standards for conducting NHANES survey components (Centers for Disease Control and
Prevention, 2011). Georgia State University Institutional Review Board approval was
granted for this study under Protocol Type H12278, Exempt Review, Category 4.
NHANES uses a complex, multistage, probability sampling design in an effort to
select participants that are representative of the civilian, non-institutionalized US
population. Certain subgroups are oversampled in order to produce reliable statistics.
NHANES oversamples the elderly, Hispanics, African-Americans and low income
persons. In the first stage primary sampling units (PSUs) are selected, which are mostly
single counties or less often groups of contiguous counties. These PSUs are selected
from strata defined by geography and proportions of minority populations. In the second
stage, PSUs are divided into segments such as city blocks. In stage 3, households are
randomly selected from each segment. In stage 4, individuals are randomly chosen to
participate from all persons residing in the household, which results in approximately 1.6
persons per household. Each sample person is assigned a sample weight. This weight is
used to produce an unbiased national estimate (Centers for Disease Control and
Prevention, n.d.).
The original 2007-2008 survey consisted of 10149 sample persons and the
2009-2010 survey had 10537 sample persons. Complete body measurements were available on
8088 sample persons from the 2007-2008 survey and 8608 sample persons from the
2010 survey. Of these 7387 and 7846 sample persons in the 2007-2008 and
2009-2010 respective surveys had TC and HDL-C laboratory values. In these survey years,
6 years of age. The subset for the present study consists of males and females 6 through
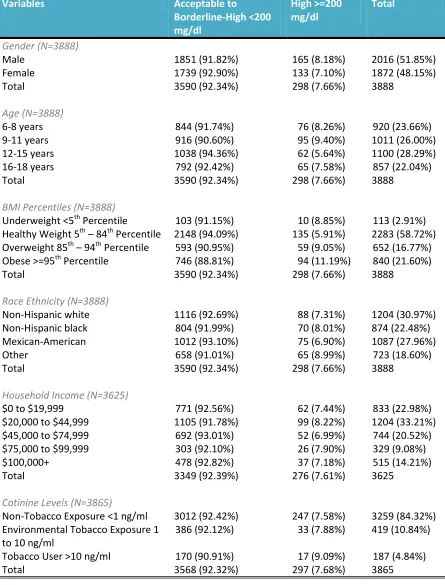
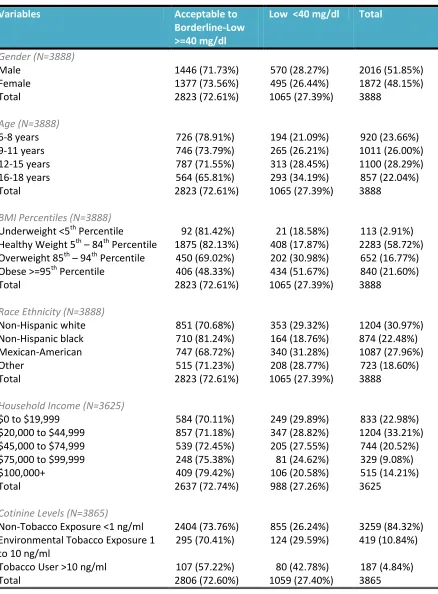
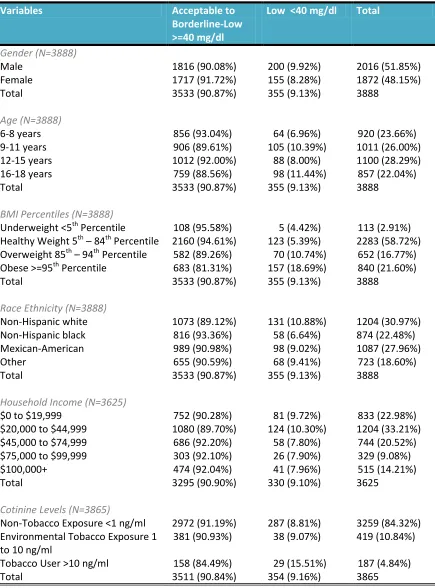
18 years of age who had complete body measurements, TC and HDL-C measurements.
The final data set of combined survey cycles contains 3888 participants of which 2016
are male and 1872 are female.
Beginning in 2007 NHANES employed a new sampling methodology, whereby
other Hispanics were oversampled, not just Mexican-Americans. For example in the
2005-2006 cycle other Hispanics comprised 3.3% of the unweighted sample size,
whereas in 2007-2008 this unweighted sample consisted of 11.7% and 10.8% in
2009-2010. The like percentages for Mexican-Americans were as follows: 2005-2006
(27.5%), 2007-2008 (21.1%) and 2009-1010 (22.5%). The non-Hispanic black
unweighted sample decreased from 26.3% in 2005-2006, to 21.9% in 2007-2008 and
finally 18.6% in 2009-2010. The non-Hispanic white and other race/ethnicity categories
both had small increases overall. Beginning with the 2007 year survey, changes in the
age domains led to a decrease in the number of participants under 20 years old and an
increase in the number of participants 40 years of age or greater. Also beginning with the
2007-2008 survey, pregnant women were no longer oversampled.
NHANES has been in existence for over 50 years and is renowned as a
comprehensive, national data source for health research interests. NHANES is highly
regarded for adhering to rigorous sampling and data collection processes. Although the
researchers are highly trained and protocols are followed, there is always the possibility
for human and/or technical error. For NHANES in general, selection bias can be present
as subjects are invited to participate and are paid for their participation. As a result, the
participants do not have to complete all components of the survey. For example
questions may not be answered and laboratory tests refused. The interview component
relies on self-reported information thus lending itself to error with recall or information
bias. There is limitation of race/ethnicity groups. The sampling methodology of
NHANES produces three main groups, Mexican-American, Hispanic black and
non-Hispanic white. The 2007 sampling change has enlarged the other non-Hispanic sample
group, which allows for stronger analysis of this group. There is no distinct Asian group.
Parameters for exam, laboratory analysis and interview questions vary especially
by age. For example TC and HDL-C testing begins at age 6 years, but triglyceride and
LDL-C testing begins at age 12 years and is restricted to fasting individuals. Since all
participants may not adhere to fasting instructions or falsely report their fasting time, this
could affect the reliability of these lab values. In addition, because a fasting state was
required, noncompliance would further decrease the number of participants who would
be eligible for this component of the exam. In another example, history of hypertension
was initially considered for inclusion in the present study, as a possible confounder, but
was not, because blood pressure interview questions in NHANES are only asked of
participants who are at least 16 years of age.
3.2 Definition of Terms
The variables used in this study are gender, age, race/ethnicity, income, cotinine,
BMI percentile, TC, HDL-C and non-HDL-C. Age is measured in months at the time of
MEC. The study cohort includes youth from 72 through 227 months of age. The lower
threshold of 72 months was selected because this is the minimum age for NHANES