R E S E A R C H A R T I C L E
Open Access
Quantitative magnetic resonance imaging
(MRI) analysis of anterior talofibular
ligament in lateral chronic ankle instability
ankles pre- and postoperatively
Wei Liu
1,2†, Hong Li
1†and Yinghui Hua
1*Abstract
Background:The aim of this study was to quantitatively evaluate and characterize the dimension and signal intensity of anterior talofibular ligament (ATFL) using 3.0 T MRI in the mechanical ankle instability group pre- and postoperatively. Methods:A total of 97 participants were recruited retrospectively in this study, including 56 with mechanical chronic ankle instability (CAI group) and 41 without ankle instability (Control group). All the subjects accepted MRI preoperatively. Among the 56 CAI patients, 25 patients, who accepted modified Broström repair of ATFL, underwent a MRI scan at follow-up. The ATFL dimension (length and width) and signal/noise ratio (SNR) were measured based on MRI images. The results of the MRI studies were then compared between groups.
Results: The CAI group had a significantly higher ATFL length (p= 0.03) or ATFL width (p< 0.001) compared with the control group. The mean SNR value of the CAI group was significantly higher than that of the control group (p= 0.006). Furthermore, the mean SNR value of the ATFL after repair surgery (8.4 ± 2.4) was significantly lower than that of the ATFL before surgery (11.2 ± 3.4) (p< 0.001). However, no significant change of ATFL length or ATFL width were observed after repair surgery.
Conclusions:CAI ankles had a higher ATFL length or width as well as higher signal intensity compared with stable ankles. After repair surgery, the mean SNR value of the ATFL decreased, indicating the relaxed ATFL becomes tight postoperatively.
Keywords: Ankle, Atfl, Instability, Repair, MRI
Background
Ankle sprain is one of the most common injuries during sports activity, with anterior talofibular ligament (ATFL) injury in most cases [1, 2]. After ATFL injury, symptom-atic chronic ankle instability may develop in as many as 20% to 40% of patients even after conservative treatment, associated with a high rate of recurrence [3, 4]. To date, there are various methods to diagnose ATFL injury, in-cluding manual anterior drawer test (ADT), stress X-ray image, magnetic resonance imaging (MRI), ultrasound,
arthroscopy [5]. Compared with other tools, MRI is a non-invasive powerful tool in analyzing and evaluating ATFL dimension or signal intensity [2, 6–8]. It has excel-lent accuracy and interobserver reliability for detecting ATFL injuries [9, 10]. However, these studies only qualita-tively diagnosed ATFL with intact, or partial tear or complete tear [11].
Previously, Dimmick et al. [12] analyzed dimension and appearance of ATFL using MRI, and they found normal ATFL had mean thickness of 2.19 ± 0.6 mm and appeared homogeneously hypointense on MRI. More-over, Delfaut et al. [13] delineated contour and signal variations of normal ATFL on MRI images, and they ob-served that 16 of 22 of the ATFL demonstrated a low signal intensity and 8 of 22 revealed a subtle increased
* Correspondence:[email protected]
†Equal contributors
1Department of Sports Medicine, Huashan Hospital, No 12, Wulumuqi Zhong
Road, Shanghai 200040, People’s Republic of China
Full list of author information is available at the end of the article
signal intensity. Perrich et al. [14] also reported that in-tact ATFL ligament was of uniform thickness and low signal intensity and injured ATFL revealed thickened with increased internal signal intensity on MRI. How-ever, there is lack of quantitative analysis of ATFL signal intensity in these studies.
In addition, there are various operative procedures to treat ATFL injury, including modified Broström ATFL repair and ligament reconstruction with tendon [15–18]. The modified Broström ATFL repair is the first-line safe choice for chronic ankle instability, recovering ankle sta-bility and allowing patients return to pre-injury sport activities [15, 16]. At an average follow-up of 8.7 years after Broström repair surgery, Maffulli et al. [15] re-ported that ankle function improved significantly. To our knowledge, there is lack of image-based research re-garding the ATFL dimension and signal intensity after ATFL surgical repair at follow-up.
Therefore, the aim of the present study was to evaluate ATFL dimension (length and width) and signal intensity on MRI in a group of lateral chronic ankle instability pa-tients pre- and postoperatively. We had two hypotheses: (1) ATFL in CAI group had a higher signal intensity than that in ankle stable group; (2) MRI signal intensity of the ATFL decreased after surgery.
Methods Participants
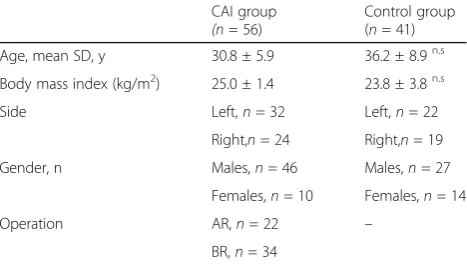
The study was approved by Health Sciences Institutional Review Board of our hospital, and written consent was obtained from all participants. A total of 97 consecutive participants from June 2013 to April 2016 were recruited retrospectively in this study, including 56 with mechan-ical lateral chronic ankle instability (CAI group) and 41 without ankle instability (Control group). All the partici-pants had MRI scan preoperatively. CAI was diagnosed clinically by clinical history (pain or giving way, repeti-tive inversion sprains for more than 3 months), physical examination (ADT) and MRI. The ADT is carried out with the lower leg hanging free, knee flexed. The ankle is in 10° to 20° of plantar flexion, and the tibia stabilized with one hand and the heel grasped with the other. The heel is drawn forward with an anterior translation. It in-dicated the lateral ligament was injured, if the talus moved out of the ankle mortise anteriorly [19]. For the CAI group, the exclusion criteria were (1) obvious bone fracture of the ankle or foot on the affected side, (2) pre-vious surgery of the affected limb, (3) functional ankle instability, (4) an avulsion at the fibular or talus attach-ment and (5) acute sprain. For the control group, ankles with healthy ATFL were recruited. Participants’ demo-graphic data was shown in Table 1. The two groups did not differ significantly in age (p > 0.05) or BMI (p> 0.05).
The records of 56 consecutive CAI patients who underwent ankle arthroscopy followed by repair or reconstruction were retrospectively reviewed. Patients were considered for surgery if conservative treatment failed to substantially alleviate the symptoms for at least 3 months. One senior surgeon performed all the opera-tions as described previously [20, 21]. Under arthros-copy, an ATFL injury was diagnosed if an abnormal course of the ligament, a decrease in the tautness of the ligament, discontinuity of the ligament with or without the defect being filled by fibrous tissue, or an avulsion at the attachment to the fibula or talus [9]. Among the 56 CAI patients, 22 patients accepted ATFL reconstruction with tendons, and 34 patients accepted modified Broström repair of ATFL. Postoperatively, ankle was immobilized in a neutral position using a short leg cast. Rehabilitation ex-ercises including isometric contraction of muscle groups around the ankle joint started from the day after surgery. The cast was removed 2-4 weeks after surgery. Among the 34 patients accepting Broström repair, 25 patients came back for follow-up investigation at approximately 6 to 12 months after surgery and underwent MRI scan.
MRI scan and image analysis
Imaging was performed in a relaxed in a neutral pos-ition with a 3.0-T magnetic resonance imaging (MRI) scanner (MAGNETOM Verio, A Tim system, Siemens, Germany). All the participants had at least 1 h rest be-fore MRI scan. Axial images were obtained with proton density–FS: repetition time, 3000 milliseconds; echo time, 32 milliseconds; matrix, 205 * 256; field of view, 15 * 15 cm; slice thickness, 3 mm; scan time, 1 min, 15 s. All these images were imported into Siemens Soft-ware Packages (NUMARIS/4, SyngoMR B17, Siemens, Germany) and all the calculations were made from the middle axial slices of ATFL using this software.
[image:2.595.305.539.100.232.2]One slice image in each ankle, which revealed the ATFL clearly, would be chosen to make MRI evaluation. The MRI evaluation focused on 3 measurements (Fig. 1):
Table 1Participant Demographic Data of the Study Groups
CAI group (n= 56)
Control group (n= 41)
Age, mean SD, y 30.8 ± 5.9 36.2 ± 8.9n.s
Body mass index (kg/m2) 25.0 ± 1.4 23.8 ± 3.8n.s
Side Left,n= 32 Left,n= 22
Right,n= 24 Right,n= 19
Gender, n Males,n= 46 Males,n= 27
Females,n= 10 Females,n= 14
Operation AR,n= 22 –
BR,n= 34
(1) The signal intensity (SI) was calculated at the ATFL site as well as the background site using a region of interest (ROI). The ROI of ATFL was defined by drawing
the contour of the whole ATFL, and the signal intensity of ATFL was directly measured. The ROI of the ground was defined by drawing a circle as the back-ground site approximately 2 cm near the ATFL. To quantify the normalized signal intensity of the ATFL, the signal/noise ratio (SNR) was calculated using the follow-ing equation: SNR = signal of ATFL / signal of back-ground [22]. (2) The length of the ATFL. The ATFL was lined extending from the anterior and inferior borders of the fibula to the neck of the talus. (3) The width of the ATFL. It was calculated the following equation: The width of ATFL = The area of ATFL / the length of the ATFL. The MRI reader was blinded to the type of oation procedure. All of the measurements were per-formed by two investigators and repeated measurements were made on 2 days at least 1 month apart.
Statistical analyses
Data analysis was performed using Stata 10.0 software (Stata Corp, USA), and the data are reported as means and standard deviations. At first, post hoc power analysis was performed. If a minimal clinically important differ-ence of 3 mm in the graft length or width between groups, it was considered a clinically significant differ-ence of graft length or width. To quantify the proportion of the variance for all of the measurements, the intra-class correlation coefficient (ICC) was assessed by exam-ining the interobserver and intraobserver reliabilities. The ICC was interpreted as poor if ICC < 0.4; as mar-ginal if 0.4≤ICC≥0.75; and as good if ICC > 0.75. Aχ2 test was used to compare the categorical variables. A two-sample t test or two-sample Wilcoxon rank-sum test was used to compare the continuous variables be-tween groups. A paired t-test would be most appropriate when comparing the preoperative and postoperative MRI parameters of the ATFL. Spearman’s correlation co-efficients were calculated between ATFL-related value (length, width or SNQ) and various factors (Gender, Age, BMI, Injury time). The significance level was set at 0.05.
Results
For every patient, ATFL could be easily followed on axial slices from its fibular origin to its talar insertion. The ICC index of interobserver reliability was 0.79 for the graft length and 0.76 for the SNR value. The ICC index of intraobserver reliability was 0.80 for the graft length and 0.84 for the graft SNR value. The CAI group had a significantly higher ATFL length (15.9 ± 2.9 mm vs 14.7 ± 2.3 mm;p= 0.030) or ATFL width (3.9 ± 1.3 mm vs 2.8 ± 0.7 mm; p< 0.001) compared with the control group. For ligament signal, the mean SNR value of the CAI group (12.85 ± 7.80) was significantly higher than that of the control group (9.14 ± 3.58) (p= 0.006).
[image:3.595.57.291.85.572.2]Possible associations between potential risk factors and the ATFL-related value (SNR value or length or width) were explored (Table 2). For the control group, there was no significant association between the ATFL-related value (SNR value or length or width) and gender, age or BMI. Similarly for the CAI group, there was also no significant association between the ATFL-related value (SNR value or length or width) and gender, age, BMI or injury time.
For the 25 patients accepting repair surgery, there was no significant difference before and after surgery regard-ing the ATFL length (15.9 ± 2.2 mm vs 15.5 ± 2.2 mm;
p> 0.05) or ATFL width (4.2 ± 1.0 mm vs 4.7 ± 1.3 mm;
p > 0.05). For ligament signal, the mean SNR value of the ATFL decreased from 11.2 ± 3.4 preoperatively to 8.4 ± 2.4 postoperatively with significant difference (p< 0.001).
Discussion
In the present study, we, for the first time, analyzed and evaluated the dimension and signal intensity of the ATFL on MRI images in the chronic ankle instability group pre- and postoperatively. It was found that the CAI ankles had a higher ATFL length or width as well as higher signal intensity compared with stable ankles. In addition, the mean SNR value of the ATFL after re-pair surgery was significantly lower than that of the ATFL before surgery. The final results verified the two hypothesis mentioned afore.
The ATFL, a flat and quadrilateral ligament, originates from the inferior oblique segment of the anterior border of lateral malleolus, coursed anteromedially and inserted on the talar body just anterior to the lateral malleolar ar-ticular surface [23]. Previously, Taser et al. [23] directly measured the mean ATFL length and width in cadavers. They found that the mean ATFL length was 22.37 ± 2.50 mm, and the mean ATFL width was 10.77 ± 1.56 mm at proximal site, 6.75 ± 2.89 mm at middle site, 10.96 ± 2.38 mm at distal site. In 2011, Boonthathip et al. [24] measure the ATFL length and
width in cadavers using MRI, and they observed that the mean ATFL length and width (the widest portion) was 21.2 ± 5.6 mm and 4.4 ± 1.0 mm respectively. Recently, Cho et al. [5] reported that ATFL length was 28 ± 3 mm in stress and 21 ± 2 mm in resting respectively using ultrasound examination. In the present study, the mean ATFL length was 14.7 ± 2.3 mm, and the mean ATFL width was 2.8 ± 0.7 mm for the stable ankles. These re-sults were different with the analysis in cadavers or with ultrasound. This might be due to the different scan angle. MRI was performed axially, while the measure-ment was a long with the oblique ligameasure-ment in cadavers or with ultrasound.
Previously, Dimmick et al. [12] reported the mean thick-ness of the intact ATFL was 2.19 ± 0.6 mm, and the mean thickness of the injured ATFL was 2.26 ± 0.53 mm in men and 2.18 ± 0.61 mm in women on MRI images. Our result regarding the ATFL width was similar with them. Further-more, Dimmick et al. [12] investigated the mean ATFL thickness between the gender and they found no signifi-cant difference of the mean injured ATFL thickness be-tween the men and the women. In our study, there was also no significant association between the ATFL-related value (SNR value or length or width) and gender.
[image:4.595.58.540.598.724.2]In the present study, the mean ATFL length and width of the CAI group were 15.9 ± 2.9 mm and 3.9 ± 1.3 mm respectively, higher than those of the control group. Re-cently, Cho et al. [5] used stress ultrasound to measure the ATFL length in CAI ankles. They found that the mean value of the ATFL length in resting was 21 ± 2 mm for the CAI ankles and 21 ± 1 mm for the contralateral ankles, while there was no significant dif-ference for relaxed ATFL length between both ankles. The difference might be due to two reasons: (1) The contralateral ankles were used as a control condition for comparisons while we used another healthy ankles as control group. (2) the CAI group by Cho et al. accepted repair procedure, while 22 patients accepted ATFL re-construction as the rere-construction group had a higher ATFL length in the present study.
Table 2Possible associations between several factors and anterior talofibular ligament (ATFL)-related value (SNR value or length or width)
Variable Length Width SNR
rho Pvalue rho Pvalue rho Pvalue
Control group Gender −0.02 0.92 0.27 0.08 0.22 0.16
Age −0.02 0.92 0.11 0.48 0.30 0.06
BMI −0.08 0.61 0.29 0.06 0.05 0.73
CAI group Gender −0.20 0.14 −0.22 0.10 0.03 0.83
Age −0.09 0.51 −0.08 0.56 −0.01 0.94
BMI −0.01 0.94 0.03 0.78 −0.20 0.14
Injury time −0.10 0.45 0.02 0.88 −0.20 0.14
In this study, the mean SNR value of the CAI group was significantly higher than that of the control group. Generally, normal ATFL on MRI revealed a low signal intensity structures [13]. After repetitive inversion sprains, ATFL demonstrated an increased ligament sig-nal on MRI, as fluid crossing part or all of the ligament [25, 26]. Furthermore, the mean SNR value of the ATFL after repair surgery was significantly lower than that of the ATFL before surgery. Previous investigations have reported that ligament signal intensity has a good nega-tive linear relationship with the material biomechanical strength properties [27, 28]. Lower SNR indicated higher ligament tension. After Broström repair surgery, the re-laxed ATFL became more tight and revealed a lower sig-nal intensity. According to our results, the mean SNR value of the repair ATFL was 8.4 ± 2.4 postoperatively, which is almost the same with that of the healthy ATFL. It was presumed that the injured ATFL got back to nor-mal after surgery. It was also believed that the SNR might be a indirect parameter to indicate if the ATFL is successfully repaired in clinical practice.
Conclusion
Chronic instability ankles had a higher ATFL length or width as well as higher signal intensity compared with stable ankles. In addition, the mean SNR value of the ATFL decreased after repair surgery, indicating the relaxed ATFL becomes tensional postoperatively. This study provides valuable quantitative information regarding the ligament dimension and signal intensity pre- and postoperatively.
Abbreviations
ATFL:Anterior talofibular ligament; CAI: Chronic ankle instability; SNR: Signal/ noise ratio
Acknowledgements
Not applicable.
Funding
None.
Availability of data and materials
The datasets during and/or analysed during the current study available from the corresponding author on reasonable request.
Authors’contributions
WL performed the follow-up experiments. YHH gave the experiment guid-ance during this study. WL and HL analyzed and interpreted the data and was a major contributor in writing the manuscript. All authors read and ap-proved the final manuscript.
Ethics approval and consent to participate
The study was approved by the Health Sciences Institutional Review Board of Huashan hospital Fudan University (2016-002), and written consent was obtained from all participants.
Consent for publication
Not applicable.
Competing interests
The authors declare that they have no competing interests.
Publisher’s Note
Springer Nature remains neutral with regard to jurisdictional claims in published maps and institutional affiliations.
Author details
1Department of Sports Medicine, Huashan Hospital, No 12, Wulumuqi Zhong
Road, Shanghai 200040, People’s Republic of China.2Department of
Orthopedics, Taihe Hospital of Traditional Chinese Medicine, Tuanjie Xi Road No.59, Anhui 236607, People’s Republic of China.
Received: 19 May 2017 Accepted: 7 September 2017
References
1. Gribble PA, Terada M, Beard MQ, Kosik KB, Lepley AS, McCann RS, Pietrosimone BG, Thomas AC. Prediction of lateral ankle sprains in football players based on clinical tests and body mass index. Am J Sports Med. 2016;44:460–7.
2. Roemer FW, Jomaah N, Niu J, Almusa E, Roger B, D'Hooghe P, Geertsema C, Tol JL, Khan K, Guermazi A. Ligamentous injuries and the risk of associated tissue damage in acute ankle sprains in athletes: a cross-sectional MRI study. Am J Sports Med. 2014;42:1549–57.
3. Janssen KW, Hendriks MR, van Mechelen W, Verhagen E. The cost-effectiveness of measures to prevent recurrent ankle sprains: results of a 3-arm randomized controlled trial. Am J Sports Med. 2014;42:1534–41. 4. Takao M, Miyamoto W, Matsui K, Sasahara J, Matsushita T. Functional
treatment after surgical repair for acute lateral ligament disruption of the ankle in athletes. Am J Sports Med. 2012;40:447–51.
5. Kim SH, Kim J, Choi YE, Lee HR. Healing disturbance with suture bridge configuration repair in rabbit rotator cuff tear. J Shoulder Elb Surg. 2016;25: 478–86.
6. Park HJ, Cha SD, Kim SS, Rho MH, Kwag HJ, Park NH, Lee SY. Accuracy of MRI findings in chronic lateral ankle ligament injury: comparison with surgical findings. Clin Radiol. 2012;67:313–8.
7. Kanamoto T, Shiozaki Y, Tanaka Y, Yonetani Y, Horibe S. The use of MRI in pre-operative evaluation of anterior talofibular ligament in chronic ankle instability. Bone Joint Res. 2014;3:241–5.
8. van Putte-Katier N, van Ochten JM, van Middelkoop M, Bierma-Zeinstra SM, Oei EH. Magnetic resonance imaging abnormalities after lateral ankle trauma in injured and contralateral ankles. Eur J Radiol. 2015;84:2586–92. 9. Kim YS, Kim YB, Kim TG, Lee SW, Park SH, Lee HJ, Choi YJ, Koh YG. Reliability
and validity of magnetic resonance imaging for the evaluation of the anterior Talofibular ligament in patients undergoing ankle arthroscopy. Arthroscopy. 2015;31:1540–7.
10. Park HJ, Lee SY, Park NH, Rho MH, Chung EC, Park JH, Park SJ. Three-dimensional isotropic T2-weighted fast spin-echo (VISTA) ankle MRI versus two-dimensional fast spin-echo T2-weighted sequences for the evaluation of anterior talofibular ligament injury. Clin Radiol. 2015;71:349–55. 11. Lee KM, Chung CY, Kwon SS, Chung MK, Won SH, Lee SY, Park MS.
Relationship between stress ankle radiographs and injured ligaments on MRI. Skelet Radiol. 2013;42:1537–42.
12. Dimmick S, Kennedy D, Daunt N. Evaluation of thickness and appearance of anterior talofibular and calcaneofibular ligaments in normal versus abnormal ankles with MRI. J Med Imaging Radiat Oncol. 2008;52:559–63.
13. Delfaut EM, Demondion X, Boutry N, Cotten H, Mestdagh H, Cotten A. Multi-fasciculated anterior talo-fibular ligament: reassessment of normal findings. Eur Radiol. 2003;13:1836–42.
14. Perrich KD, Goodwin DW, Hecht PJ, Cheung Y. Ankle ligaments on MRI: appearance of normal and injured ligaments. AJR Am J Roentgenol. 2009; 193:687–95.
15. Maffulli N, Del Buono A, Maffulli GD, Oliva F, Testa V, Capasso G, Denaro V. Isolated anterior talofibular ligament Brostrom repair for chronic lateral ankle instability: 9-year follow-up. Am J Sports Med. 2013;41:858–64. 16. Huang B, Kim YT, Kim JU, Shin JH, Park YW, Kim HN. Modified Brostrom
procedure for chronic ankle instability with generalized joint Hypermobility. Am J Sports Med. 2016;44:1011–6.
18. Matheny LM, Johnson NS, Liechti DJ, Clanton TO. Activity level and function after lateral ankle ligament repair versus reconstruction. Am J Sports Med. 2016;44:1301–8.
19. van Dijk CN, Mol BW, Lim LS, Marti RK, Bossuyt PM. Diagnosis of ligament rupture of the ankle joint. Physical examination, arthrography, stress radiography and sonography compared in 160 patients after inversion trauma. Acta Orthop Scand. 1996;67:566–70.
20. Hua Y, Chen S, Li Y, Chen J, Li H. Combination of modified Brostrom procedure with ankle arthroscopy for chronic ankle instability accompanied by intra-articular symptoms. Arthroscopy. 2010;26:524–8.
21. Hua Y, Chen S, Jin Y, Zhang B, Li Y, Li H. Anatomical reconstruction of the lateral ligaments of the ankle with semitendinosus allograft. Int Orthop. 2012;36:2027–31.
22. Park HJ, Lee SY, Park NH, Rho MH, Chung EC, Park JH, Park SJ. Three-dimensional isotropic T2-weighted fast spin-echo (VISTA) ankle MRI versus two-dimensional fast spin-echo T2-weighted sequences for the evaluation of anterior talofibular ligament injury. Clin Radiol. 2016;71:349–55. 23. Taser F, Shafiq Q, Ebraheim NA. Anatomy of lateral ankle ligaments and
their relationship to bony landmarks. Surg Radiol Anat. 2006;28:391–7. 24. Boonthathip M, Chen L, Trudell D, Resnick D. Lateral ankle ligaments: MR
arthrography with anatomic correlation in cadavers. Clin Imaging. 2011;35: 42–8.
25. Hodgson RJ, O'Connor PJ, Grainger AJ. Tendon and ligament imaging. Br J Radiol. 2012;85:1157–72.
26. Kreitner KF, Ferber A, Grebe P, Runkel M, Berger S, Thelen M. Injuries of the lateral collateral ligaments of the ankle: assessment with MR imaging. Eur Radiol. 1999;9:519–24.
27. Fleming BC, Vajapeyam S, Connolly SA, Magarian EM, Murray MM. The use of magnetic resonance imaging to predict ACL graft structural properties. J Biomech. 2011;44:2843–6.
28. Biercevicz AM, Miranda DL, Machan JT, Murray MM, Fleming BC. In situ, noninvasive, T2*-weighted MRI-derived parameters predict ex vivo structural properties of an anterior cruciate ligament reconstruction or bioenhanced primary repair in a porcine model. Am J Sports Med. 2013;41:560–6.
• We accept pre-submission inquiries
• Our selector tool helps you to find the most relevant journal
• We provide round the clock customer support
• Convenient online submission
• Thorough peer review
• Inclusion in PubMed and all major indexing services
• Maximum visibility for your research
Submit your manuscript at www.biomedcentral.com/submit