2018 International Conference on Computational, Modeling, Simulation and Mathematical Statistics (CMSMS 2018) ISBN: 978-1-60595-562-9
A Method of Point Cloud Classification Using Multi-scale Dimensionality
Features and Transductive Learning
Lu AN, Bao-long GUO*, Wang-peng HE and Jie HOU
School of Aerospace Science and Technology, Xidian University, Xi’an 710071, P.R. China; *Corresponding author
Keywords: Lidar, 3D Point Cloud, Suburban Environment, Classification, Support vector machine.
Abstract. 3D point cloud of environments relevant to recognition and monitoring problems in artificial intelligence often require classifying environment data into separated classes. This paper proposes a new classification approach for 3D lidar outdoor environment point clouds. The approach is based on morphological filter, multi-scale dimensionality features and support vector machine model. It can effectively separate the ground, trees and conventional constructions from downsampled point clouds. Compared with single traditional classification algorithm, such as supervoxel clustering algorithm and locally convex connected patches algorithm, the presented approach has good performance in objective and subjective assessments. The effectiveness of the proposed approach is verified based on a public data set collected from the International Society for Photogrammetry and Remote Sensing (ISPRS) and Stanford Modified Object Segmentation Database (MOSD).
Introduction
Recently, airborne Lidar has been rapidly developed in the sensor field. It has become an important remote sensing tool due to its high measurement accuracy, fine time and spatial resolution and large detection range [1]. It can not only be used for precise range measurement, but also accurate angle measurement, accurate tracking, archaeological discovery [2], hydraulic engineering [3], disaster relief [4], habitat analyses [5] and in the civilian and military fields [6–8]. Point cloud is one of the most common data forms of Lidar data. It is a set of data points in a coordinate system. In a three-dimensional coordinate system, points are usually defined by X, Y, and Z coordinates. These three coordinates are usually intended to represent the external surface of an object [9]. Point cloud data classification is a kind of widely used processing mode in environmental perception and it is usually used for the pre-processing step. Points of different objects are marked separately after classification. Furthermore, the type of point can be identified. Classified points can improve the reliability and automaticity of modeling, and enhance overall system performance. In geographic information systems, digital elevation model usually obtained from point clouds [10–11]. Moreover, 3D models of suburban environments can also be generated from point clouds too. In addition, point clouds also play an important role in image processing and artificial intelligence.
However, these classical classification methods usually focused on the simplest feature and classification results still need to be further optimized. The efficiency of random sample consensus based algorithm is related to the size of dataset and the proportion of inliers. Accordingly, it has low efficiency inefficient in some situations [14]. For region based segmentation, if the seed points set in different ways, the segmentation result would probably be different. Accordingly, how to get a consistent classification result is a question to be solved [15]. Clustering-based method is a widely used method. For K-means clustering, it may involve local optimum by the improper selection of initial cluster center [16].
In order to improve the recognition performance, many improved algorithms have been introduced, in particular, apply different methods in combination can effectively avoid the weaknesses of the single algorithms. One type of improved method is to cluster points with similar textures, colors, etc. into small pieces and then analyze the relationship between them. For example, local convexity algorithm is used on the basis of supervoxel cluster algorithm, and it has better performance in segmenting similar and angular objects. Son H et al. built BIMs from laser-scan data by it [17]. Xiao Pan et al. proposed a new framework for creating supervoxel based on the local convexity algorithm [18]. The other type is coarse to fine segmentation. For example, Tee-Ann Teo and Chi-Min Chiu extract pole-like road objects by employed voxel-scale segmentation and point-scale segmentation respectively [19]. Aijazi A K et al. prove the effectiveness of combine mathematical morphology and supervoxel cluster. These methods have achieved good performance in the field of image processing.
The purpose of the present study is to develop an approach for classifying suburban environment 3D point cloud, which combines morphological filter and multi-scale dimensionality features. Our study differs from existing works in two aspects:
1. Ground points are removed from downsampled point cloud with methods of multi-scale filtering, which the data organization and the open operation process can be optimized;
2. Aiming at obtaining the classes of non-ground points, where the multi-scale dimensionality feature and the semi-supervised support vector machine is combined.
The study is organized as follows: Section 2 describes the process of proposed approach based on data downsampling, progressive morphological filtering and multi-scale dimensionality feature by component analysis. Classification process by semi-supervised learning is also given in Section 2. In Section 3, the comparison experiment on table scene of traditional method is performed to validate the effectiveness of the proposed approach. Further validation of its effectiveness on suburban environment point cloud is also given. Finally, conclusions are summarized in Section 4.
Materials and Methods
The proposed approach consists of three aspects: point cloud data acquisition, ground point removing, and multi-scale dimensionality classification.
Point Cloud Data Acquisition
The point clouds acquired by airborne Lidar are dense with noises, which make most point cloud processing techniques applied indirectly. The imprecise features always extracted by these dense points, which always lead to unexpected results and slow calculations. Therefore, the raw point cloud data needs to be downsampled. The downsampling operation can produces noise-reduced cloud, which increased calculation speed.
The filters commonly used for downsampling are the median filter and voxel grid filter. Median filter is now one of the most widely used filter for image processing. It is mainly used for real-time discrete signals and gives the best estimate under the condition of least absolute error. The basic idea of median filter is that it scans points by a window and sorts them in ascending or descending order, the middle value is then taken as the output value. The median filter is demonstrably better in removing noise and preserving edges.
represents all the points within each voxel. Extracting the center of gravity point is slower than the center points, but it allows much more accurately in computing speed. Note that the experiment in this study is based on the down-sampled point cloud.
Ground Point Removing
Suburb is a mixed-use and residential area, existing either as part of a city or urban area or as a separate residential community within commuting distance of a city. The main feature of suburb is that it basically composed of a large number of low-rise housing and a variety of residential infrastructure. In order to classify points more precisely, filtering pretreatment to the point cloud data is needed based on suburban features. In other words, ground points should be removed from the downsampled suburban environment point cloud data.
There are two different main kinds of filtering methods. One is based on the laser radar echo intensity. It converts the echo intensity of radar into gray image. The ground points can be identified by analyzing the gray distribution status of the points. Another is based on the height difference. Usually, different objects have different altitude distribution in the vertical direction. Most buildings and trees are corresponding to high points. In contrast, ground points are relatively lower. Because of the obvious height difference between object edges (it often shows a sudden elevation), the criterion for ground points removing is determined. The premise of using height difference based method is that the height of the non-ground point is obvious higher than the ground point and the slope of the ground changes slightly. The homogeneous data in our study comes from suburban environment and it is basically composed of low-rise housing and a variety of residential infrastructure. Therefore, the height difference based method is adopted
The experiment employed a multi-scale filtering method that the filter window size is gradually increased. In the wave filtering process, with the change of windows size, the threshold of opening operation changed as well. The height threshold is calculated according to formula (1).
0
1 0
max max
, 3
( ) , 3
,
k
k k k k
k dh
dh s c dh
dh dh dh
(1)
2 1
k
w kb (2)
2 k 1
k
w b (3)
The kth filtered window size is denoted ask, the growth mode is the combination of linear
growth and exponential growth according to formula (2) and (3). Parameter b is the initial window
side length and
c
is the spacing of grid model. Parameter dh0 is the minimum elevation threshold,max
dh is the maximum elevation threshold and
s
is the slope parameter of the terrain. After the openMulti-scale Dimensionality Classification
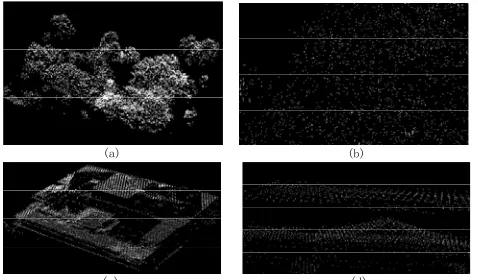
Multi-scale Dimensionality Feature. After removing ground points, non-ground points need to be further classified. Multi-scale dimensionality classification algorithm selects geometric features as the classification criteria in local dimension, for point clouds have different geometric dimensionality features at different scales and positions. For instance, as shown in Figure 1, considering a scene composed of trees and buildings. At a large scale, trees look like nearly 3D spherical cluster (Figure 1(a)), while buildings show a combination of angularity and plane structure (Figure 1 (c)). At a small scale, trees look like scattered points (Figure 1 (b)) while buildings look more 2D (Figure 1 (d)). In general, the more obvious the geometric feature of different kinds of objects, the stronger the classifier performance such as support vector machine will be.
Algorithm Principle of Multi-scale Dimensionality Classification. After analyzed the geometric dimensionality feature of objects under different scales, the binary classifier is built by support vector machine. The optimal combination of scales suitable for classification is found according to the multi-scale dimensionality feature. Non-ground points are further classified by generate the optimal classification hyperplane.
(a) (b)
[image:4.612.188.427.278.418.2](c) (d)
Figure 1. Object point clouds of suburban environment in multiple scales. (a) Vegetation points in large scale; (b) Vegetation points in small scale
(c) Building points in large scale; (d) Building points in small scale.
As mentioned above, the geometric dimensionality feature of the training data in multi-scale point ball is computed. Figure 2 shows the distribution of points in the multi-scale point ball at three different scales. Scene points are marked in yellow, neighbor points inside the ball are marked in green, points outside the ball are marked in gray. The coordinate of point is defined according to formula (4).
( , , ), 1...
i i i i D
D x y z i N (4) The multi-scale point ball is formulated on points with scales as diameter. The principal component analysis is then performed on the multi-scale point ball of each point. It converts a set of linearly related variables to a set of nonlinearly related variables by orthogonal transformation.
Then the eigenvalue k ii, 1, 2,3 sorted in descending order is calculated (k1k2k3 ). The
proportion of the variance di can be calculated by eigenvalue according to formula (5).
1 2 3
, 1, 2,3
i i
k
d i
k k k
(5)
Under the constraint condition d1d2d3 1, the dimensionality feature of point clouds at
Scene point
Neighbor points inside the ball
Points outside the ball
[image:5.612.196.420.65.141.2](a) (b) (c)
Figure 2. Multi-scale point ball. (a) Clouds in 1D; (b) Clouds in 2D; (c) Clouds in 3D.
Besides, the binary classification support vector machine (SVMs, also support vector networks) is adopted as a classifier model to classify point clouds. In machine learning, support vector machines are supervised learning models with associated learning algorithms that analyze data used for classification and regression analysis. Many researchers use SVM to analyze the point cloud images with a satisfying result. Ponz A et al. fuse the information with SVM to achieve obstacle detection and classification. Yong Wang et al. extract vehicles from Lidar data based on one-class support vector machine [.C.M. Gevaert analyzes the informal settlements from point cloud, and the classification is performed by SVM.
The principle of point cloud data classification is that different categories of samples in the test set are separated by a selected hyperplane in the sample space. In a local dimension, variance of classification function is defined according to formula (6).
( ) t
f x w x b (6)
Constraint the normal vector w and define as the geometric spacing of points to the
hyperplane according to formula (7). The larger margin of separation, the higher classification confidence level will be.
( )
yf x w
(7) The constraint is defined according to formula (8).
( t ) , 1,...,
i i D
y w x b y i N (8)
The optimal separating hyperplane is selected by calculating the maximum value of 1
w . By
introducing the Lagrange multiplier
, the constraint can be fused to the objective function.The machine learning model adopted in this work is SVM based tranductive learning model, which it is a promotion of SVM on semi-supervised learning. The principle of tranductive learning is that it used a particular unlabeled test set, which can improve classifier performance significantly. A hyperplane is selected to separate all points with it through the minimum density region of all data. It assumes that the unlabeled point set is the test data. The purpose of learning is to obtain the best generalization of these data. Experiment and Verification
Steps of the Proposed Algorithm
of the classification. (4) Build a binary classifier by SVM model to find an optimal scale to ensure the hyperplane classify plants and buildings in a best level. (5) Apply the created binary classifier to the non-ground points obtained by step 1.
(c) (b)
[image:6.612.193.422.111.188.2](a)
Figure 3. Intermediate result of classification approach.
(a) Downsampled scene point cloud; (b) Ground points after multi-scale filtering (c) Non-ground points after multi-scale filtering.
Comparison Experiments on Traditional Method
Supervoxel clustering algorithm is one of the most common used traditional segmentation algorithm. It is an over-segmenting leading algorithm by cutting the point clouds into small pieces. The specific object is then identified after analyze the relationship between each piece of point. The idea of LCCP algorithm is deal with pieces of point cloud obtained by SVC. The concavity and convexity relation between different pieces of cloud is calculated by only use spatial information and the normal characteristics. Then further cluster is proceeded.
(d)
A B
(a) (c)
C
(b) (d)
(e)
[image:6.612.194.418.340.436.2](f)
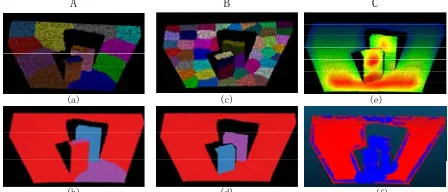
Figure 4. Result of applying traditional classification algorithm and multi-scale dimensionality classification algorithm. (a) Set seed resolution to 0.4 using SVC; (b) result of corresponding parameter values using LCCP
(c) Set seed resolution to 0.2 using SVC; (d) result of corresponding parameter values using LCCP (e) density distribution; (f) multi-scale feature based segmentation.
Figure 4 shows the segmentation results of three sets of experiments. In the experiments of A and B, SVC and LCCP algorithms are applied respectively. Seed resolution in group A is set to 0.4, and in group B is 0.2. As can be seen from Figure 4(a) (c), the smaller the seed resolution set, the more the clusters generated by using SVC algorithm. Differences in fineness also exist in the corresponding result by using LCCP algorithm. In the third set of experiments, colors from red to blue in Figure 4 (e) indicate the gradually decreasing density of points. Red correspond to the most densely point while blue represent the most sparsely part. Figure 4 (f) shows the results of multi-scale feature based segmentation. It can be seen from the Figure 4 (f) that the desk object points are divided into two categories (tabletop and books) where two books are handled as a whole.
Table 1. Performance comparison of two traditional segmentation algorithms.
Seed Resolution 0.2f 0.3f 0.5f
Property CN OS CN OS CN OS
SVC 48 Yes 24 Yes 12 Yes
LCCP 3 No 3 No 3 Yes
Proposedapproach 2 Yes 2 Yes 2 Yes
either by using SVC or LCCP is prone to be over-segmented, the proposed approach still need to be further improved when it is applied to the scene whose density distribution is reduced by the position.
(b)
(a) (c)
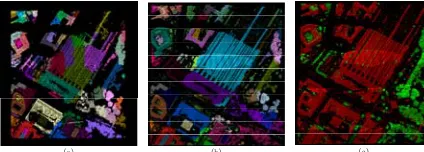
Figure 5. Applying three algorithms to non-ground point clouds
[image:7.612.198.410.98.174.2](a) Non-ground points segmented by SVC; (b) Non-ground points segmented by LCCP (c) Segmentation by proposed approach.
Figure 5 shows the results of segment non-ground point cloud by using SVC algorithm, LCCP algorithm and the approach proposed in the study respectively. The experiment set seed resolution to 85f according to the density of scene cloud (0.67 points per square meter). 86 clouds are then clustered by using SVC algorithm, and 53 clusters were obtained according to LCCP algorithm. It is clear from Fig. 7(b) that some small clouds are merged together by LCCP, which relatively tally with the original scene image represents (For example, a roof is divided into three blocks by SVC while they are combined in a whole group by LCCP). However, from the general understanding of the image, these traditional algorithms roughly separate different buildings and still not merge globally while the algorithm in Fig. 7(c) can effectively solve this problem. The binary classifier built by SVM model is shown in
From the segmentation result above, it is clear that the approach proposed in this paper is superior compared with the typical traditional clustering algorithms (SVC and LCCP), especially the density has a significant difference in different categories. It can split points into accurate categories with highly recognizable form.
Conclusions
This paper proposes a novel approach for 3D Lidar suburb environment point clouds classification based on morphological filter and multi-scale dimensionality features. The major difference between traditional classification algorithms and our approach is that our approach converted a multi-class classification problem to a combination of single-class classification method. In order to classify suburb environment points precisely, we employed an effective morphological filter to separate ground points and non-ground points firstly. Then the SVM model is used to construct a non-ground object classifier. The success of this approach in the current experiments demonstrates that the proposed approach is an ideal way to analyze the spatial distribution of points and 3D Lidar suburban environment point clouds classification.
Acknowledgment
This work was financially supported by the National Natural Science Foundation of China under Grant No.61571346.
References
[1] Yan W.Y.; Shaker A.; El-Ashmawy N. Urban land cover classification using airborne LiDAR data: A review. Remote Sensing of Environment. vol. 158, 2015, pp. 295-310.
[3] Fernández-Lozano J.; Gutiérrez-Alonso G.; Fernández-Morán M.Á. Using airborne LiDAR sensing technology and aerial orthoimages to unravel roman water supply systems and gold works in NW Spain (Eria valley, León). Journal of Archaeological Science. vol. 53, 2015, pp. 356-373. [4] Wang X.; Li P. Extraction of earthquake-induced collapsed buildings using very high-resolution imagery and airborne LiDAR data. International Journal of Remote Sensing. vol. 36, no. 8, 2015, pp. 2163-2183.
[5] Johnston A.N.; Moskal L.M. High.Resolution habitat modeling with airborne LiDAR for red tree voles. The Journal of Wildlife Management. vol. 81, no. 1, 2017, pp. 58-72.
[6] Lu N.M.; Min M.; Dong L.X. et al. Development and prospect of spaceborne LiDAR for atmospheric detection. Journal of Remote Sensing. vol. 20, no. 1, 2016, pp. 1-10.
[7] Kumar; G. Ajay et al. A LIDAR and IMU Integrated indoor navigation system for UAVs and Its application in real-time pipeline classification. Sensors. vol. 17, no. 6, 2017, p. 1268,
[8] Wang D.L. et al. Modeling aboveground biomass in hulunber grassland ecosystem by using unmanned aerial vehicle discrete lidar. Sensors, vol. 17, no. 1, 2017, p. 180.
[9] https://en.wikipedia.org/wiki/Point_cloud
[10] Zhou X.; Wang G.; Bao Y. et al. Delineating beach and dune morphology from massive terrestrial laser-scanning data using generic mapping tools. Journal of Surveying Engineering, vol. 143, no. 4, 04017008, 2017.
[11] Chen, Z.Y.; Gao B.B.; Bernard Devereux. State-of-the-art: DTM generation using airborne LiDAR data. Sensors, vol. 17, no. 1, 2017, p. 150.
[12] Fischler M.A.; Bolles R.C. Random sample consensus: a paradigm for model fitting with applications to image analysis and automated cartography. Communications of the ACM, vol. 24, no.6, 1981, pp. 381-395.
[13] Kurniawan R.; Othman M.F.; Schramm D. et al. Combined use of modified hough transformation, random sample consensus and linear least square to extract the normal parameterization of a straight line: an application for cable driven parallel robots. Procedia Technology, vol. 26, 2016, pp. 382-388.
[14] Liu C.B.; Shen Q., Pan H.; Li M. Modelling and simulation: an improved RANSAC algorithm based on the relative angle information of samples. International Journal of Modelling, Identification and Control, 2017, vol. 28, no. 2.
[14] Biosca J.; Lerma J. Unsupervised robust planar segmentation of terrestrial laser scanner point clouds based on fuzzy clustering methods. ISPRS Journal of Photogrammetry and Remote Sensing, vol. 63, no.1, 2008, pp. 84-98.
[15] Serapião A.B.S.; Corrêa G.S.; Gonçalves F.B. et al. Combining k-means and k-harmonic with fish school search algorithm for data clustering task on graphics processing units. Applied Soft Computing, vol. 41, 2016, pp. 290-304.
[16] Son H.; Kim C.. Semantic as-built 3D modeling of structural elements of buildings based on local concavity and convexity. Advanced Engineering Informatics, vol. 34, 2017, pp. 114-124. [17] Pan X. et al. Superpixels of RGB-D images for indoor scenes based on weighted geodesic driven metric. IEEE Transactions on Visualization and Computer Graphics, vol. 23, no.10, 2017, pp. 2342-2356.