EVALUATING THE QUALITY OF SERVICE OF 3G CELLULAR
MOBILE NETWORKS IN A DEVELOPING ECONOMY
Lawrence Oborkhale,
Department of Electrical/Electronics Engineering,
Michael Okpara University of Agriculture, Umudike
Nigeria.
ABSTRACT
The last decade has witnessed extreme competition among cellular wireless services providers in developing countries like Nigeria. However, as the competition increases, it has become
essential for companies to position themselves appropriately in order to take advantage of their
core competencies and to prepare for the emerging telecommunications environment. Presently
one of the major services provided by the network providers is an internet data service with the
use of modem with each provider claiming to provide a better Quality of Service than the other –
unfortunately there has not been a comparative study to substantiate their claims. Using a
technique called passive probing, in this paper we will provide a comparative evaluation of the
quality of service of various network providers in Nigeria based on location and time. This will
provide network planning and upgrading information for the providers and network ranking for
subscribers.
Keyword: Quality of Service, 3G mobile networks, passive probing
I. INTRODUCTION
In the past decade, network performance quality has posed great challenges for Network
Operators. This is partly because of the growth in varied network traffic demands. The Internet is
a best-effort technology, and therefore, not optimized for the transport of delay sensitive
video streaming have placed increased demands on networks, straining their ability to provide
customers with good quality of services. An attempt to address this problem has resulted in
numerous mechanisms for providing quality of service networks.
Quality of Service (QoS) refers to the collection of network technologies and techniques to
guarantee a certain level of performance to the flow of data on a wireless network. QoS has
increasingly become of more importance to both telecom operators and researchers. Since
communication networks have become a very essential part of our life, much effort has been
geared towards improving QoS in order to achieve more customer satisfaction, which, in turn,
leads to strong loyalty [1, 2]. Furthermore, QoS has, by itself, become a profit manipulation tool
for service providers to achieve global efficiency in resource utilization [2].
In developing countries, the initially installed GSM networks are being upgraded to technologies
that allow fast data throughput in order to handle higher data capacities and improve QoS.
Presently one of the major services provided by network providers is internet data services with
the use of a modem. Interestingly, the various providers are providing modems for their networks
with each claiming to provide better Quality of Service (QoS) than the other. Unfortunately there
has not been a comparative study to substantiate their claims – indeed there has been reports of
low QoS by network providers in Nigeria [3].
In this paper we will provide a comparative evaluation of the QoS of four 3G mobile system
networks in Nigeria (Glo, MTN, Airtel and Etisalat) based on location and time – this will be
achieved using a technique called passive probing. This will provide network planning and
upgrading information for the providers and network ranking for subscribers.
The structure of this paper is as follows. In section 2 we will describe the background to the
factors and components that affect the performance of a network and the QoS it can provide. In
section 3 we will describe how we went about measuring QoS in a developing economy. Section
in Nigeria based on location and time. A discussion is given in section 5 and final conclusions
are given in section 6.
[image:3.612.72.307.207.307.2]II. BACKGROUND
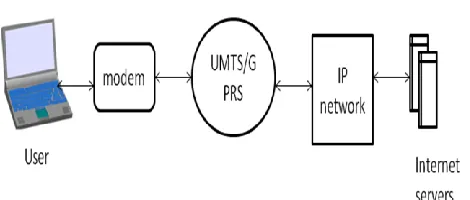
Figure 1: Reference Architecture of the system
To obtain end to end service delivery on a wireless network the mobile service provider provides
a modem which acts as an interface between the user system and their network. Figure 1 shows
the basic architecture of such a system which consist of the various segments of the end-to-end
network connection that take part in providing end-to-end services; these segments include the
access network, the UMTS (Universal Mobile Telecommunications System) or GPRS (General
Packet Radio System) core network, the IP backbone, and the intranet connecting application
servers.
The end-to-end service requires interworking between the UMTS and external IP networks in
terms of mapping among their traffic classifications which have different data flow requirements.
The user is able to use the internet by using a modem and the cellular service provider network.
The QoS perceived by the end-user depends on the performance achieved by the various
interoperating networks and services – here the end-to-end QoS will depend on overall
performance achieved by all the network and service components.
There are a number of factors and components that affect the performance of a network and the
major perspectives: the network provider’s perspective and the user’s perceptive.
From a network provider’s perspective, QoS is defined by “parameters that contribute towards
the end-to-end performance of the service, reflecting the customer’s requirements” [1]. Here the
primary goal of QoS is to provide different priorities to different applications to distinct network
traffic into different types, corresponding to their different features and different demands to the
networks, and to be delivered to the customers. QoS also makes sure that providing priority for
one or more data flows does not make other flows fail [4].
Network QoS is evaluated by measuring the following five key parameters: availability,
bandwidth, end-to-end delay, jitter, and packet loss. Availability specifies the percentage of time
the network service is available. Bandwidth is measured as the average number of bits per
second that can travel successfully through the network. End-to-end delay is the average time it
takes for a network packet to traverse the network from one end point to the other. Jitter is the
variation in the end-to-end delay of sequential packets. Packet loss is measured as the percent of
transmitted packets that never reach the intended destination [5].
QoS, as perceived by network users, is the collective effect of service performances, which
determine the degree of satisfaction of a user of the service [1]. In other words, QoS is a set of
requirements to be met so that a service or application can be delivered to the end-user. The QoS
level can be quantified by packet loss probability, guaranteed bandwidth, end-to-end delay and
jitter, which reflects how the traffic flows through a network.
From a user perspective, QoS can also be defined as the degree of satisfaction of an end-user for
a delivered service, for agreed Service Level Agreements (SLAs). A SLA is a contract to specify
the transit of services through network domains [6]. A typical user is not concerned with how a
particular service is implemented but is more interested in comparing the same service offered by
different providers in terms of universal, user-oriented performance parameters. This implies that
Take into account all aspects of the service from the user's point of view. Focus on user-perceivable effects, rather than their causes within the network. Are independent of the specific network architecture or technology.
Can be objectively or subjectively measured at the service access point. Can be easily related to network performance parameters.
Can be assured to a user by the service providers.
New services for mobile phones like email, web browsing, audio and video streaming demand
more and more network resources from the underlying network. If the network does not deliver
what these services need then performance and the user experience will be unsatisfactory.
Currently, mobile phones are often used as dial-up modems to connect portable personal
computers to the internet because of good coverage, quick access and no need for cables of any
kind. There are increasing needs for high bit rates, low delay and jitter which are three
parameters that strongly affect the user performance [7].
User QoS can evaluated by using the following QoS indicators in a network: speed,
responsiveness and reliability [8]. Speed refers to the session and transmission throughput.
Responsiveness is a measure of network traffic response delays offen measure by traffic round
trip time (RTT). Reliability is defined as the statistical frequency of sessions that completed
successfully i.e the rate of packet loss.
In this paper we are interested in measuring the QoS from a user’s perspective so we can
compare the various QoS provided by the network providers.
III. MEASURING USER QOS
We wish to test the end-to-end performance of various providers to evaluate their QoS – this can
be done using telecommunication network measurements. We will measure the user QoS
measuring throughput, responsiveness by measuring RTT and reliability by measuring packet
loss rate.
Telecommunication network measurements can be broadly classified into passive and active
methods. These can be further divided into tracing, monitoring and probing, methods. Tracing is
usually active (the traffic is specially generated for the measurements) and the purpose is often to
trace the performance of a certain route hop by hop. Monitoring usually refers to passive
methods where information about the existing network traffic passing through some nodes
(routers, servers, etc.) is collected. Probing can be either active or passive. Active probing
measures the effects of specially generated data flows for testing, whereas passive probing
collects information about the effects of existing network traffic [9, 10]. We will use active
probing to measure QoS by using the ping and trace route software facilities.
The concept of end-to-end testing is to perform tests and measurements that can tell us about the
performance as experienced from an end user view. The testing is done by performing tasks that
are possible to do without any “inside” information or equipment installed in the network. An
end-to-end test is typically performed with a computer connected to mobile network via a
[image:6.612.194.404.487.576.2]network modem.
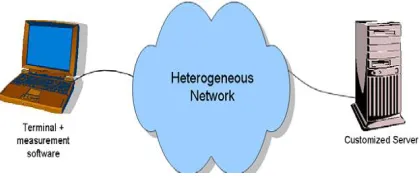
Figure 2: The measurement configuration
To measure the QoS of various networks the end-to-end performance measurements were taken
from single-point measurements taken directly from the terminal which uses some service. The
hierarchy and the measurement gives directly an idea about the various key performance
indicator parameters. The configuration for measuring QoS is shown in figure 2 – this maps to
figure 1 and the heterogeneous networks we will study are different operators in Nigeria. Here
we are affectively measuring the user QoS at the link between the terminal and the network.
However, the quality of any network is as good as the weakest link.
The actual measurements are done at the measurement point that is of interest (terminals). We
used active probing traffic software measurement tools (ping, and route trace 2010) to perform
the measurements i.e., capturing the packets and collecting information about them. The
measurements were carried out in two different locations within Nigeria (Yola in Adamawa State
and Epe in Lagos State – we used terminals in these locations to measure to the various service
provider networks. The measurements were taken from the network of four different operators
(Glo, MTN, Airtel and Etisalat). For each of the locations, measurements were taken at hourly
intervals and the obtained data were aggregated and averaged into the following four types for a
period of one week in April 2011 (average): Morning for data obtained between 7am-12pm;
Afternoon for data obtained between 1pm-6pm; Evening for data obtained between 7pm-12am;
and Night for data obtained between 1am-6am.
The technology of the all the installed networks used a 3G technology called EDGE which can
support data rates of up to 384Kbps and the same technologies for measurement where used in
IV. RESULTS
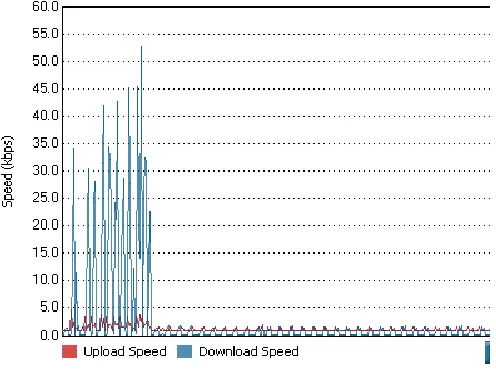
[image:8.612.190.429.298.446.2]Figure 3: Throughput graph obtained from Etisalat network
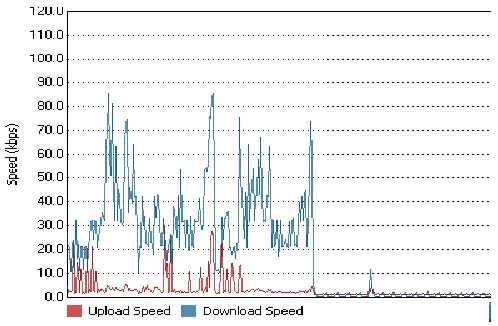
Figure 4: Throughput graph obtained from Glo network
[image:8.612.182.430.484.671.2]Figure 6: Throughput graph obtained from MTN network
We will now present the results of measuring the QoS indicators in a network from a user’s
perspective i.e speed by measuring throughput, responsiveness by measuring RTT and reliablity
by measuring packet loss.
The speed refers to the session and transmission throughput of data for uploading and
downloading. Figure 3 to 6 show the upload and download speeds (throughput) of the various
networks. Note the x-axis is times of the day from 7am to 6am the next day. The tool to capture
the upload and download throughput measurements was the trace route software package.
From figure 3 we can see that when using Etisalat there were numerous periods of high
throughput for uploading and downloading data throughout the day – the highest being during
the morning and mid-day and lowest being during the evening. It can also be seen that the
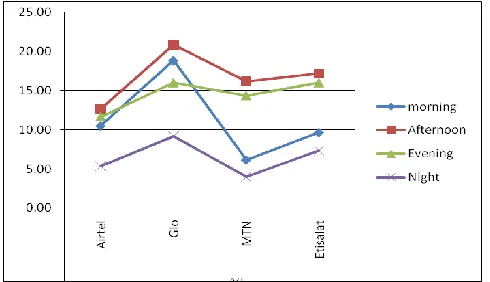
Figure 7: Comparison of the various networks average RTT at different period of the day.
Figure 8: Comparison of the various networks percentage packet loss at different period of the
day.
From figure 4 we can see that when using Glo there were numerous periods of high throughput
for uploading and downloading data throughout the day – however, the throughput is generally
lower than that of Etisalat. Throughput is highest during the morning and mid-day and lowest in
the evening. It can also be seen that uploading throughput is comparable with downloading
throughput.
[image:10.612.185.430.312.453.2]uploading and downloading data from morning to mid day with download throughput
significantly higher than upload throughput. It can also be seen that for the rest of the day the
throughputs are consistently low
From figure 6 we can see that when using MTN there are numerous periods of high uploading
and downloading throughput from morning to evening day with download throughput
significantly higher than upload throughput. It can also be seen that for the rest of the day the
throughputs are consistently low
From our studies it can be seen that all the nework services are highly inconsistent but the MTN
network was best for speed throughput.
The responsiveness of the network is obtained by measuring and analyzing the stimulus response
delay information as data flows through the network – this was measured using the ping software
tool. The ping messages were used for collecting statistics on Round Trip Time delay (RTT).
From the results we compared the RTT for each individual network for the various periods of the
day
Figure 7 shows the results of the ping test on the various networks at different times of the day –
note that RTT is the y-axis and is measured in milli-seconds. The graphs show the average RTT
at various periods of the day for each network. From the graph we can make the following
observations. In the morning Airtel was the best and Glo performed the least. In the afternoon
Airtel was the best and Etisalat performed the least; in the evening Etisalat was the best and
MTN performed the least. At night Etisalat was the best and Glo performed the least. From our
studies, we can therefore conclude that Etisalat’s network is the most responsive.
Reliability is defined as the statistical frequency of sessions that completed successfully.
Reliability was also measured with ping. Figure 8 shows the results of average percentage packet
following observations. In the morning MTN was the best and Glo performed the least. In the
afternoon Airtel was the best and Glo performed the least. In the evening Airtel was the best and
Etisalat performed the least. At night MTN was the best and the Glo performed the least. From
our studies, we can therefore conclude that MTN is generally the best provider when it comes to
packet loss.
V. DISCUSSION
We have presented the results of a comparative evaluation of the QoS of four 3G mobile system
networks in Nigeria (Glo, MTN, Airtel and Etisalat) based on location and time. These results
will provide network planning and upgrading information for the providers and network ranking
for subscribers.
From our studies we conclude that the general level of performance of the networks was low
with abnormally high link inconsistency. The throughput of the various networks were generally
low whereas the theoretical data speed in an EDGE network is up to 384kbps but the maximum
data rate that was obtained in any of the 4 studied networks were 236.8kbps.
The packet loss rate for the networks were high – indeed, any failure rate above 1% in a network
represents a serious problem in the network and is expected to be addressed by that the network
provider [3].
Wireless data networks present a more constrained communication environment compared to
wired networks. Because of fundamental limitations of power, availability, spectrum and
mobility, wireless data networks tend to have the following features:
• less bandwidth than traditional networks; • more latency than traditional networks;
However, various provisions are usually made to annul the various affects of the measured
features of the network – these include the following:
- effective network capacity design
- inclusion of redundancy in network design and implementation
- efficient service support and application design for the network
We believe that if the network providers can implement the provisions then our results for user
QoS would greatly improve.
VI. CONCLUSIONS
Over the last decade there has been a large increase in competition among cellular wireless
services providers in developing countries like Nigeria. Presently one of the major services
provided by the network providers is an internet data service with the use of modem with each
provider claiming to provide a better Quality of Service than the other – unfortunately there has
not been a comparative study to substantiate their claims.
We agree with [11] who said that research should be done by telecom companies to keep abreast
of current thinking and trends in the industry.
In this paper we have performed and provided a comparative evaluation of the quality of service
of four 3G mobile system networks in Nigeria (Glo, MTN, Airtel and Etisalat) in Nigeria based
on location and time. Using passive probing techniques we have provided a comparative analysis
of the following user QoS indicators on each network: throughput, RTT and packet loss. Our
experimental results will provide network planning and upgrading information for the network
REFERENCES
[1] 3rd Generation Partnership Project, “Technical Specification Group Services and System
Aspects: End-to-End Quality of Service (QoS) concept and architecture”, 3GPP TS 23.207
V6.0.0 (2003-09) (Release 6).
[2] Understanding General Packet Radio Service, App. Note 1377, Agilent Technology,
available at www.agilent.com.
[3] A. Odinma, The decadent state of GSM network services in Nigeria, Business Day, 1 March
2005.
[4] Wireless Service Measurements Handbook, GB 923, Version V2.6, TM Forum, Morristown,
New Jersey, December 2003.
[5] R. Chakravorty, M. D'Arienzo, J. Crowcroft, I. Pratt, "Dynamic SLA-based QoS Control for
Third Generation Wireless Networks: The CADENUS Extension", Proceedings of IEEE
International Conference on Communications (IEEE ICC 2003), Anchorage, Alaska, US,
11-15 May 2003
[6] N. Amani, E. Alipour, Analysis of Performance and Quality Paramaters for Service Level
Agreement in Long Distance Call Service, Proceedings of the International Multi Conference
of Engineers and Computer Scientists, Volume 2, ISBN: 978-988-17012-1-3, Hong Kong,
19-21 March 2008
[7] White Paper Measurement and Analysis of End-to-end Service Quality of 3G Networks and
Services, Project Deliverable February 2004.[online]
http://www.ist-albatross.org/QoSWhitePaper.pdf (Accessed 1 April 2011)
[8] C. M. Sarraf, L. El-Khazan, T. Zoghby, J. Maksoud, S. El-Asmar, J. Nassif, Measuring QoS
for GPRS mobile networks, Proceedings the 4th WSEAS international Conference on
Telecommunications and Informatics, ISBN: 960-8457-11-4, Stevens Point, Wisconsin,
USA, 2005
[9] A. P. Ooden, K. E. Ward, A. W. Mullee, “Quality of Service in Telecommunications”, IEE
Telecommunication Series 39, Published by IEE UK, ISBN: 0 85296 919 8. 1997.
[10] White Paper Measurement and Analysis of End-to-end Service Quality of 3G Networks and
http://www.ist-albatross.org/QoSWhitePaper.pdf (Accessed 1 April 2011)
[11] A. Odinma, Whence and Whither Mobile Com muniations and Impacting Technologies,
Annula Review of Communications, Volume 59 (Annual Review Series), pages 573-579,