AMORPHOUS SEMICONDUCTOR AND THEIR ELECTRONIC AS
WELL AS CONFIGURATIONAL PROPERTIES
R.Khatri
Department of Physics, DAV College,Abohar, India.
ABSTRACT
The configurational properties of a-Si, a-Ge and a-Sil-,C, have been studied by Monte Carlo
simulation methods. A special attention is given to the selection of the interatomic potential. The
calculated networks for the a-Si and a-Ge systems are found to be nearly the same with only a
small scaling factor of difference for the bond distances and nearly the same bond angles. In the
case of a-Sil-,C, we find that a11 C sites a.re 4-fold coordinated, whereas the coordination of Si
varies between 3 and 6. The increase of x in a-Sil-,C, increases the amount of 5-fold Si sites and
decreases the amount of 4-fold Si sites indicanting an increase of the disorder. With the
geometrical structures generated by the Monte Carlo simulation a quantum mechanical
investigation is made of the electronic structure of a-Si. Using the INDO method for a cluster
"supermolecule" composed of 35 Si atoms saturated with hydrogen atoms the density of states of
a-Si is simulated. Configuration interaction calculation is also performed to disciiss the optical
absorption spectrum of a-Si.
Introduction
Amorphous semiconductors represent an important area in condensed matter physics. This
subject has been extensively studied both theoretically and experimentally not only because of its
technological importance but also because of its interesting physical properties[l].
A necessary requisite to any microscopic study of disordered semiconductors is the knowledge
of their atomic structure. Experimentally, disorder means that one can measure only average
properties and an accurate determination of the individual atomic coordinates is impossible. Yet
a quantitative characterization of the atomistic disorder, i.e, an accurate microscopic model of the
disordered network, is a prerequisite for any quantitative theoretical approach to the properties of
description of the interatomic potential energy surface, using statistical simulation methods based
on Molecular-Dynamics (MD)[2] or Monte Carlo (MC) techniques[3].
Here, we present results of simulations of the following systems: amorphous Si (a-Si),
amorphous Ge (a-Ge) and amorphous SiC (a-Sil-,C,with x up to 0.1). We use a MC algorithm
and the interatomic potential developed by Tersoff[4].
Once an amorphous structure has been obtained by simulation it is possible to study the
electronic structure using conventional non-relativistic quantum mechanical methods. In
particular, our interest in the optical spectra of amorphous materials demands a careful analysis
of the electronic excited states. Besides the transition energies it is important to obtain the
relative intensities of the corresponding electronic absorption. For that matter we use the
self-consistent-field approach within the intermediate neglect of differentia1overlap approximation
followed by configuration interaction, the so-called SCF-INDO-C1 method[5], and adopt a
"supermolecule" approach. Further details are given in the next section.
Method
To study the configurational structure we have used the continuous- space MC method. A
reliable description of the atomic interaction is provided by using an empiric interatomic
potential. Details on the functional P.P.M. Venezuela, S. Canuto and A. Fazzio form and
parameter values of the potential are postponed to subsection 11.2.
The MC simulations are made with cubic boxes of 216 atoms. The problem of surface effects
can be overcome by implementing periodic boundary conditions using the minimum image
convention[6].
In order to generate the atomic arrangement in a-Si, the ideal configuration of the diamond
structure was melted using a constant temperature and pressure (NPT) MC procedure. This
simulation was performed at 3000 K since the experimental melting point for Si is 1683 K but
After the system was thermalized at 3000 K, which required about 10000 MC steps, the
temperature was decreased to 2500 K and the system was thermalized again. This process is
repeated down to 300 K and only then the a-Si coordinates are generated. In the cases of a-Ge
and a-Sil-,C, we used similar procedures. Having the structure generated by the MC simulation
it is possible to perform an analysis of the electronic structure.
Electronic structure calculations
To make the electronic structure calculations we adopt the INDO method. A Hartree-Fock (HF)
self consistent field calculation is first performed on the ground state. The HF orbital energies are
used to calculate the density-of-states (DOS). In this one-particle picture the discrete set of
energy levels are used to simulate the DOS of the bulk by convoluting Gaussiantype functions
around each discrete energy leve1 with a given widthi"]. In a11 calculations performed here we
used a Gaussian width of 0.5 eV. It is not possible to include a11 the 216 atoms in these analysis
because of computational limitation. Then, we consider a representative portion including 35
atoms as a "supermolecule" . These atoms are selected by choosing randomly an atom in the
216-atom cell and looking for its 34 nearest neighbors. Now we have again to deal with feigned
surface effects. Then we saturated the dangling bonds of the supermolecule with hydrogen
atoms[9]This procedure must not be confused with real hydrogenation, which is common in
amorphous semiconductors.
The HF states are used next to generate the excited states by configuration interaction (CI).
Using single electron promotion with reference to the HF wavefunction around 400 excited
states are generated and allowed to interact by diagonalizing the Hamiltonian matrix in this basis.
This immediately gives the corresponding excitation energies. In addition, as all C1 states come
from diagonalization of the same C1 matrix the corresponding eigenstates of the C1 hamiltonian
form an orthonormal set and this allows the determination of the transition moments. Thus the
corresponding intensities are calculated from the oscillator strength. In a11 cases here the
oscillator strength has been obtained using the length form. The optical spectrum is finally
obtained by convoluting Lorentzians around the transition energies using the oscillator strength
for the intensity[lO].T his procedure is very convenient for large systems where a state-to-state
Results and discussion
A) a-Si and a-Ge: atomic arrangement
The configurational structure of a-Si as obtained with the MC method in which the atoms
interact via I the TP has already been published[11]. Here we first briefly revisite this problem as
an initial test for the MC computational code that we developed. Our results are indeed in
agreement with the Tersoff results[11].this subsection we shall also present our results for the
[image:4.612.201.405.244.412.2]configurational structure of a-Ge.
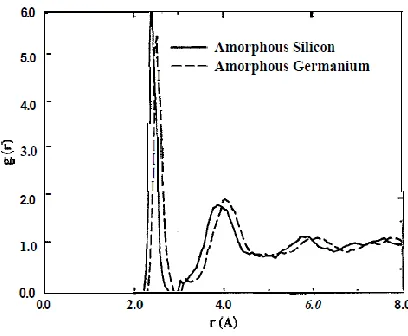
Figure 1: Radial distribution functions for a-Si (solid lines)and a-Ge (dashed lines).
In the Fig. 1 we show the radial distribution functions (RDF) for these systems. A very
pronounced peak at 2.41 Å for a-Si and 2.52 Å for a-Ge indicates that the systems have a short
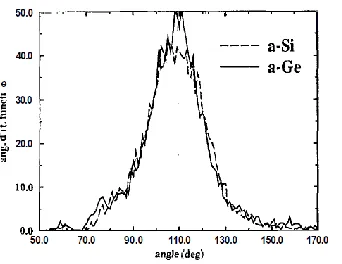
range order as expected for covalent disordered systems. In the Fig. 2 we show the angular
distribution functions for a-Si and a-Ge. The distributions are centered around the angle of 109.5
Figure 2: Angular distribution functions for a-Si (solid lines) and a-Ge (dashed lines)
In the Table 1 we compare our results with that obtained within the Car-Parrinello scheme
(CP)[12] and experimentally[13,14,15]. In the case of a-Ge there is not, to our knowledge, ab initio
MD results in the literature. We compare the mean first neighbor distance, R1, the standard
deviation of bond lengths, R1 the average coordination, Nc, the meaning bond angle, , and the
standard deviation of bond angles, .
Table I: Mean first neighbor distance, R1, standard deviation of bond lengths, u , average
coordination, Nc, mean bond angle, , and standard deviation of bond angles, for amorphous
Si and amorphous Ge. Our results are compared with both CP[12] and experimental results
[13,14,15]
.
R1 R1 Nc
(Å ) (10-2 Å) (deg) (deg)
______________________________________________________________________________
a-Si Our 2.41 8.1 4.10 108.6 12.1
CP 2.38 9.0 3.96 108.1 13.4
Exp. 2.36 7.4 4.05 108.4 9.9
______________________________________________________________________________
a-Ge Our 2.52 4.9 4.15 108.3 15.8
Exp. 2.463 7.4 3.68
The results presented in Table I and Figs. 1 and 2 show that the geometrical pattern of a-Ge and
[image:5.612.72.544.492.621.2]aSi1 -, C,: Atomic arrangement
The atomic arrangements of stoichiometric SiC, i.e., a-Si1 -,C, with x = 0.5 have been studied
both experimentally[17] and theoretically [18]. However the understanding of the atomic of C
atoms is included is still missing. In this subsection we present our result obtained with the MC
simulations for a-Si1-C, with varying x up to 0.1.
In Fig. 3 we show the RDF for the systems that we have studied compared with the RDF of a-Si.
Analysis of the RDF of Fig.3 in terms of partial correlation functions, shows that the first and
second peaks at 1.62Å and 1.95 Å are due to C-C correlation. We note that when the
concentration of C is 2% or 5% the peak at 1.62Å is missing. Te third peak at 2.4 Å is due to
Si-Si correlation and the fourth peak at 3.05 Å is due to Si-Si-C correlation.
Fig.3. ratial distribution functions for a-Si (solid lines). a-Sio.98 Co.02 (dotted lines), a-Sio.95 Co.05 (dashed lines) and
a-Sio.9 C0.1 (long dashed lines)
In all simulations made here we obtain that the C atoms are always tetracoordinated. However
our results for the coordination of the Si atoms range between 3 and 6. In the Table I1 we
compare the amounts of tri, tetra, penta and hexacoordinated Si sites for each
We note that increase of C concentration in a-Si1 -xCx increases the amount of 5-fold sites and
decreases the amount of 4-fold sites. This is indicative of an increase in the disorder of the
[image:7.612.71.542.177.251.2]system.
Table II: Percentage of Si sites in a-Si1-,C, calculated with coordination three, four, five and six.
x 3-fold 4-fold 5-fold 6-fold
0.00 0.0 90 9.3 0.7
0.02 0.0 78 21.5 0.5
0.05 0.5 75 24 0.5
0.10 2.5 70 27 0.5
a-Si: electronic structure
In this subsection we present the results for the electronic structure calculations of a-Si. In the
Fig. 4 we compare our calculated DOS for a-Si and crystalline Si (c-Si). We see that the peaks in
the DOS are broadened when changing from the crystalline to the amorphous system. In the case
of a-Si we see a small peak in the DOS near the energy of O eV. This peak is related to a very
localized state and this state is due to an over coordinated (5-fold) site. The large gaps in the Fig.
4 are due to the frozen orbital approximation using the HF scheme. The inclusion of relaxation is
made in the C1 method and improves the results. In the Table III we show the difference in
energy between the lowest unoccupied molecular orbital (LUMO) and the highest occupied
molecular orbital (HOMO) obtained at the HF calculation. We also show the calculated optical
gap, obtained here from the calculated first excitation energy in the C1 model, for the case of
a-Si and c-a-Si. As the HOMO-LUMO energy difference corresponds to a frozen orbital picture it
gives values for the energy gap that are too large in a cluster model. Only for the infinite system
the relaxation energy can be neglected. A simple way to include the relaxation of the unoccupied
orbitals is to perform a C1 calculation with single excitation. As Table III shows the relaxation is
large for c-Si and very large for a-Si. The final theoretical estimate of the corresponding optical
energy gap is improved by the inclusion of the relaxation energy although it is still somewhat too
large. We note that, experimentally, in the case of a-Si there is the formation of a pseudogap at
the Fermi Energy. The value of the energy gap value of c-Si is 1.2 eV. For a11 the difficulties
involved in the calculation of total energy the essential aim in obtaining energy gap is to analyze
Figure 4: Calculated density-of-states of amorphous (solid line) and crystalline Si (dotted line).
Table III: Calculated HOMO-LUMO energy difference and optical gap (in eV) for amorphous and crystalline Si.
HOMO-LUMO Optical Gap
c-Si 5.80 3.45
a-Si 5.06 1.54
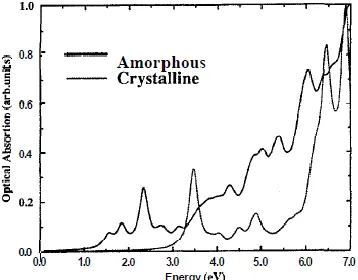
The Fig. 5 shows the calculated optical absorption spectrum for a-Si and c-Si using the
SCF-INDO-C1 procedure described in the section 11. In the low-energy side one notes an almost rigid
shift of 1.0 eV for the intense transitions. However for the case of the amorphous system the
[image:8.612.213.392.468.608.2]natural disorder gives absorption intensity to formally dipole forbidden transitions.
Conclusions
We have simulated the configurational structures of a-Si and a-Ge. We find that the difference
between these two calculated structures is only a small scaling factor for the bond lenghts but
with essentially the same network pattern as given by the angular distribution
functions.
We have also studied the case of a-Sil-,C,, x = 0.02, 0.05 or 0.10. We find that the C atoms are
always tetracoordinated, but the Si atoms can have coordination 3, 4, 5 or 6. The amount of Si
atoms that are tri and pentacoordinated increases when the concentration of C increases in the
samples. This indicates an increase in the disorder of the system.
These calculated geometric structures are used to obtain the electronic properties of a-Si,
particularly the density-of-states and the optical absorption spectrum. Further studies of the
electronic structure of a-Ge and a-Sii-,C, are being made in our group.
References :
1. See, for instance,Proceedings of the 15th Internationa2 Conference on Amorphous
Semiconductors, edited by S. R. Elliott, E. A. Davis and J. Robertson in J. Non-Cryst.
Sol. 164-166 (1993).
2. L. Verlet, Phys. Rev. 159, 98 (1967).
3. N. Metropolis and S. Ulam, J. Am. Stat. Ass. 44, 335 (1949).
4. J. Tersoff, Phys. Rev. B 39, 5566 (1989).
5. J. E. Ridley and M. C. Zerner, Theor. Chem. Acta 32, 111 (1973).
6. M. P. Allen and P. J. Tildesley, Computer Simulation of Liquids, (Claredon Press,
Oxford, 1987) p.24
7. S. J. Cook and P. Clancy, Phys. Rev. B 47, 7686 (1993).
8. A. Fazzio, J. R. Leite and M. L. De Siqueira, J. Phys. C, 12, 513 (1979).
9. S. Canuto and A. Fazzio, Phys. Rev. B 33, 4432 (1986).
10. S. Canuto, M. C. Zerner and G. H. F. Diercksen,Astrophys. J. 377, 150 (1991); K.
11. J. Tersoff, Phys. Rev. B 38, 9902 (1988).
12. I. Stich, R. Car and M. Parrinello, Phys. Rev. B 44, 11092 (1991).
13. A. Filiponi, F. Evangelisti, M. Benfatto, S. Mobilio and C. R. Natoli, Phys. Rev. B 40,
9636 (1989).
14. J. Fortner and J. S. Lannin, Phys. Rev. B 39, 5527 (1989).
15. G. Etherington, A. C. Wright, J. T. Wengel, J. C. Dore, J. H. Clarke and R. N. Sinclair, J.
Non- Cryst. Sol., 48, 265 (1982).
16. C. Schmidt de Magalhães, C. Bittencourt and F. Alvarez, Braz. J. Phys 24, 416 (1994);
L. C. Fang and L. Ley, Phys. Rev. B 40, 3818 (1989); S. Pascarelli, F. Boscherini, S.
Mobilio and F. Evangelisti, Phys. Rev. B 45, 1650 (1992); A. E. Kaloyeros, R. B. Rizk
and J. B. Woodhouse, Phys. Rev. B 38, 13099 (1988) and 0. Chauvet et al., Mater. Sci.
Forum 83, 1201 (1992).
17. F. Finochi, G. Galli, M. Parrinello and C. M. Bertoni, Phys. Rev. Lett. 68, 3044 (1992)