AN EXPERT SYSTEM TO DETECT CAR DAMAGE
BY USING CART METHOD
1 PRATIWI KUSUMA PUTRI, 2 I KETUT GEDE DARMA PUTRA, 3
NI MADE IKA MARINI MANDENNI
123
Department of Information Technology, Udayana University, Bali, Indonesia
E-mail: [email protected] , [email protected], [email protected]
ABSTRACT
The information of car fault by car breakdown symptoms is the important thing to note. In this study created on expert system to detect damage to the car by using Classification And Regression Tree (CART) Method. CART method is a method of classification with decision tree modeling. The input from this study is the data derived from the expert. This study includes three main processes, namely the identification of the input stage. Stage of learning and classification stage. The learning stage produces the decision tree output as a rules detection of car damage. The classification stage produces the output in the form of car damage detection results based on the symptoms that entered by the users.
Keywords: Expert System, CART, Detection of Damage , Decision Tree, Car Damage.
1. INTRODUCTION
Due to advancement in technology getting a car is cheap, but maintaining it is very expensive. It is also difficult to get a good mechanic [1]. The proposed system for dealing with the problem is an expert system. An expert system is a system that employs human knowledge captured in a computer to solve problem that ordinarily require human expertise [2]. Expert system seek and utilize relevant information from their human users and from available knowledge bases in order to make recommendations [3].
There are several approaches that could be used in building an expert system. The one that seems right for this case of detecting symptoms of this car is by using the Classification And Regression Tree Method (CART). This method is a method that can be applied to large amount of data, very much variables and through binary sorting procedure [4].
Based on the above, the authors design and create a system that can act as a car mechanic (experts), using a web-based CART approach.
This study includes three main processes, they are the identification of input stage, stage of learning and classification stage. The input identification phase sourced from experts, experts in this study was a mechanic/auto mechanic. The
data were provided by expert in the form of car damage diagnosis from damage symptoms. Learning phase involves determining the prospective branch. The calculation scale of suitability which produces output binary decision tree [5]. Classification stage is the stage of user inputs the damage symptoms that produce the car damage’s diagnosis, the classification stage here use the rule of decision trees generated by CART algorithm [6].
Limitation of issues contained in this system is the system is limited to the knowledge base and the data obtained, there are only 34 cars for the type of damage to the system,this system uses the CART method based reasoning to infer where the symptoms are there to draw a conclusion, the resulting output is the possibility of damage caused to the car.
2. CAR DAMAGE
Based on 25 parameter class which is temperature, when engine turn on, smoke, fuel, oil seepage, oil indicator, water reservoir, water radiator, water temperature indicator, water seepage, brake fluid seepage, battery indicator, brake, brake pedal, bums, wheel, the clutch, gear, light, horn, on off, engine off and sudden death, Table 1 is for car damage and the parameter problem [7].
Table 1: Car Damage
No Car Damage Parameter Problem
1 Radiator Temperature engine hot
There is water seepage on the
bottom of the car
Car suddenly death
2 Radiator Tube Car Engine Hot
There is water on the bottom of
the car
Car never sudden death
3 Radiator lid Engine temperature hot
Less water reservoir
4 Radiator fan Engine temperature hot
Water reservoir exceed the limit
5 Tie rod Engine temperature hot
Swing wheel
6 Thermostat Engine temperature cold
Fuel wasteful
7 Light Light off
8 Brake master Brake not grip
There is brake fluid seepage
9 Horn Horn not sound
10 Brake booster Brake not grip
11 Clutch Hard to stomp the clutch
12 Clutch master Gear difficulty to enter
Brake not grip
13 Battery (ACCU) Difficult to starter
Engine sometime turn off
14 Fuel Pump Difficult to starter
Car engine suddenly death
15 Depleted gas Difficult to starter
Engine death
16 Magneto ignition
broken
Engine turned hardly but can turn on
17 Damaged coil Vehicle difficult turned
Wasteful fuel consumption
18 Injector or
carburetor
Vehicle difficult turned
Wasteful fuel consumption
black smoke
19 Throtle Body Vehicle difficult turned
Wasteful fuel consumption
black smoke
Car engine dies
20 oil Leaks The sound of metal clashing
Oil indicator lights up
There is oil seepage under the
vehicle
21 Engine Knocking Tickling sound while running car
22 Broken car axle Whoosh sound
23 Clutch Bearings Gear difficult to enter
24 Car transmission
problem
sounded like metal clashing sound clash
Gear difficult to enter
Unusual sound like a buzzing
sound
25 fan belt Screeching sound
Heavy steering wheel
26 Bearing Steering wheel is not normal,
sometimes shake or weight
Rumbling sound
27 Burshing stabilizer Steering wheel is not normal,
sometimes shake or weight
Screeching sound when uneven
road
28 Shock breaker Rumbling sound
Steering wheel is not normal,
sometimes shake or weight
As we passed the bump feels like
swinging
29 Plug Wasteful fuel consumption
black smoke
30 Power Steering Screeching sound
Steering wheel shake
31 Velg Steering wheel shake
32 Damaged Brake
Shoes
Sounds like brake squeal
Brakes do not grip
33 Car tires steering wheel shake
3. THE EXPERT SYSTEM
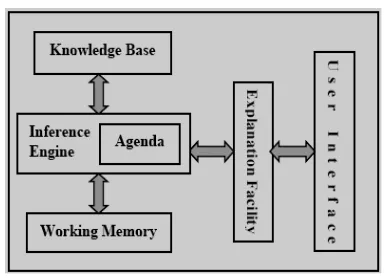
Expert system are classified into six categories [8]. There are Rule-based system, Knowledge-based system, Intelligent Agent (IA), Database methodology, Inference engine, System-user interaction.
Expert system consists of user interface, explanation facilities, knowledge base and inference engine. The expert system structure shown in the figure 1.
Figure 1 Expert System Structure [8]
4. CLASSIFICATION AND REGRESSION TREE (CART)
CART (Classification and Regression
Trees) is one of the methods or algorithms of any of
the techniques of data exploration decision tree as for the characteristics of this method, which is a binary has two branches for each decision node [9]
4.1 CART Algorithm Steps
The CART algorithm steps are as follow [10]
4.1.1 Determine the Candidate Split
Determine the candidate split of each parameter, that is by looking for a candidate with the right and left split based on class variable [9][10].
4.1.2 Calculate the value of PL and PR
Calculate the value of PL at each candidate split,
where PL is a chance left candidate split on on the
training data and tL is left candidate split at a
decision node t[9][10].
(1)
Then calculate the value of PR on every candidate
split of each parameter. Where PR is the possibility
of right candidate split at training data and tR right
candidate split on decision node t
(2)
4.1.3 Calculate the value of P(j/tL) and P(j/tR) Calculate the value of for each class for every candidate split at every each parameter. P(j/tL)
is an possibility of left candidate split at every class and TLis the left candidate split at decision node
t[9][10].
(3)
Calculate the value of for each class for every candidate split at every each parameter. P(j/tR)
is an possibility of right candidate split at every class and TRis the right candidate split at decision
node t
(3)
4.1.4 Calculate the value of 2PLPR
Calculate for value of 2PLPR on the first candidate
split. Where PL is the possibility of left candidate
split on training data and PR is the possibility of
right candidate split on training data[9][10].
(5)
4.1.5 Calculate the value of Q(s|t)
Calculate the value of Q(s|t) on the first candidate
split, where Q(s|t) is the sum of all reductions P(j|tL)
and P(j|tR). P(j/tL) is an possibility of left candidate
split at every class. P(j/tR) is an possibility of right
candidate split at every class[9][10].
(6)
4.1.6 Calculate the value of θ(s|t)
Calculate the value of θ(s|t) on the first candidate
split where θ(s|t) is the sum of all the reductions P(j|tL)
[image:3.595.93.285.367.506.2]possibility of left candidate split at every class, P(j/tR) is an possibility of right candidate split at
every class, PL is a chance left candidate split on on
the training data and PR is the possibility of right
candidate split at training data[9][10].
(7)
4.1.7 Draw a decision tree
After getting the amount of conformity the next step is to describe the rule that a decision tree of greatest magnitude specific maximum θ(s|t) for the
main node. Then proceed to the next iteration until the leaf nodes and form a complete decision trees
(fully grown from) [9][10]..
5. SYSTEM OVERVIEW
The system is divided into two of control room, first systems administrator that is rooms that serve to manipulate (add, modify, and delete) data management such as user data, symptom data, diagnostic data, the data questions and others. Second, room visitors or users that can only access information of a general nature, such as the detection process systems can also view information about car damage. This system is a web-based system to be built with the aim to facilitate knowledge about the damage to the car, so that later created a system that can give information even assist in the detection of a malfunction. The system will provide a diagnosis of any damage suffered by a car based on the symptoms of a given user. The approach set out in this expert system using Classification And Regression Tree (CART) method
. In the process, the user will interact with the system through a debriefing process. The question posed system is presented using a knowledge based tree modeling, then the system asks questions with multiple choice answers corresponding variable parameters that have been analyzed first. The output of this system is the conclusion of what the car suffered damage produced by such methods.
[image:4.595.293.512.75.224.2]Overview of the system can be seen in the image below:
Figure 2 General Overview Process of Car Damage Detection
6. TESTING AND ANALYSIS OF RESULT
Examination of the result of the calculation method of CART based on the result of decision tree generated by the equal system of the decision tree results calculation of the CART manually.
Provision aims to determine the value of θ(s|t) great suitability value of each candidate branch symptom questions at each damage [10]. This expert system is used to construct scale suitability rules. θ(s|t) values vary from each iteration.
6.1 Determine the Training Data
Training data taken from the literature study data and data experts. There are 36 pieces of training data, with 25 pieces parameters of damage symptom and 34 pieces parameters of damage class.
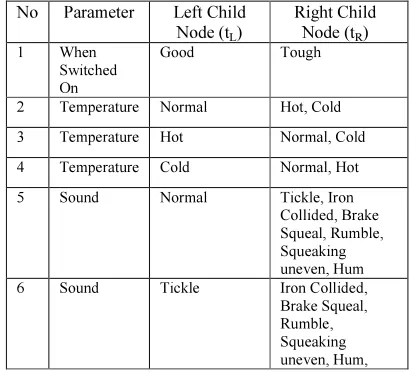
6.2 Determine the Candidate Split
The first step is to determine the candidate split can be seen in table 2.
Table 2 : Table Candidate Split
No Parameter Left Child Node (tL)
Right Child Node (tR)
1 When
Switched On
Good Tough
2 Temperature Normal Hot, Cold
3 Temperature Hot Normal, Cold
4 Temperature Cold Normal, Hot
5 Sound Normal Tickle, Iron
Collided, Brake Squeal, Rumble, Squeaking uneven, Hum
6 Sound Tickle Iron Collided,
[image:4.595.301.506.559.748.2]Normal
7 Sound Iron Collided Tickle, Brake
Squeal, Rumble, Squeaking uneven, Hum, Normal
8 Sound Brake Squeal Tickle, Iron
Collided, Rumble, Squeaking uneven, Hum, Normal
9 Sound Rumble Tickle, Iron
Collided, Brake Squeal, Squeaking uneven, Hum, Normal
10 Sound Screeching if
uneven
Tickle, Iron Collided, Brake Squeal, Rumble, Hum, Normal
11 Sound Squeaking Tickle, Iron
Collided, Brake Squeal, Rumble, Squeaking uneven, Hum, Normal
12 Sound Hum Tickle, Iron
Collided, Brake Squeal, Rumble, Squeaking uneven, Normal
13 Smoke Colorless Black
14 Fuel Normal Wasteful
15 Oil seepage There is/yes No
16 Oil indicator Turn on Turn off
17 Water
reservoir
Normal Reduce, Exceed
the limit
18 Water
reservoir
Reduce Exceed the limit,
normal
19 Water
reservoir
Exceed the limit
Normal, Reduce
20 Water
radiator
Normal Reduce
21 Water
temperature indicator
Turn on Turn off
22 Water
Seepage
There is/yes No
23 Brake Fluid
Seepage
There is/yes No
24 Indicator
Brake Fluid
Turn on Turn off
25 Battery
Indicator
Turn on Turn off
26 Brake Grip Not Grip
27 Brake Pedal Normal Trampling in
28 Bumps Once Swing
29 Wheel Normal Swing, Heavy
30 Wheel Swing Heavy, Normal.
31 Wheel Heavy Normal, Swing
32 Stomp the
clutch
Normal Hard, Sound,
Deep
33 Stomp the
clutch
Hard Sound, Normal,
Deep
34 Stomp the
clutch
Sound Deep, Normal,
Hard
35 Stomp the
clutch
Deep Normal, Sound,
Hard
36 Gear Normal Difficult to enter
37 Light Turn on Dim, Turn off
38 Light Dim Turn off, Turn on
39 Light Turn off Turn on, Dim
40 Horn Turn on Weak, Turn off
41 Horn Weak Turn off
42 Horn Turn off Turn on
43 On off Yes No
44 Engine Turn
off
Turn on Turn off
45 Sudden
Death
Yes No
Based on a split candidate performed calculations to obtain the amount of conformity θ(s|t). As an example of calculating the first candidate
split. As for the steps to find the suitability θ(s|t). is
as follow
6.3 Calculate the Value of PL and PR
Calculate the value of at the first split candidate by using equation 1. Where there are 27 pieces of split tL candidate who has a parameter
When Switch On-Good and there are 36 pieces of data training.
Calculate the value of at the first candidate split by using equation 2. Where there are 9 pieces of split tR candidate who has a parameter
When Switch On-Tough and there are 36 pieces of training data.
values calculated up to the last class. that is the class to-34
Calculate the value of at each class in the first split candidate by using equation 4
values calculated up to the last class. that is the class to-34
4
6.5 Calculate the Value of 2PLPR
Find the value of 2PLPR at the first
candidate splitby using equation 5
6.6 Calculate the Value of Q(S/T)
Find the value of Q(s|t) at the first candidate
splitby using equation 6
6.7 Calculate the Value of (S/T)
Find the value of θ(s|t) at the first candidate
splitby using equation 7.
So the result of first iteration θ(s|t) at the
first candidate split was 0,75. This calculation is done as the number of candidate split, which is 45 times. The following table of calculation result using the method of CART in all of candidate split.
Table 3: Result of Calculation of The First Iteration on The Entire Candidate Split
Candidate Split
PL PR 2PLPR Q(s|t) (s|t)
1 0.75 0.94 0.37 2 0.75
2 0.83 0.97 0.27 1.67 0.46
3 0.13 0.94 0.23 2 0.47
4 0.02 0.97 0.05 2.064 0.11
5 0.69 0.94 0.42 2 0.85
6 0.02 0.94 0.0 1.94 0.10
7 0.05 0.08 0.10 2.94 0.31
8 0.02 0.30 0.05 1.44 0.08
9 0.05 0.94 0.10 1.94 0.20
10 0.02 0.97 0.05 1.94 0.10
11 0.05 0.13 0.10 1.94 0.20
12 0.05 0.91 0.10 1.94 0.20
13 0.91 0.94 0.15 2 0.31
14 0.69 0.13 0.42 1.81 0.77
15 0.05 0.86 0.10 1.94 0.20
16 0.02 0.94 0.05 1.94 0.10
17 0.86 0.97 0.23 1.6 0.38
18 0.08 0.97 0.15 1.93 0.30
19 0.05 0.94 0.10 1.88 0.20
20 0.86 0.08 0.24 1.6 0.38
21 0.13 0.05 0.23 2 0.48
22 0.05 0.02 0.10 2 0.21
23 0.02 0.19 0.05 1.94 0.10
24 0.02 0.83 0.05 1.94 0.10
25 0.05 0.91 0.10 1.94 0.20
26 0.91 0.08 0.15 2 0.31
27 0.94 0.97 0.10 2 0.21
28 0.97 0.97 0.05 2 0.11
30 0.13 0.11 0.23 1.93 0.45
31 0.05 0.08 0.10 1.93 0.20
32 0.91 0.97 0.15 2 0.31
33 0.02 0.94 0.05 1.94 0.10
34 0.02 0.08 0.05 1.94 0.10
35 0.02 0.97 0.05 1.94 0.10
36 0.89 0.94 0.19 2 0.40
37 0.92 0.83 0.15 2 0.31
38 0.03 0.19 0.05 1.88 0.10
39 0.05 0.77 0.10 1.88 0.20
40 0.92 0.94 0.15 2 0.31
41 0.02 0.97 0.05 1.88 0.10
42 0.05 0.94 0.10 1.88 0.20
43 0.16 0.97 0.27 1.93 0.54
44 0.80 0.94 0.31 2 0.63
45 0.22 0.94 0.34 1.92 0.67
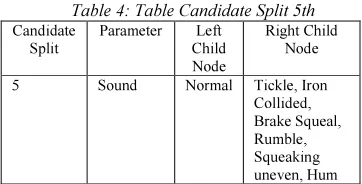
6.8 Draw a Decision Tree
[image:7.595.99.416.100.400.2]Describe the rule in the form of a decision tree θ(s|t). The rule of decision tree drawn based on the biggest Q(s|t). That is a candidate split 5th. Candidate split 5th namely.
Table 4: Table Candidate Split 5th
Candidate Split
Parameter Left
Child Node
Right Child Node
5 Sound Normal Tickle, Iron
Collided, Brake Squeal, Rumble, Squeaking uneven, Hum
Following the result of the decision tree rule based on the first iteration.
Figure 3 Decision tree rule based on the first iteration
[image:7.595.235.503.111.435.2]And so on repeated back to step 1 until the end of the leaf nodes formed and form a complete decision tree (fully grown from). To form a complete decision tree takes as much as 56 times iteration. The following is decision tree complete figure (fully grown from).
Figure 4 Decission Tree
6.9 Analysis Questionnaire
Questionnaires were distributed to respondents 5 to 34 pieces of the number of questions and 5 choices for the accuracy of the values are 1 very low, 2 low, 3 moderate, 4 high, 5 very high.
Based on the results of the data obtained recapitulation questionnaire respondents answered there is no one that is a very low value and the value of 2 is low, there are 25 answers to the value of 3 is moderate, there are 77 answers to the high value and there were 68 answers with a very high score.
The following table is a table of the results of questionnaires accuracy value of each variable damage based questionnaire.
Table 6 : Questionnaire Result
No Damage Variable Accuracy Value ( )
1 Damaged radiator 80
2 Damaged Radiator Hose 76
3 Radiator cap 76
4 Radiator fan 88
[image:7.595.87.268.460.552.2]6 Thermostat 80
7 Light bulb 92
8 Brake masters 84
9 The car is not damaged or
is not found damage
100
10 broken horn 92
11 brake booster 92
12 clutch plate 84
13 Master Clutch 96
14 Battery (batteries) 76
15 Fuel Pump faulty 84
16 gasoline Out 84
17 Magneto ignition broken 88
18 Damaged coil 84
19 Injector 84
20 throtle body 72
21 oil Leaks 92
22 Knocking machine 76
23 Broken car axle 80
24 Clutch Bearings 92
25 Car transmission problem 84
26 fan belt 86
27 Bearing 80
28 Burshing Stabilizer 92
29 Shock breaker 84
30 Plug 80
31 Power Steering 92
32 Alloy Wheels 88
33 Damaged Brake Shoes 80
34 Car tires 92
Based on the questionnaire calculation results obtained from the Assessment Questionnaire Results Diagnosis Expert System Damage Detection Method Using Car Cart has an average of 85.23% with the lowest value of the range is 72% and the highest value is 100%.
7. CONCLUSION
Conclusions drawn from this system is the method Classification And Regression Tree (CART) successfully implemented the answers given by the user and the data provided by the experts. CART method produces shorter rules, but has a high accuracy is the average accuracy of 85.23% thus suitable for detecting damage to the car, because this expert system has a lot of class variable damage.
REFRENCES:
[1] Deepa S.T., Packiavaty S.G. “Expert System For Car Troubleshooting”, International
Journal For Research In Science &
Advantance Technology, Issue 1, Vol 1, 2012,
pp 046-049.
[2] N.M.A. Zahrani, S. safeeullah, A.G. Memon. "Breast Cancer Diagnosis and Treatment of Prophetic Medicine Using Expert System",
Journal of Information & Communication
Technology, Vol. 4, No. 2, Fall 2010, pp 20-26.
[3] Samy S.Abu Nasr, Mohammed H.Baraka and Abdurrahman Baraka, “A Proposed expert system for guiding freshman students in selecting a major in Al-Azhar University, Gaze”,Journal of Theoretical and Applied information Technology”,2005-2008
[4] F.E. Pratiwi, I. Zain, “Klasifikasi Pengangguran Terbuka Menggunakan CART
(Classification and Regression Tree) di
Provinsi Sulawesi Utara” Jurnal Sains Dan
Seni Pomits Vol. 3, No.1.2014 pp d54-d59
[5] Lewicki P. dan Hill T., “Statistics: Methods and Applications”. Statsoft USA. 2006
[6] Shu-Hsien L., “Expert system methodologies and applications - a decadereview from 1995 to 2004”, Expert Systems with Applications. 2005. [7] Haefner Ronald, “The Car Care Book”,
Cengage Learning, 2008.
[8] Widagdo. K. A, “Pembentukan Pohon Klasifikasi Biner dengan Algoritma CART. Studi Kasus Penyakit Diabetes Suku Pima” Indian. Universitas Diponegoro, 2010
[9] A. Wibowo, A. Purwarianti, “Penerapan Bagging Untuk Memperbaiki Hasil Prediksi Nasabah Perusahaan Asuransi X” Sekolah Teknik Elektro Dan InforTurn offka Institut
Teknologi Bandung, 2011
[10] Sneha Soni “Implementation Of Multivariate Data Set By Cart Algorithm” International Journal of Information Technology and
Knowledge Management. Volume 2, No.