ISSN: 1992-8645 www.jatit.org E-ISSN: 1817-3195
138
AN EFFICIENT GENTLE ADABOOST-BASED APPROACH
FOR MAMMOGRAMS CLASSIFICATION
NEZHA HAMDI1, KHALID AUHMANI2, MOHA M’RABET HASSANI1, OMAR ELKHARKI3
1Department of Physics, Faculty of sciences Semlalia,
Cadi Ayyad University, Marrakech, Morocco
2 Department of Industrial Engineerin, National school of applied sciences
Cadi Ayyad University, Safi, Morocco
3Ecole Nationale de Commerce et de Gestion (ENCG)
Ibn Zohr University, Agadir, Morocco
E-mail: [email protected]
ABSTRACT
In this work we have proposed and evaluated a new approach for classification of mammograms. This approach is based on Gentle AdaBoost. Our main contribution in this proposition is that the strong classifier is constructed by wheited weak classifiers. These weak classifiers are extracted from the sub-bands of discrete wavelet transform. We have used the Receiver Operating Curves (ROC) tool to evaluate our proposition with mammograms of MIAS Database. We have presented True positive rate versus false positive rate for different features types and Gentle AdaBoost iteration number. Obtained results show that the best area under curve (AUC), which represents the approach performance, is reached for Zernike moments and it is equal to 0,98 and 0.99 for T=10 and T=50 respectively. The other features types allow an AUC comprised between 0.7 and 0.76. Results show also that performance of the proposed approach is slightly improved if the number of iterations is increased.
Keywords: Machinelearning, Classification, Gentle AdaBoost, Discrete wavelet transform, ROC, Feature
Extraction.
1. INTRODUCTION
The Boosting is an aggregation method of weak classifiers for final strong classification [1-4]. Its principle is based on the fact that it is easier to provide a high number of elementary procedures for decision-making, which will be combined later, instead of directly building a robust, complex and accurate classifier. These elementary p²rocedures are built by iteration. The number of iterations is then a basic parameter of Boosting.
In this context, the first algorithm and the most often used in object recognition is AdaBoost (Adaptive Boosting) [1, 6]. The main idea of the AdaBoost algorithm is to combine a collection of weak classifiers to build a strong classifier. It is called "weak classifier" a simple classifier which can not classify accurately the training set even with the best classification function. At each iteration of AdaBoost algorithm, we find the optimal weak classifier and the classification error is calculated. Depending on the error, we calculate the weight of
the weak classifier, and update the data weights (initially equal) so that the weights of misclassified objects are increased and the weights of well classified objects are reduced. This ensures finding in the next iteration another weak classifier that classifies better misclassified examples. The strong final classifier consists of all the selected weak classifiers, weighted by their weight.
The AdaBoost algorithm is characterized by its sensitivity to noise. An improvement has been proposed to solve this problem; it is the Gentle AdaBoost algorithm [7].
This paper deals with the classification of mammographic images into normal or abnormal based on Gentle AdaBoost algorithm and discrete wavelet transform (DWT). DWT is an important multiresolution analysis tool that has been recently
applied to image processing, and various
ISSN: 1992-8645 www.jatit.org E-ISSN: 1817-3195
139 in MATLAB and the performances of this approach are tested with MIAS Database using the receiver operating curve tool (ROC).
This paper is organized as follows. After the introduction, Gentle AdaBoost, Discrete wavelets transform and extracted features based on DWT are discussed in Section 2. Section 3 describes the proposed methodology for the best classifier construction. In section 4 we present experimental results achieved based on the proposed approach. Finally we draw our conclusions and perspectives in Section 5.
2 MATERIALS AND METHODS
2.1 AdaBoost approach
Introduced by Freund & al [1], the AdaBoost is based on the fundamental principle of Boosting and postulates that the opinion of several simple and weak classifiers is better than that of a single complex and strong classifier. The objective is to combine several weak classifiers to generate a powerful classifier. In the AdaBoost algorithm is proposed an a priori probability distribution on the learning set in terms of the response to the previous algorithm iteration.
Let S be the learning set composed of N
examples: S x , y i 1, … N , as xi is the feature
vector of an object and yi indicates the label of the object .
In our case, we perform the classification into two classes, yi = 1 if the object belongs to a class of objects called "positive"; the mammogram is abnormal, and yi = -1 if the object belongs to a class of objects called "negative"; the mammogram is normal. Pt is the weight vector in which each value is the weight associated with each object; initially Pt= P0 and all elements have the same value. A sample, denoted S1 and comprising N1 examples (with N1 <N) is then selected from the training set. A classifier C1 is trained on the sample, which provides an h1 hypothesis directly corresponding to the class of the object. This decision rule is then applied to all the examples included in S to
calculate the error ε1 of the classifier C1 on the set
S. The weight for each example is then updated according to the result of the classification. If a sample is classified, weight decreases and if improperly classified its weight increases. For this, a coefficient α1 is calculated as:
α (1)
The weight of different objects is:
P X e ! (2)
P X e" #! (3)
Z Is a normalization term as:
∑ P X& 1 (4)
After this step of updating weights, a new sample of objects is selected. The priority is given to those whose corresponding weights are highest. Then a new classifier is trained on this sample. In this way, the new classifier created will focus on examples that are previously misclassified. The weights are then updated and the process is repeated t times (with t <T) as the global error throughout the training set €T is not zero. A set of weak classifiers T is then obtained, which will be combined to generate the powerful classifier C.
At the end of the algorithm, each weak classifier sees its decision rule weighted by a value αt calculated during learning; for the classification of a new instance, the poweful classifier provides the following hypothesis:
H X sign ∑ α-+ +h+ X (5) For an object having the feature vector X, if H (X)> 0, the object is associated with the positive class (Abnormal), and if H (X) <0 is associated with the negative class (Normal).
In practice, a threshold is set and when the global error is below it, the algorithm stops adding new weak classifiers. Indeed, when only a few
misclassified examples remind, new added
classifiers exclusively will focus on these examples and do not bring a real improvement on the final decision rule. The goal is to create a strong classifier able to correctly generalize to new unknown examples. Add new weak classifiers only for some examples is not useful and may even damage the final results of the strong classifier (over-learning problem).
2.2 Gentle AdaBoost approach
The AdaBoost algorithm is sensitive to outliers and thus to noise in the training set. Solutions have been made to solve this problem as Gentle AdaBoost [7] or BrownBoost [9].
ISSN: 1992-8645 www.jatit.org E-ISSN: 1817-3195
140 best separate the positive and negative examples. The algorithm selects the n most informative descriptors, give them a weight W and applies a threshold th. This approach is effective because of its stability and robustness when it comes to noisy data [10].
First, in Gentle AdaBoost algorithm [11], authors use a weighting scheme that exploits a function of
margins which decreases slower than the
exponential function used by AdaBoost. Gentle AdaBoost minimizes the exponential loss function of AdaBoost using Newton steps [12].
Secondly, Gentle AdaBoost is a variation of the
Real AdaBoost approach which stimulates
performance by applying a regression by the weighted least squares method. Furthermore, Real AdaBoost and Gentle AdaBoost don’t normalize all learners weighted in the same way, since the normalization function of Real AdaBoost is given by [11]:
F& X P/ y 1|X 1 P/ y 11|X (6)
Whereas for Gentle AdaBoost, updating the class of weighted probability is given by the following function:
f& x log 55! |! | (7)
Gentle AdaBoost algorithm is given by [13]:
2.3 Wavelet Transform
Wavelet transform is a powerful tool in image processing and computer vision. In recent years
many applications, such as classification,
recognition and image retrieval have been
investigated. Wavelet transform is characterized by features of space-frequency localization and multiresolutions. The main reasons for Wavelet transform popularity are its complete theoretical framework, its great flexibility for choosing bases and the low computational complexity [14].
In this paper we will use the discrete wavelet transform (DWT) for feature extraction and weak classifiers generation as each sub-band will be used to generate these classifiers. Wavelet Transform performs multi resolution image analysis and the transformation is done by passing the image through a series of filter bank stages.
2.4 Feature Extraction
Initially, the features are calculated to form the feature vector for subsequent learning step. These features are calculated on a set of two classes labelled mammograms (normal and abnormal). These images are firstly preprocessed and transformed into the frequency domain by DWT.
The following features are extracted:
• For each of the sub-bands, two primitives are
calculated: Energy and the standard deviation. The energy of each sub-band is calculated and then averaged by the number of wavelet coefficients of this sub-band. From these coefficients, standard deviation (STD) is calculated in the following equations:
(
)
(
)
21 2 , , 1 2 1 ,
)
)
(
1
(
1
m k j k j m k N m k k N m j m k k kw
mean
w
N
STD
w
N
SE
k k−
=
=
∑
∑
= =Where
ω
kj,mis the mth wavelet coefficient of the kthsub-band of level j. k : index of the frequentiel sub-band
Nk : Number of coefficients of the kth sub-band.
• Three of the six parameters introduced by
Tamura are used to characterize textures by Tamura method, namely, coarseness, contrast and directionality. We also calculate an histogram of 3 bins on the coarseness. In total, this group of descriptors forms a vector of six texture features [15].
• Radon’s characteristics are calculated for angles
0°, 45°, 90 ° and 135°. We also calculate the Given:
The weights W 7, i 1, . . , N and F x 0
1. Do for pour m=1, 2, … M
Estimate f& x using weighted least square from
y to x.
Update de F x ← F x ; f& x
Define W ← W exp =1yi. f& xi > avec i= 1, 2,
…, N then normalize ∑ W 1
ISSN: 1992-8645 www.jatit.org E-ISSN: 1817-3195
141 histogram of 3 bins for the four series, which gives a vector of 12 features [16, 17].
• Zernike’s moments of order n = 12 are
calculated corresponding to 49 features [18].
2.5 The proposed approach
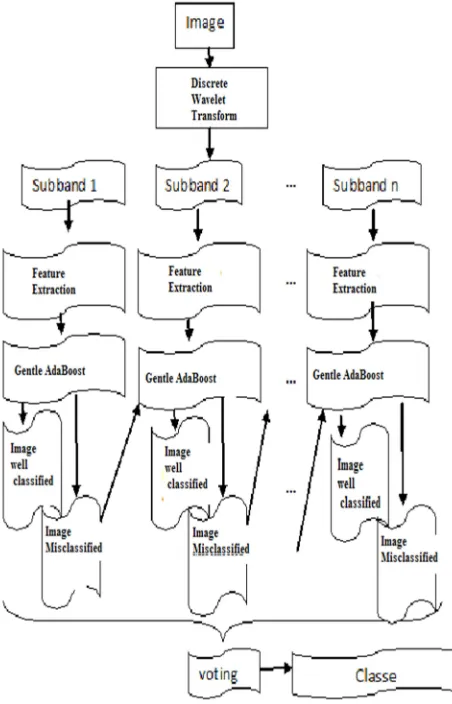
Our contribution to the recognition method based on Gentle AdaBoost is mainly the manner in which the powerful classifier is constructed. We propose an approach based on the multi-scale concept of wavelets where each weak classifier is a sub-band. The sub-bands would work in cascade as opposed to the system previously used in which coefficients of all sub-band are concatenated in one data matrix. The algorithm described in Figure 1 performs a classifiers aggregation of “decision stump” type. We construct the first classifier (corresponding to the first sub-band) using the weights which are all equal. Several boosted classifiers, dependently increased complexity in the number of sub-band, are cascaded to achieve an efficient classifier, both in terms of speed and performance.
At each iteration, we find the optimal classifier
and low classification error is calculated.
Depending on the error, we calculate the weight of the weak classifier, and update the data weights (initially equal) so that the weights of misclassified images are increased and the weights of well classified data are reduced.
The goal of our approach is to update adaptively, the distribution of objects weights to increase the weight of misclassified data in the previous step. But, unlike the usual Boosting algorithm where classifiers at starting points have all wrong classes as input, we propose to iterate the execution based on data from a sub-band and also on all misclassified items from previous sub-bands.
For learning step we use a construction algorithm of stump. They have the distinction of being trees at one level and have two terminal leaves, labeled by distinct classes. In order to improve the performance evaluation, the samples are sorted in each dimension and the error of stump is updated incrementally during the course in each dimension.
The evaluation of the stump is very simple, as you only have to compare the attribute designated by the latter with a threshold calculated also during training. The stump defines an hyperplane orthogonal to an axis and since the number of stump is finite, it is possible to test them all and so find the one that minimizes the error function. The
stump will always return the minimum drive error classifier.
[image:4.612.322.548.153.505.2]The proposed approach is summarized and presented in figure 1.
Figure 1 New Approach Scheme For Mammograms Classification Based On Gentle Adaboost And Discrete
Wavelet Transform.
3. EXPERIMENTAL RESULTS
3.1 Dataset:
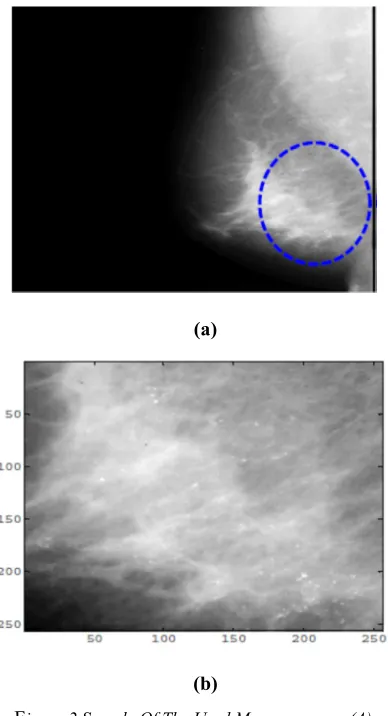
The proposed approach is evaluated on the original mammographic images of MIAS database [19]. These images of original size 1024*1024 are accompanied by the opinion of the radiologists that
specify the class of the image, the
ISSN: 1992-8645 www.jatit.org E-ISSN: 1817-3195
142 of original image and a ROI containing Microcalcifications which are the first sign of an eventual presence of breast cancer.
(a)
(b)
Figure 2 Sample Of The Used Mammograms: (A) 1024×1024 Typical Breast Image (Mdb233), (B)
256×256 Region Of Interest Containing Microcalcifications
3.2 Results and discussion
Learning performances are evaluated using Receiver Operating Curves (ROC) which represents the false negative rate versus the true positives rate for different discrimination thresholds. The area under the ROC curve (AUC) indicates the performance of a classifier. It can be interpreted as the probability of assigning a higher score to a positive object when it randomly chooses a positive and a negative object.
We built 50 Bootstrap samples (ie 50 samples of 107 observations obtained by sampling with replacement in the basic sample). Experiments are carried out for two values of iterations t=10 and t=50. Figures 3 and 4 show the ROC curves generated for t= 10 iterations and t=50 iterations
respectively. ROC curves are generated for four different extracted features from image after the discrete wavelet transform as explained above.
[image:5.612.98.292.131.489.2]The first observation is that Zernike moments allow the best classification rate of mammograms. The area under the curve (AUC) is near to 1in both cases t=10 and t=50. The second remark is that classification accuracy has been improved for t=50 iterations for all feature types. In fact AUC=0.98 and 0.99 for t=10 and t=50 respectively.
[image:5.612.321.536.221.406.2]Figure 3 ROC Curves For Different Features Type And For T=10 Iterations
Figure 4 ROC Curves For Different Features Type And For T=50 Iterations
4. CONCLUSION
[image:5.612.318.538.402.615.2]ISSN: 1992-8645 www.jatit.org E-ISSN: 1817-3195
143 wheited. These weak classifiers are extracted from à sub-band of discrete wavelet transform.
Mammogram undergoes a discrete wavelet transform after what some features are extracted; Zernike moments, Tamura parameters, Radon characteristics, Energy and standard deviation. These features are grouped in a vector to learn the weak classifier.
We have used the Receiver Operating Curves (ROC) tool to evaluate our proposition with mammograms of MIAS Database. We have presented True positive rate versus false positive rate for different features type and Gentle AdaBoost iteration number.
Obtained results show that The best area under curve (AUC), which represents the approach performance, is reached for Zernike moments and it is equal to 0,98 and 0.99 for T=10 and T=50 respectively. The other features types allow an AUC comprised between 0.7 and 0.76. Results show also that performance of the proposed approach is slightly improved if the number of iterations is increased.
In future works we will introduce different type of wavelet transform in the approach and investigate the impact on the classification accuracy.
REFERENCES
[1] Y. Freund “Boosting a weak learning algorithm
by majority. Information and Computation” 121(2): 256–285, 1995.
[2] R. Meir and G. Ratsch. An introduction to
boosting and leveraging. Lecture Notes In Artificial Intelligence, pages 118–183, 2003.
[3] R. E. Schapire. The strength of weak
learnability. Machine Learning, 5(2) :197–227, 1990
[4] R. E. Schapire. The boosting approach to
machine learning: an overview. In Proceedings of the MSRI Workshop on Nonlinear Estimation and Classification, 2002.
[5] Robert E. Schapire, Yoav Freund, Peter
Bartlett, and Wee Sun Lee. Boosting the
margin: A new explanation for the
effectiveness of voting methods. The Annals of Statistics, 26(5):1651–1686, October 1998.
[6] R. E. Schapire and Y. Singer. Improved
boosting algorithms using confidence-rated predictions.Machine Learning , 37(3) :297– 336, December 1999.
[7] Trevor Hastie, Robert Tibshirani, and Jerome
Friedman. Elements of Statistical Learning: Data Mining, Inference and Prediction. Springer-Verlag, New York, 2001.
[8] L. Nanni and A. Lumini, “Wavelet selection
for disease classification by DNA microarray data,” Expert Systems with Applications, vol. 38, no. 1, pp. 990–995, 2011.
[9] Yoav Freund. An Adaptive Version of the
Boost by Majority Algorithm. Machine Learning, 43(3) :293–318, June 2001.
[10] A.Vezhnevets, V.Vezhnevets, ‘‘Modest
AdaBoost – teaching AdaBoost to generalize better, Graphicon’’, pp.322-325, 2005.
[11] J.Friedman, T. Hastie, and R..Tibshirani,
‘‘Additive logistic regression: a statistical view of boosting, ’’ The Annals of Statistics, 28, 337-374, 2000.
[12] M.Culp, K.Johnson, G. Michailidis, ‘‘ ada: an
R Package for Stochastic Boosting, ’’ 2007.
[13] T. Kanade, A.Jain, N.K. Ratha, ‘‘Audio-And
Video-Based Biometric Person
authentification,’’, 5th International
Conference, AVBPA 2005, Hilton Rye Town, NY, USA, July 20-22, 2005
[14] Bai-Ling Zhang, Haihong Zhang and Shuzhi
Sam Je, “Face Recognition by Applying
Subband Representation and Kernel
Associative Memory”, IEEE Transaction on Neural Networks, Vol. 15, Jan 2004, pp 166-177
[15] H. TAMURA, S. MORI et T. YAMAWAKI.
Texture features corresponding to visual perception IEEE Transactions on Systems, Man and Cybernetics, SMC-8(6):460–473, 1978.
[16] P. HOWARTH et S. RÜGER. Evaluation of
texture features for content-based image retrieval. In Proceedings of the International Conference on Image and Video Retrieval (CIVR’04), volume LNCS 3115, pages 326– 334, Dublin, Ireland, jul 2004.
[17] Deans, S.R. Hough Transform from the Radon
Transform_, IEEE Trans. On Patt. Anal. and Mach. Intell., Vol. PAMI-3, No. 2, pp. 185_188, 1981.
[18] Murphy, L.M. Linear feature detection and
enhancement in noisy images via the Radon transform, Pattern Recognition Letters, No. 4, pp. 279_284, 1986.