ASSESSMENT OF GRAPH THEORY E-LEARNING
UTILIZING LEARNING MANAGEMENT SYSTEM
BENS PARDAMEAN1, TEDDY SUPARYANTO2, RIFKY KURNIAWAN2
1,2Computer Science Graduate Program, Bina Nusantara University, Jakarta, Indonesia 1
E-mail: [email protected]
ABSTRACT
This study evaluated the graph theory e-learning through the utilization of Learning Management System (LMS). In this study, the experimental group used the blended-learning method while the control group used the conventional learning method. Blended learning is defined as a combination between e-learning with LMS and conventional learning. T-test and Pearson's correlation analyses were performed. T-test method was used in order to determine the significant difference of scores between the experimental and the control groups. The result demonstrated that students in the experimental group performed significantly better than those in the control group. The pre-test scores in algebra, calculus, and discrete mathematics showed no significant differences across the board, demonstrating the homogeneity among both groups' participants. Furthermore, the study also utilized the Technology Acceptance Model (TAM) to measure user acceptance of the system. It was found that TAM can be considered as a valid instrument to assess the user acceptance of a system which in this study was the application of graph theory in LMS environment on a subject course at higher education level.
Keywords:Graph Theory; E-Learning; Learning Management System; LMS; TAM
1. INTRODUCTION
Nowadays the use of Information Technology (IT) has had a major impact in the field of computer science and mathematics. Graph theory is part of discrete mathematics, taught abstractly in schools. However, students merely memorize the definitions, concepts, and formulas without having proper understanding of the concept [1].
The introduction of graph theory is presented in the form of images. Various studies have demonstrated that in a learning process, logical thinking becomes more effective if presented and described through pictures or images [2]. Thus, learning the graph theory would require a system of well-integrated media in order to deliver course materials such as images, definitions, and animations to students. Learning Management System (LMS) provides an integrated platform for content and management for the learning process [3]. LMS is also used as a medium for sending, tracing, reporting, and managing contents in learning the graph theory [4].
The focus of this study was the implementation of LMS in order to learn graph theory at the university level. This study was designed to investigate the difference in results between the
experimental and the control groups; the former was taught via the blended learning method while the latter via the conventional learning method. Blended learning is a combination between conventional learning and e-learning utilizing the LMS. The pre-test scores in algebra, calculus, and discrete mathematics were evaluated to demonstrate the homogeneity of mathematical abilities among both groups’ participants.
This study also considered various factors of the existing IT, which was analyzed using the Technology Acceptance Model (TAM). End user computing tendency had led to different reactions in the attitudes and behavior of LMS users. Accept or reject feelings appear to be dimensions of attitudes toward the use of LMS. However, the TAM evaluation in this study was about the study of user behavior on the use of LMS on Graph Theory course at a private university in Jakarta.
1.1 E-Learning
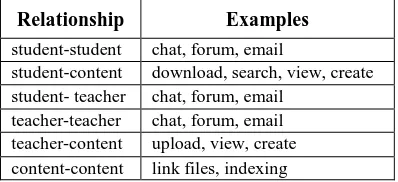
connect those elements through the use of technology. This concept can be described by drawing the model of interaction mapping among the elements. Figure 1 shows the possibility of interaction among those elements. The interaction among e-learning elements creates six types of relationships. They are student, student-content, student-teacher, teacher, teacher-content, and content-content. Table 1 shows the examples of the use of IT in interaction among those elements.
Figure 1. The Elements Interaction Mapping
Table 1. The Elements Relationship
Relationship Examples
student-student chat, forum, email
student-content download, search, view, create student- teacher chat, forum, email
teacher-teacher chat, forum, email teacher-content upload, view, create content-content link files, indexing
1.2 Learning Management System
Having a form of Learning Management System (LMS) is an essential component in establishing an e-learning activity due to its high suitability as a tool for training and evaluating an e-learning process [10]. The LMS that was used in this study was based on MOODLE (Modular Object-Oriented Dynamic Learning Environment), which is an open-source Course Management System (CMS), also known as an LMS or a Virtual Learning Environment (VLE) [11]. The learning-centric components of MOODLE include Assignment, Chat Room, Forum, Questionnaire, Database, Lesson, Glossary, Quiz, Attendance, and Grade [7]. Using the Assignment module
students can upload assignment for teachers to mark and they get an automatic alert when a new assignment arrived. Chat room allows participants to have a real time synchronous discussion via the web. The Forum module contains a number of features for managing and reviewing chat discussions. Questionnaire module can make the teacher asks a question and specifies a choice of multiple responses. Database module is used to store past exam papers, activities for students to do or print out, or collections of student’s work. Lesson module allows a teacher to write a series of lesson pages, each one ending with a question. Glossary module is like the database, except that allows users to rate each other’s contribution. Quiz module allows the teacher to design and set quiz test, consisting of multiple choices, true/false, short answers questions. Attendance module allows the teacher know all the participants real time. Grade module allows teachers to accumulate score obtained by each student through exams, quiz and a variety of assignment.
1.3 Learning Graph Theory in Computer Science
The graph theory is one of the many areas of mathematics. Its origin began with the problem of the Koinsberg bridge [13]. It was first introduced by the Swiss mathematician, Leonardo Euler, who studied the Koinsberg bridge problem and subsequently constructed a structure to solve the problem called Eulerian graph [14]. The graph algorithms in computer applications were derived from a graph concept. Computer algorithms were used to solve graph problems.
The algorithms include [15]:
Shortest path algorithm in a network;
Finding graph planarity;
Finding minimum spanning tree;
Algorithms to find adjacency matrices;
Algorithms to find the connectedness;
Algorithms to find the cycles in a graph;
Algorithms for searching an element in a data structure (DFS, BFS).
These algorithms topics were explained using the graph theory in LMS environment with the help of images and definitions.
1.4 Graph Theory with LMS
[image:2.612.93.292.446.537.2]draw the process and objects as a form of visualization, which is very influential in learning the graph theory and understanding algorithms [16], rendering the grasping of the subject matter to be easier [3]. At the university, most teaching methods are conducted in the conventional system, meaning the learning process is still primarily face-to-face between students and a teacher. This study used the blended learning method that combined the face-to-face classroom method with computer-mediated activities to form an integrated instructional approach with the help of LMS.
2. METHODS
This study was designed as a quasi-experimental quantitative research. The participants consisted of 97 college students. They were then divided into two groups, namely the experimental group and the control group. The experimental group consisted of 48 students while the control group consisted of 49 students. The study focused on the e-learning of the graph theory via LMS as well as the effectiveness of this approach at the university level. The differences in performances between the experimental and control groups were measured.
2.1 Instrument And Data Collection
Before conducting the experiment, pre-tests in algebra, calculus, and discrete mathematics courses were conducted via in-class examinations. Post-test scores were gathered through quizzes, assignments, and examinations in the graph theory course. The assignments consisted of several tasks. Such as a task to generate illustration of algorithm, task to find shortest path and task to online test, task to learn the differences between graph and digraph and task to solve the four cubes problem or minimum spanning tree. This task was given online and the students could discuss the task assigned for review in the Forum to solve the graph theory problem. The quizzes that were developed by the information technology teachers measured the students' understanding. Set of quizzes test consisted of online multiple choices. So the student got the score real time. All tests were written by following the standard of Satuan Acara Perkuliahan (SAP) that was implemented by the university. The study also used a questionnaire to collect other information, such as demographical data.
Data collection for the acceptance of system that was used during the process of learning graph
theory was performed using the Technology Acceptance Model (TAM) questionnaire. TAM was introduced by Davis in 1989 which was one of the models built to analyze and understand the factors that influence the acceptance of the use of computer technology in a system [17]. TAM was adapted from the Theory of Reasoned Action (TRA) developed by Ajzen and Fishbein [18], where the theory of reasoned action with the premise that a person's perception and reaction to a problem will determine the attitude and behavior of the person. The advantage of using the TAM was the ability to know the extent to which users can receive a given system. This instrument would be used to measure the level of ease of the use MOODLE as LMS, the benefits that can be given, attitude to receive and reject for the system that will be used, and a desire to continue using the system. TAM consisted of five measurements [17]. They were Intention to Use (ITU), Attitude (ATT), Perceive Ease of Use (PEOU), and Perceived Usefulness (PU). Perceived Ease of Use (PEOU) referred to the ease of use of LMS, so LMS can be easily understood and used in learning graph theory. Perceived Usefulness (PU) referred to the benefits in the use of an LMS that benefited the students who used LMS. Attitude toward Using (ATT) referred to attitudes toward the use of LMS in the form of acceptance or rejection of the use of LMS. Behavioral Intention to Use (ITU) referred to the behavior of users to continue to use the LMS in the learning process.
2.2 Data Analysis
This study compared a dependent variable (graph theory test score) between an independent variable (experimental versus control groups) of the post-test. LMS utilization in the e-learning of graph theory was analyzed in relation to the test scores of the course (graph theory). The test scores used interval data type and were categorized as parametric data. The study utilized two types of analytical methods: the mean difference and Pearson's correlation analyses. The former method employed the T-test strategy in order to determine the significant difference of scores between the experimental and control groups. On the other hand, the latter method was used to measure the degree of significance between the relationship independent and dependent variables.
3. RESULTS
calculus, and discrete mathematics. Analysis on the main hypothesis is shown in table 2.
Table 2. Post-Test Graph Theory Test Scores Comparison Between The Two Groups
Group N Mean t p-Value
Experimental 48 76.760
2.051 .043* Control 49 71.036
* significant at p < .05
[image:4.612.318.527.372.496.2]Table 2 shows that there was a significant difference in post-test graph theory test scores between experimental and control groups (p = .043). The graph theory e-learning students that constitutes the experimental group scored higher than the control group by 5.724 (t = 2.051). This result indicated that the use of LMS for graph theory e-learning was a more effective way in teaching and learning.
Table 3. Correlations Between Graph Theory Scores And Pre-Test Scores
Pre-test Scores Graph Theory Score
Algebra r = .711 p < .05 Calculus r = .704
p < .05 Discrete
Mathematics
r = .713 p < .05 Total Overall r = .820 p < .05
Pearson’s correlations between the different measures of scores that was shown in table 3, representing the linear relationship between the two main variables. Accordingly, table 3 shows the statistically significant correlations between the graph theory scores and the pre-test scores from algebra, calculus, discrete mathematics, and the overall total of algebra, calculus and discrete mathematics. Each pre-test scores had a strong, direct correlation with the graph theory scores. This could be explained by the fact that the graph theory is part of the mathematical science. A prior study has found that the graph theory has an inherent connection with discrete mathematics as well as of geometry [19].
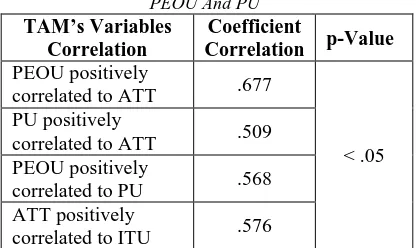
Correlations between TAM’s variables were shown in table 4. Based on the analysis using Pearson's Correlation, it could be explained that all the components of the TAM system
determined the acceptance of LMS by students in the learning process of graph theory. There was a positive correlation between ITU, ATT, PEOU, PU in LMS implementation. On this relationship, each component had a strong relationship. PEOU and PU have a positive relationship with ATT. This means that the easy to use and brings the benefits, then the attitude of students as users of the system were well received. PEOU was also positively related to PU, where perceived ease received by students in learning graph theory also brought benefits to the students themselves. Although the benefits can be felt immediately, the students also found the benefits after using LMS, such as the value of the results obtained. ATT also has a positive correlation with ITU. The students felt there was a difference in the learning process by using animated presentation and delivery of content via the LMS. From these analyses, it can be said that the students well received the learning system model that was conducted during the study.
Tabel 4. Correlation Between ITU, ATT, PEOU And PU
TAM’s Variables Correlation
Coefficient
Correlation p-Value
PEOU positively
correlated to ATT .677
< .05 PU positively
correlated to ATT .509 PEOU positively
correlated to PU .568 ATT positively
correlated to ITU .576
use of the system given in the learning process of graph theory.
Table 5. Correlation Between ITU, ATT, PEOU, PU, And GT
TAM Coefficient
Correlation p-Value
ITU–GT .379 .008* ATT–GT .199 .175 PEOU–GT .310 .032* PU–GT .228 .119
*significant at p < .05
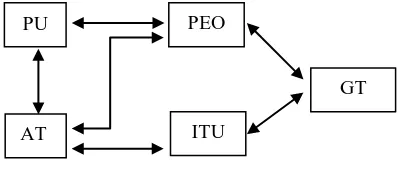
[image:5.612.91.290.315.406.2]From analyses on table 4 and 5, it can be figured a correlation diagram between components of TAM and GT below as shown in figure 2. The figure shows the direct and indirect relationships between TAM and GT.
Figure 2. Direct And Indirect Relationship Between TAM And GT
4. CONCLUSION
The result of this study concluded that students’ performance in the e-learning of graph theory through the use of LMS was significantly better than those in the conventional learning. The pre-test scores in algebra, calculus, and discrete mathematics showed no significant differences across the board, demonstrating the homogeneity among both groups' participants. LMS was able to facilitate the delivery of course materials to students by utilizing multimedia, such as advanced graphics and animated pictures. LMS provided a forum for students and lecturer to discuss and solve the graph theory problems. LMS also provided an online quizzes, that the students got score real-time. E-learning of graph theory via LMS was very effective because many facilities were provided online as compared to conventional. This study also found that TAM can be considered as a valid and reliable instrument to assess the user acceptance of a system which in this case was the application of graph theory in LMS environment on a course subject at higher education level.
REFERENCES
[1] G.S. Torrubia, C.T. Blanc, and V.G. Martínez, ”An eMathTeacher Tool for Active Learning Fleury’s Algorithm”,
International Journal Information
Technologies and Knowledge, 2, 2008, pp.
437-442.
[2] R.M. Capraro, S. Ozel, and E.Z. Yetkiner, A technology intervention using multiple
representations on mathematics, Texas A &
M University, 2005.
[3] K.A. Rahman, S.A.M. Ghazalli, and M.N. Ismail, “The Effectiveness of Learning Management System (LMS) Case Study at Open University Malaysia (OUM)”, Journal of Emerging Trends in Computing and
Information Sciences, Vol. 2, No. 2, 2010,
pp. 73-79.
[4] B. Holmes and J. Gardner, E-Learning:
Concept and Practice. Thousand Oaks, CA:
Sage Publication Ltd, 2006.
[5] J. Cross, “An Informal History of E-learning”, On the Horizon, 12, 2004, pp. 103-110.
[6] The Herridge Group Inc., “The Use of Traditional Instructional Systems Design Models for eLearning”, December 2004, retrieved December 10, 2009, from The Herridge Group: www.herridgegroup.com [7] H. Fournier, “State of the Field Report:
E-learning. Canada”, National Research Council Canada, Institute for Information Technology, 2006.
[8] M. Garg and M.K. Jindal, “EduSat: E-learning through Satellite – Reaching the Unreached”, International Journal of Recent
Trends in Engineering , 1, 2009, pp.
149-151.
[9] L.W. Anderson, Increasing Teacher
Effectiveness (2nd edition), Paris: UNESCO,
IIEP, 2004.
[10] A. Brown and J. Johnson, “Five Advantages of Using a Learning Management System, 2003, retrieved December 10, 2010 from Microburst Learning: www.microburst learning.com
[11] Moodle. Moodle Doc, 2010, retrieved January 14, 2011 from Moodle: http://docs.moodle.org/en
[12] P. Shweta and R.P. Shri, “Developing a More Effective and Flexible Learning Management System (LMS) for the Academic Institutions using Moodle”, ICAL, 2009, pp. 251-254.
GT PEO
U
ITU PU
[13] R.J. Wilson and J.J. Watkins, GRAPH an
Introductory Approach, New York: John
Willey & Sons, Inc., 1990.
[14] Shirinivas, Vetrivel, and Elango, “Aplications of Graph Theory in Computer Science: An Overview”, International Journal of Engineering Science and
Tecnology, 9, 2010, pp. 4610-4621.
[15] F. Valinejad, E. Aminifar, and S. Bakhshalizadeh, “The Impact of the Newgraph Educational Software on the Conceptual Perception of the Graph Theory”, International Conference on Science and Mathematics Education,
Malaysia, 2009, pp. 430-437.
[16] D. Tall, Advanced Mathematical Thinking, Kluwer Academic Publishers, 2002.
[17] F.D. Davis, R.P. Bagozzi, and P.R. Warshaw, “User Acceptance of Computer Technology: A Comparison of Two Theoretical Models”, Management Science, 35, 1989, pp. 982-1003.
[18] I. Ajzen and M. Fishbein, Understanding
Attitudes and Predicting Social Behavior,
Englewood Cliffs, NJ: Prentice-Hall, 1980. [19] E.W. Hart, Navigating through Discrete
Mathematics in Grades 6-12. Principles and Standards for School Mathematics