WRL
Research Report 90/5
Efficient Use of
Workstations for
Passive Monitoring of
Local Area Networks
research relevant to the design and application of high performance scientific computers. We test our ideas by designing, building, and using real systems. The systems we build are research prototypes; they are not intended to become products.
There is a second research laboratory located in Palo Alto, the Systems Research Cen-ter (SRC). Other Digital research groups are located in Paris (PRL) and in Cambridge, Massachusetts (CRL).
Our research is directed towards mainstream high-performance computer systems. Our prototypes are intended to foreshadow the future computing environments used by many Digital customers. The long-term goal of WRL is to aid and accelerate the development of high-performance uni- and multi-processors. The research projects within WRL will address various aspects of high-performance computing.
We believe that significant advances in computer systems do not come from any single technological advance. Technologies, both hardware and software, do not all advance at the same pace. System design is the art of composing systems which use each level of technology in an appropriate balance. A major advance in overall system performance will require reexamination of all aspects of the system.
We do work in the design, fabrication and packaging of hardware; language processing and scaling issues in system software design; and the exploration of new applications areas that are opening up with the advent of higher performance systems. Researchers at WRL cooperate closely and move freely among the various levels of system design. This allows us to explore a wide range of tradeoffs to meet system goals.
We publish the results of our work in a variety of journals, conferences, research reports, and technical notes. This document is a research report. Research reports are normally accounts of completed research and may include material from earlier technical notes. We use technical notes for rapid distribution of technical material; usually this represents research in progress.
Research reports and technical notes may be ordered from us. You may mail your order to:
Technical Report Distribution
DEC Western Research Laboratory, UCO-4 100 Hamilton Avenue
Palo Alto, California 94301 USA
Reports and notes may also be ordered by electronic mail. Use one of the following addresses:
Digital E-net: DECWRL::WRL-TECHREPORTS
DARPA Internet: [email protected]
CSnet: [email protected]
UUCP: decwrl!wrl-techreports
for Passive Monitoring of Local Area Networks
Jeffrey C. Mogul
Effective management of a local area network (LAN) requires not only a protocol to manage the active entities, but also a means to monitor the LAN channel. This is especially true in shared-channel LANs, such as Ethernet, where the behavior of the LAN as a whole may be impractical to deduce from the states of the individual hosts. Passive monitoring can be done using either a dedicated system or a general-purpose system. Dedicated monitors have been favored for several reasons, but recent workstations, when care-fully programmed, are sufficiently powerful to serve this function. Using a workstation offers high-performance graphics and a more flexible environ-ment for collecting and presenting LAN behavior.
This research report is a preprint of a paper to appear in the Proceedings of the ACM SIGCOMM ’90 Symposium on Communications Architectures and Protocols.
Now that computer networking is nearly ubiquitous, network management is a critical problem. Computer networks are complex, asynchronous, heterogeneous systems, and so are both failure-prone and extremely hard to diagnose. Even when operating correctly, they are hard to understand. Because good network protocols are robust in the face of partial failures, problems in a network may manifest themselves not as overt failures, but as performance degradations.
Effective management of a local area network (LAN) requires not only a protocol to manage the active entities, but also a means to monitor the LAN channel. This is especially true in shared-channel LANs, such as Ethernet, where the behavior of the LAN as a whole may be im-practical to deduce from the states of the individual hosts. The gross behavior of a network is a complex function of the behavior of the individual components, including both active com-ponents (such as end-hosts, routers, and bridges) and passive comcom-ponents (primarily, the access method of the data link itself). Only by monitoring the channel itself can one successfully measure channel loading and traffic patterns, or detect incorrect behavior of active nodes.
1 Timing relationships, in particular, can be measured precisely only by non-intrusive means .
Several vendors now offer dedicated systems for passive monitoring of popular LANs. (Such systems include, among others, the Network General ‘‘Sniffer’’, the Novell ‘‘LANtern’’, the Hewlett-Packard HP4971S, and the LANWatch program from FTP Software). A dedicated monitor can be designed using special-purpose hardware and software to provide the requisite performance for monitoring thousands of events per second. On the other hand, special-purpose solutions tend to be expensive (because the market is smaller) and inflexible. Most of the exist-ing products are based on IBM-PC technology; while this allows the use of some additional software, it is hard to integrate these monitors with other tools.
1.1. Why use a workstation?
Computer workstations have been riding a steep curve of rising performance at approximately constant cost. Unlike special-purpose hardware, workstations benefit from a larger market, which drives performance up and price down. Unlike dedicated monitoring software, worksta-tions provide integrated software environments that support multiple concurrent tasks, easy inter-connection of tools, and powerful user interfaces. Particularly, workstations have high-resolution, high-performance graphics systems, allowing extremely effective presentation of complex information. Workstations also provide a convenient program development environ-ment, which in turn encourages the development of special-purpose software tools that might otherwise be too hard to obtain.
Finally, workstations are ubiquitous, unlike dedicated monitoring systems. Almost by defini-tion one is assured of the availability of a workstadefini-tion on a LAN; rather than having to locate, move, and install a dedicated monitor when trouble strikes, or perhaps even wait for one to be
1Future LAN technologies, such as those with mesh organizations [17], may not permit non-intrusive monitoring;
purchased, a system manager can use any available workstation for LAN monitoring, if the ap-propriate software exists.
Vendors of high-performance workstations are beginning to provide network monitoring software. Although dedicated monitors for the moment may provide the broadest set of tools, soon workstations will overtake the dedicated systems. The price/performance ratio already favors workstations, and the economics of marketing suggests that small vendors will have an easier time selling inexpensive software than expensive dedicated systems.
This paper describes the design of several network monitoring programs for use on worksta-tions. We are particularly concerned with techniques to achieve good performance and accurate results. We do not mean to compare our performance and accuracy to that of other systems, but rather to show how we obtained the best possible results in our own framework. We also present some preliminary results of research into efficient ways of displaying network connectivity, based on recent work in graph-drawing algorithms.
1.2. Previous work
Use of workstations for network monitoring goes back to the first personal computer, the Xerox Alto [19]. At least three programs were written for the Alto to monitor the Experimental Ethernet [14]:
•EtherWatch: was a standalone program that displayed Ethernet packets in octal, as they were received. A filter could be set to select only those packets matching a particular value at a specified offset, or those to or from a specific host.
•PeekPup: was specific to the Pup protocol family [2]. It was not a real-time program; the user would specify a host address, and the program would buffer the last 200 packets to or from that host. When the user believed that a useful trace had been gathered, the program was terminated and the trace written to a text file, con-taining the Pup packet header fields in a human-readable format, Because this program, unlike EtherWatch, did not display the packets as received, it was able to capture most of the relevant traffic.
•Etherload: displayed a bar whose height represented the current average load on the Ethernet; the averaging period could be selected by the user.
Only the last of these programs made serious use of the graphics capability of the workstation. Although figures in a paper on Ethernet performance [16] shows graphs of network load versus time, a histogram of packet sizes, and a source-destination traffic matrix, apparently these were never implemented as real-time displays.
Although the programs listed above ran on workstation hardware, none ran as a user-level
process under a multitasking operating system. The rise of Unix -based workstations gave birth to several lineages of passive monitoring programs.
One line started with the etherfind program [18], a packet-tracing program that prints the headers of packets as they go by on the network. Etherfind allows the user to select packets based on a variety of predicates. Etherfind was also the initial basis for tcpdump [11]; the two programs have since evolved while cross-fertilizing each other.
The output of a packet-tracing program may be filtered through an analysis program. Such a program could produce graphical output; while this technique may be too inefficient for real-time displays, it works nicely for off-line processing. For example, see the plots of TCP se-quence numbers versus time in [10]. One can also apply artificial-intelligence techniques to analysis of traces [9].
Another approach to passive monitoring is to gather statistical information instead of packet traces. This is the goal of statspy [3, 4], which maintains a variety of ‘‘statistical objects’’ specified by use of a special configuration language. For example, one could collect counts describing a matrix of source and destination hosts, and the traffic between communicating pairs.
Combining the collection of statistical information with a graphical display provides the func-tion of the Alto EtherLoad program. For example, the traffic [18] program displays bar graphs representing the current Ethernet load, optionally broken down by host or packet type, and fil-tered according to a limited set of criteria.
2. Tapping the network
The key to the flexibility of workstation-based network monitoring is to be able to write ap-plications as user code, rather than as part of the operating system kernel. To support this, the operating system must provide a powerful, efficient mechanism by which user programs can see packets from the network. (Other researchers [20] have instead implemented counters in the kernel for specific events; this can be quite efficient but is not flexible enough to support most applications.)
Such a ‘‘wire-tapping’’ facility should provide:
•‘‘Promiscuous-mode’’ support: Normally, a network interface provides only packets destined to its own host so as not to overload the workstation with useless packet interrupts. Many LAN interfaces, however, can be put into a ‘‘promiscuous mode’’ in which every packet on the network is passed to the host software. Since this is not the normal mode, the kernel must provide a means for a monitoring program to select it.
•Demultiplexing: Workstations, unlike dedicated or PC-based systems, are mul-titasking; one might want to run several monitoring applications at once. The access mechanism should support this by efficiently demultiplexing packets, based on filter predicates, to the appropriate applications [15].
•High-bandwidth transfers: A monitor should be able to keep up with the peak traffic rates on the network. Usually, monitoring applications are concerned with the packet headers, rather than the entire packet contents, so it is most important to provide the headers at high bandwidth. This can be done by allowing the applica-tion to request only a prefix of the packets, thus allocating the available processing bandwidth to the useful information. It is also important to provide the fastest pos-sible channel from kernel space to user space.
•Buffering: A workstation is not a real-time system; there will be times when pack-ets arrive and the monitoring application is not immediately scheduled to run. To avoid lost packets, the kernel must queue them. While the capacity of the system over periods of seconds or more is determined by the average rate at which it is able to empty the queue, the system’s capacity for handling brief bursts of packets is determined solely by the effective queue size. This in turn depends on the correct management of memory resources.
•Device independence: Modern operating systems exist to abstract away the ir-relevant details of the underlying hardware without hiding too much function or per-formance. Network monitoring is no different; the application writer should not be concerned with which network interface chipset is in use, and monitoring applica-tions should be portable between hardware implementaapplica-tions.
2.1. The packet filter
Our choice of access mechanism was driven by these criteria (and by our ability to modify the mechanism to meet them). We use a Unix-based system incorporating the ‘‘packet filter’’ [15], first developed at Carnegie-Mellon University in 1980. This is not the only possible mechanism; for example, Sun Microsystems Inc. provides in their operating system the ‘‘Network Interface Tap’’ (NIT) [18]. The NIT is similar in many ways to the packet filter (at one point, they had source code in common, although the programming interfaces of the two mechanisms have diverged considerably).
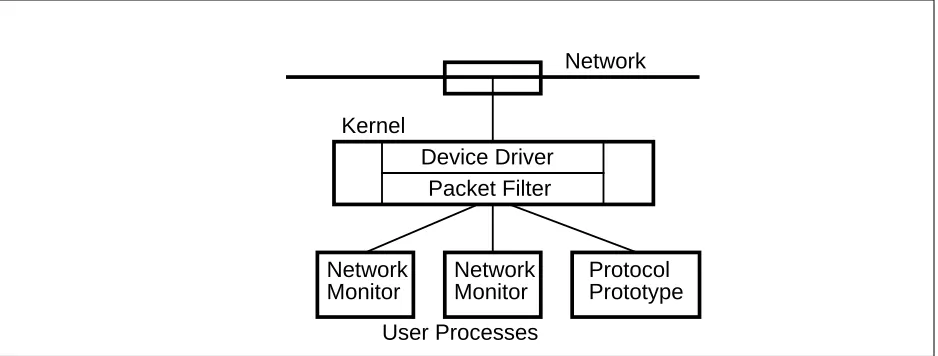
Figure 1 shows how the packet filter is related to other parts of the system. Packets received from the network are passed through the packet filter and distributed to user processes; code to implement network monitoring applications lives in each process.
The packet filter described in [15] had evolved for use as a protocol prototyping facility, and had to be modified to support network monitoring. It already provided filtering, demultiplexing, device independence, and most of the necessary support for high-performance monitoring. Sub-sequent modifications (all invoked by the application using ioctl system calls) include:
Device Driver Packet Filter Kernel
Network
Protocol Prototype
User Processes Network Monitor Network
[image:9.612.91.560.72.250.2]Monitor
Figure 1: Relationship between packet filter and other system components
Putting a LAN interface into promiscuous mode immediately exposes the worksta-tion to a potentially overwhelming load of interrupts. Since we do not want to do this unless a monitoring application is actually running, the packet filter keeps track of how many applications have requested receipt of promiscuously-received pack-ets, and puts the interface into promiscuous mode only while at least one such ap-plication is running.
•Packet truncation: In network monitoring, unlike protocol implementation, ap-plications usually are concerned only with the first few bytes of each packet. Such applications can specify a ‘‘truncation’’ length; packets longer than this will be trun-cated before delivery to the application.
•Queue-length control: Different kinds of applications have different requirements for burst-handling. If one is tracing a connection to find a protocol bug, or trying to measure the precise load on a heavily-loaded network, it is important to avoid drop-ping packets. In other cases, occasional dropped packets may be harmless. Since longer queues imply larger memory requirements, it is important for the application to be able to balance these considerations and choose the most appropriate queue length. The packet filter allows each application to select its queue length, up to an arbitrary limit of 255 packets; the system manager may restrict unprivileged users to lower limits, to avoid overcommitting memory resources.
•Precise information: A packet filter application can request that each packet is preceded by a header record that contains the length of the packet (before trun-cation), the number of packets missed by the interface (because no buffer was avail-able), the number dropped by the kernel (because the queue was full), flags indicat-ing if the packet was received as a broadcast, multicast, or promiscuously; and the time that the packet was received by the kernel. This last field is most interesting, because (since user processes may be suspended for fairly long intervals) it is other-wise impossible to attach accurate timestamps to the packets. Without good time-stamps, accurate calculation of LAN loading is impossible.
2.2. Performance issues
The performance of a network monitor is most simply defined as its ability to not lose packets, while still providing sufficient CPU cycles to process, store, or visualize the network traffic. Packet-handling ability can be characterized by several measures:
•The longest loss-free burst length (number of back-to-back packets) •The loss-free packet reception rate
•The maximum packet reception rate
The situation is complicated because all of these measures can be either bandwidth-limited or packet-rate limited. For example, a given system might be able to handle more packets per burst for longer packets than for shorter ones (because with short packets, the time between arrivals is shorter); the same system might be able to handle more short packets per second than long ones (because less data-copying is required for short packets). Although one can often assume a bimodal distribution of packet sizes on a LAN, a monitoring system should be able to handle anomalous situations: both high bandwidths and high packet rates.
The maximum loss-free packet reception rate is usually lower than the maximum packet reception rate, because most LANs carry packets of varying size. A system is most vulnerable to losing a packet following the reception of a burst of short ones, since it might take a while to reenable the LAN interface. Because some applications do not need to see every packet in order to be useful, one might expect that once the network load exceeds a monitoring system’s max-imum loss-free rate, it still continues to function. This is not easy to guarantee, since the system could find itself spending all its time processing network interrupts, leaving no time for the ap-plication; the useful packet rate drops to zero in this case. The easiest way out of this trap is a fast CPU; otherwise, clever programming might provide some fairness.
The packet reception rate is determined by several bottlenecks: interrupt handling, context switching (between user processes, but also between kernel and user contexts as the result of system calls), and data copying (to move packet data from kernel space to user space).
All these bottlenecks are of course amenable to careful software implementation, but several tricks serve to redefine the problems in such a way as to significantly reduce them. First, the use of packet truncation can reduce the amount of data copying by an order of magnitude or more, since, usually, the bulk of the bytes transmitted over a LAN are data bytes. Second, the use of kernel-level filtering can reduce the number of packets delivered to an application that is only interested in a subset of the traffic.
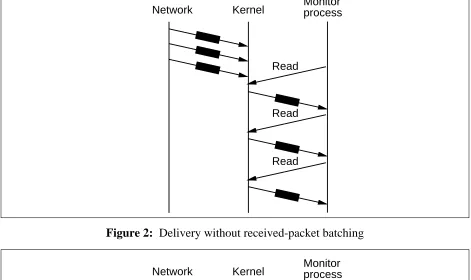
The same trick can be applied to the software interface between the operating system kernel and the user process. The packet filter driver provides the option of reading queued packets in ‘‘batches’’: if more than one packet is queued in the kernel, and the user’s buffer is large enough, all the queued packets are copied into the buffer in one system call. This eliminates the overhead of N-1 system calls when N packets are queued. It actually performs better as the load increases; as the queue gets closer to being full, the overhead per packet decreases. Figure 2 depicts per-packet overheads without batching; figure 3 shows how these are reduced when batching is used.
Network Kernel Monitorprocess
Read
Read
[image:11.612.89.560.183.463.2]Read
Figure 2: Delivery without received-packet batching
Network Kernel Monitorprocess
[image:11.612.90.558.435.575.2]Read
Figure 3: Delivery with received-packet batching
If the hardware is fast enough, the maximum loss-free burst length depends mostly upon the amount of the kernel-space buffering available. As long as the buffer does not fill, it is not necessary to stop processing interrupts and schedule the application process in order to avoid discarding packets. Since applications can run arbitrarily slowly, once the kernel queue fills it is much harder to handle the rest of a burst.
parallel’’ with being filled at the other from the LAN, if there are spare CPU cycles available after processing interrupts. Since the data-copying part of the system call interface is coded so as not to lock out insertion of new queue items (the critical sections that require locking can be extremely short), the packet filter can handle a burst of packets up to the size of the user-space buffer.
When packet truncation is used, a lot of packet headers can be copied into a user-space buffer of moderate size (one thousand Ethernet headers, with associated overhead information, require only 36K bytes of buffer). With a queue limited to 32 entries, we have measured as many as 58 packets received in one loss-free batch; potentially, an entire burst of thousands of packets could be received in one batch. Of course, if the application is busy processing one set of packets when another large burst arrives, the fill/drain parallelism may not be available in time to avoid lost packets.
3. Efficient and correct calculation of network loading
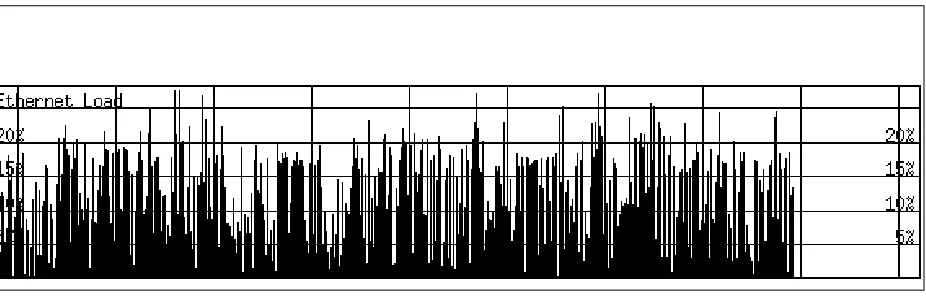
[image:12.612.60.523.384.533.2]One of the simplest and most useful indications of the performance of a multi-access network is its ‘‘load average.’’ This is the percentage of the time that the channel is in use, over a suitably chosen period of time. (If this sampling interval is too short, the apparent load will often be 100%, since during the transmission of a packet the channel is continuously in use.) Figure 4 plots several minutes of load averages on a typical Ethernet; each tick represents a one-second averaging interval (horizontal scale divisions are 60 seconds apart).
Figure 4: Plot of Ethernet load versus time
On its face, this is not a difficult problem: to calculate the load average over a particular inter-val, one simply measures the number and lengths of packets that are on the channel during the interval, calculates the total channel occupancy, and divides that by the interval length (see figure 5). It is not as simple as that.
3.1. Sources of Inaccuracy
Inaccuracy in this calculation can arise from several sources intrinsic to the problem: •‘‘Invisible’’ channel occupancy: On contention-access LANs such as Ethernet,
Per-Packet Overhead = 192 bits 96 bits for Inter-frame spacing 64 bits for Preamble
32 bits for Frame Check Sequence
7
bit-rate = 10 bits/sec.
Duration of packet = (packet bits + Overhead)/bit-rate
Figure 5: Computation of Ethernet load
not is the time spent resolving collisions. Packet fragments resulting from collisions or other errors may, in principle, be counted just as are normal packets; in practice, many Ethernet interfaces hide these packet fragments from the host software. This is one disadvantage of using a workstation: the hardware is not always designed to support network monitoring.
When a contention-access LAN is lightly loaded, invisible packets do not often oc-cur. Inaccuracy is worst when the load (and hence the contention) is high; unfor-tunately, this is the situation where accurate information is most necessary.
•Lost packets: Any packets dropped by the system due to queue overflow are clearly not going to be counted accurately. The best solution is to engineer a monitoring system capable of handling the full load. Failing that, it is possible to estimate the unmeasured load based on the number of packets dropped, and the number of bytes they contained (the packet filter provides the former but not the latter).
Inaccuracy can also arise from a poor choice of algorithm:
•Inaccurate timestamping: In a real-time system, one can reliably estimate the time that passes from the instant that the packet leaves the channel to the instant that a network monitoring process sees the packet. Not so in a workstation, which is a time-sharing system; since the application process runs at the whim of the scheduler, it may be seconds between the reception of a packet and its processing by the ap-plication. Again, the effect is worse with increasing load: if the application is doing the timestamping, and it doesn’t run for a while because the kernel is handling lots of interrupts, packets received over several sampling intervals would all be assigned to one interval.
This means that packets must be timestamped by the kernel, at a consistent point during the interrupt service routine; otherwise, it is impossible to reliably assign a packet to the correct sampling interval.
averaging interval, the apparent average may vary independently of the underlying load. (That is, as the interval shrinks both the peak values and the variance get larger.) It may also be impossible to avoid involuntary suspensions, and thus un-measured time intervals, between checking the clock and reading the counters.
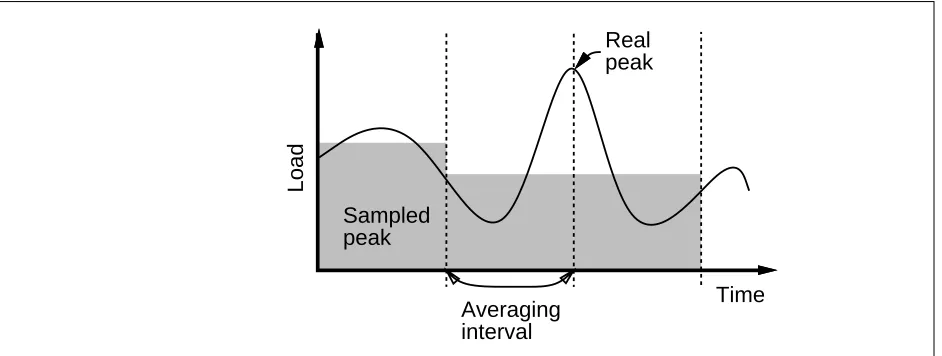
Arbitrary choice of the divisions between intervals also makes it nearly impossible to calculate true peak load averages; the packets making up a peak may be split into two intervals, thus hiding the existence of a peak (see figure 6). The only way to detect true peaks is to calculate a running load average that is valid at all instants, rather than calculating the load average at fixed intervals. The same argument ap-plies to the calculation of the instantaneous packet rate, and the instantaneous rate at which bytes are being transferred.
The algorithm we developed was motivated, in particular, by these two problems.
Real peak
Averaging interval Sampled
peak
Time
[image:14.612.55.526.244.422.2]Load
Figure 6: Poor choice of interval hides actual peak
3.2. An accurate algorithm
In this section we describe the ‘‘loadring’’ algorithm, so called because it uses a ring buffer to maintain recent history of network events. This algorithm depends upon kernel-provided stamps on each packet; it solves the ‘‘choice of sample interval’’ problem by using these time-stamps to mark interval boundaries, and by using the stored history to maintain a correct running average. The algorithm also accurately computes instantaneous packet rates and bytes-transferred rates.
The algorithm is most easily understood as maintaining invariants on several data structures. The primary data structure is a ring buffer of packet information records: each record contains the timestamp and length of a packet. The records are contained in the ring buffer in the order they are received.
The ring buffer contains only those records about packets received during the preceding T seconds, where T is the averaging interval. The algorithm preserves this invariant whenever a packet record R is added to the ring, by removing all packet records with timestamps more than
T seconds older than that of record R. Because the time base comes from the timestamps on
and rate values may be calculated even though the application might be suspended for much longer than T seconds.
The other data structure is a set of counters in addition to the ring buffer. The invariant on these counters is that they reflect the total number of bytes and packets currently represented in the ring buffer. Each time a packet is added to the ring, the algorithm increments the counters correspondingly; each time a packet is removed from the ring, it decrements the counters.
The counters accurately keep track of the load during the averaging interval. Thus, the counters themselves may be sampled at more or less arbitrary intervals without skewing the results. If one wants to track actual peak rates, it is simple enough to maintain a second set of values that are updated whenever a counter surpasses the previous maximum.
If one wants to simultaneously maintain load averages over several different averaging periods, several periods may be represented in a single ring buffer. In addition to the usual two pointers into the buffer (one for the beginning and one for the end), there would N-1 pointers representing additional intervals. An additional set of counters would be associated with each of these pointers; as packets age, they cross the boundaries represented by these pointers and their values are subtracted from the counter for the smaller interval. This extension requires storage proportional to the longest interval, and processing proportional to the number of intervals (al-though certain overheads may be amortizable).
3.3. Subtle issues
Although the algorithm as described works properly when packets arrive at a reasonable rate, care must be taken to ensure that it continues to work when the rate is either too high or too low.
The ring buffer must contain sufficient slots to hold the maximum number of packets that could possibly be received in the averaging period. An Ethernet can carry up to 14880 packets per second, under extremely contrived conditions. This should be increased slightly to account for the resolution of the timestamps (if the resolution is, say, 10 milliseconds, then up to 1.01 real seconds could pass between two timestamps separated by 1.00 apparent seconds).
If packets arrive very infrequently, there may not be enough ‘‘addition’’ events to cause the removal of stale entries from the ring buffer; a packet will persist in the ring until at least the arrival of the following packet. If packets are arriving less often than the counters are being sampled, the counters would erroneously indicate a non-zero load during those intervals when no packets arrive at all. To prevent this, one must check the timestamps of entries in the ring, and the discard stale entries, whenever the counters are read.
3.4. Performance
The loadring algorithm takes more CPU time and more memory than an algorithm that simply maintains a counter which is cleared at the start of each interval. The memory cost is easy to quantify: at 12 bytes per entry, 178560 bytes are required for a one-second averaging interval. This is not onerous for a modern workstation.
If, however, one wants to break the load down by host, maintaining a separate ring buffer for each host, then the memory requirements would be excessive. To avoid this, we developed the ‘‘augmented loadring’’ algorithm. Only one ring buffer is maintained, but a separate set of counters is maintained for each host; the appropriate counters are updated as the packet records are added and removed from the ring buffer. Because packets must be matched with counters at removal time, the ring buffer entries must contain an identification field, increasing their size to 16 bytes per entry.
Processing costs depend on CPU speed, and somewhat on clever coding and compiler op-timization. We profiled the routine that updates the ring buffer, compiled for the DECStation 5000/200 (MIPS R3000). The average invocation took 120 instructions, and about 20
2
usec./packet . The minimum inter-arrival time on an Ethernet is 67 usec., but the other process-ing required averages about 104 usec./packet, so this system cannot keep up with the maximum packet rate. The load-ring algorithm is not the primary bottleneck; even with packet-batching, the system call overhead still dominates.
Fortunately, it is rare to find an Ethernet loaded entirely with tiny packets; since the loadring algorithm has fixed overhead per packet, it actually does quite well in practice. Measuring an Ethernet with synthetic loads, we have observed loads as high as 86.5% and data rates as high as 8.3 Mbits/sec. without any lost packets. With the loss of only a very few packets, we have measured packet rates of about 2000 packets/sec., and at somewhat higher loss rates, 4850 packets/sec.
3.5. Visualization
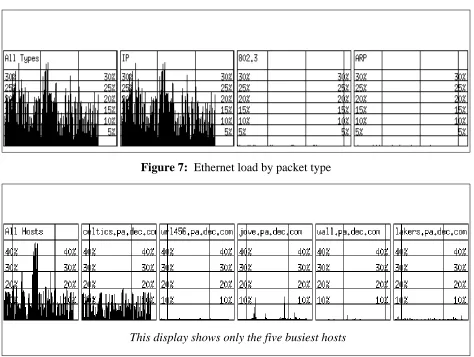
It requires relatively little additional CPU time to graph the load, in real time, on the worksta-tion screen. Figure 4 shows one possible display, plotting aggregate load versus time. By using the augmented load ring algorithm and splitting the packets according to some criterion (such as packet type or host address), one can produce graphs such as in Figures 7 and 8. Further, by using the filtering function of the packet filter, one can efficiently restrict the packet stream to graph only certain types of traffic, such as NFS or routing protocol upates.
2This measurement applies to the non-augmented loadring algorithm; the augmented algorithm requires 207
Figure 7: Ethernet load by packet type
This display shows only the five busiest hosts
Figure 8: Ethernet load by source host
4. Automatic displays of traffic patterns
One interesting application for a network monitor is to display the traffic patterns on a LAN: which hosts are communicating with which, and how vigorously. This information can be useful in debugging certain problems (which client is reading lots of bytes from a file server? Which server is this host bootloading from?). It can also help in capacity planning and network con-figuration.
4.1. Collecting a traffic matrix
The first step in displaying traffic patterns is to collect the data. The augmented loadring algorithm is a good start; we use it to maintain load-average counters for each pair of com-municating hosts. One difficulty is the choice of a data structure to hold all these counters; on a large LAN, where there may be several thousand hosts, there are several million pairs of hosts; representing this in a two-dimensional array would require a lot of memory.
propor-tional to the square. We maintain the pair-records as entries in a hash table, to allow rapid access to specific entries.
Because host addresses can be quite bulky (48 bits for Ethernet hosts; potentially longer for ISO protocols) they are inconvenient for use as hash-table keys. Instead, we use a secondary hash table to map bulky host addresses into a compact set of integers. Each source-destination pair can then be represented as a 32-bit value made up of two 16-bit host identification integers, allowing up to 65535 hosts on a LAN. We can then hash on this 32-bit value. It is important that the hash function yields different values for the two combinations of a pair of host addresses, or else we will almost guarantee a 50% hash collision rate (most communication being bidirec-tional).
Each host is described by a record that contains its address, its compact identifier, and a pair of flags indicating if it has ever been seen as a source or destination. Each pair is described by a record pointing to the two hosts involved and containing a counter maintained by the loadring algorithm. From each host record starts a linked list of all the pairs for which that host is the source host, and a list of the pairs for which the host is the destination. Thus, it is easy to enumerate all the hosts that are sources (using the flag bits), and also easy to enumerate all the peers of a particular host (using the linked lists).
This algorithm takes about 329 instructions, and about 69 usec. per packet processed. It also requires 16 bytes of storage per active host, 52 bytes per communicating pair, and storage for the loadring buffer and several hash tables. Neither the processing nor the memory requirements are particularly severe.
4.2. Automatic graph layout
Once the traffic data is available, the next problem is how to display it. This is an open ques-tion; it is hard to say if any single depiction could be useful in all situations.
One possibility is to display the matrix as a two-dimensional array (see figure 9). Each host is associated with a row and a column; at each intersection, a pixel is plotted indicating the level of traffic between the corresponding source and destination. One approach is to use a monochrome pixel, set if there is any traffic at all between the hosts; for an example, see [16]. We have explored using color to indicate the relative traffic rates; ‘‘hot’’ colors (such as red) mean busier conversations. One might also vary the size of the pixel with increasing traffic.
The array approach has the advantage of simplicity and efficiency; it also reveals popular sources and destinations through the obvious concentrations of pixels on certain lines. However, it fails to reveal certain interesting patterns. It also is hard to see which specific hosts are in-volved; when more than about 100 hosts are displayed, even the largest workstation screen lacks the resolution to tag the rows and columns with host names or addresses.
Figure 9: Traffic matrix on an Ethernet
The question then becomes how best to lay out the graph in two dimensions. We want to do this in software, not by hand, so that the structure of the traffic patterns is revealed to the user. This is an open question in graph theory; not only is it hard to choose a good criterion for judg-ing the layout, but in many cases the resultjudg-ing problem is NP-complete or NP-hard [7]. Since the graphs generated by traffic analysis are cyclic and non-planar, they are even less amenable to layout than simpler classes of graphs that arise in other applications.
The method does quite well at extracting symmetries from a graph; for example, if eight nodes are connected as a hypercube of degree 3, the resulting layout is the projection of a cube onto two dimensions----even though the algorithm knows nothing about projections from 3-space. The algorithm works less well when the graph contains little symmetry, or if it contains more than a few dozen nodes.
Real LANs, of course, contain hundreds of nodes, and often involve asymmetrical traffic pat-terns. One common pattern arises from the client-server model: a few hosts are servers, and each communicates with a large cluster of clients. Clients tend to communicate with a small set of servers, and few other hosts. The basic method tends to obscure this structure; we are exploring modified edge-weighting heuristics that seem to reveal it. For example, if an the edge weight is multiplied by the degrees of the two incident nodes, then servers (high-degree nodes) are forced further apart from each other. If, however, the LAN is being used for symmetrical traffic, such as a distributed algorithm involving many hosts, the unmodified algorithm may be satisfactory.
The basic algorithm also fails when faced with a disjoint graph; this is easily solved by ar-bitrarily assigning a carefully chosen distance to nodes between which no path exists. This is a significant advantage of the method over the two-dimensional traffic matrix, which is not good for discovering disjoint (or nearly disjoint) communities of hosts.
We are also exploring a variety of techniques to improve the running time and convergence of the solution algorithm. Newton’s method fails to converge in some cases, oscillating between two equally good local minima. Even if it converges, it may find a placement nowhere near the global optimum.
Finally, computing convergence can be quite costly: each time a node is moved, O(N) steps are required to find the new position and recompute the energy imbalance. Since moving a node can worsen the imbalance, one may have to move each of the N nodes more than once. (In fact, one can get into infinite loops as the system revisits a set of nodes in a fixed order.)
We are experimenting with various heuristics which ensure convergence, at the expense of perhaps finding poorer solutions. We have applied a caching paradigm to reduce the amount of recomputation necessary at each step. We are exploring various ways to decide which nodes are unlikely to enter a low-energy state, which allows us to ignore them and solve the rest of the system as best as possible. We are also exploring the use of simulated-annealing techniques to avoid getting stuck in local minima, and hierarchical decomposition techniques to make use of easily-extracted structural information.
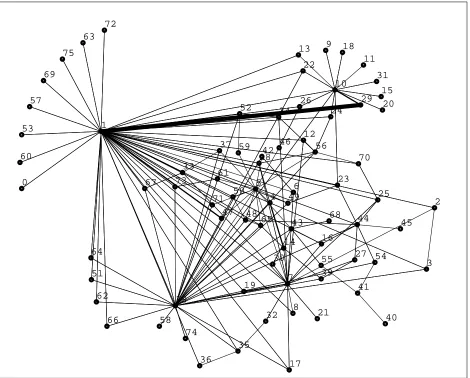
Our efforts so far have yielded a program that can produce reasonably informative pictures from the traffic on a LAN with about 75 hosts, and compute the placement with about five seconds of CPU time (see figure 10; this is the same data as plotted in figure 9). If the display needs to be updated less than once every ten seconds, it should be possible to recompute the placement sufficiently often (and it should not be necessary to recompute the placement on every update). We also believe that it will help to start each round with the placement from the pre-vious round (we now start with a random placement), although we have not tried this yet.
both routers and networks are represented by nodes, and the links represent interfaces). Since the method works even if some of the nodes are given fixed positions, a user can place some of the routers on the display (say, at geographically meaningful positions) and let the system place the others. 0 1 2 3 4 5 6 7 8 9 10 11 12 13 22 23 24 33 34 35 26 37 52 71 72 49 65 75 73 69 67 66 48 19 28 70 64 63 62 60 47 57 16 50 53 51 17 36 29 25 44 38 14 42 27 32 30 21 31 20 18 15 56 39 43 46 74 54 58 40 41 68 55 45 59 61
Figure 10: Automatic layout of traffic flow on an Ethernet
5. Summary
Workstations are powerful tools for network monitoring, because they combine fast CPUs, large memories, high-performance graphics, and sophisticated operating systems. With some care applied to the design of an access mechanism allowing normal programs promiscuous ac-cess to the network, a modern workstation can proac-cess packets fast enough to support most monitoring applications.
speed; general-purpose systems are getting faster so rapidly that it no longer makes sense to be locked in to a special-purpose system.
We have looked especially at the problem of calculating the load on multi-access networks such as Ethernet. A relatively inexpensive algorithm is capable of accurately calculating the load even in a non-real-time environment, and is easily extended to break down the load by packet type, host, or host-pair.
We have also explored the problem of automatically displaying the traffic patterns on a LAN; a method exists that extracts quite a lot of structure from a complicated network, yet can be computed in a reasonable amount of time. Additional work along these lines should reduce cal-culation costs and may improve the quality of the display.
6. Acknowledgements
David Boggs and Bill Nowicki deserve thanks for their help in recalling some of the lost early history of network monitoring. Dan Kolkowitz provided access to a Sun workstation and helped to demonstrate Sun’s monitoring software. Diane Hernek, for a summer intern project, dis-covered the spring-based graph-layout method in the literature, and did the initial implemen-tation. Joel Bartlett provided the ezx software that made it possible to produce displays like figure 9 after 20 minutes of ‘‘programming’’ (workstations are flexible!). Glenn Trewitt, Kraig Meyer, and Bill Hamburgen provided helpful suggestions on drafts of this paper.
7. References
[1] Andreas Bechtolsheim, Forest Baskett, and Vaughn Pratt. The SUN workstation
architecture. Technical Report 229, Computer Systems Laboratory, Departments of Computer
Science and Electrical Engineering, Stanford University, March, 1982.
[2] David Boggs, John Shoch, Edward Taft, Robert Metcalfe. Pup: An Internetwork
Architecture. Technical Report CSL-79-10, Xerox Palo Alto Research Center, July, 1979.
[3] Robert Braden. A Pseudo-Machine for Packet Monitoring and Statistics. In Proc.
COMM ’88 Symposium on Communications Architectures and Protocols, pages 200-209.
SIG-COMM, Stanford, CA, August, 1988.
[4] Robert T. Braden and Annette L. DeSchon. NNStat: Internet Statistics Collection
Pack-age -- Introduction and User Guide Release 2.3 edition, USC / Information Sciences Institute,
Marina del Rey, CA, 1989.
[5] David R. Cheriton. The V Kernel: A software base for distributed systems. IEEE
Software 1(2):19-42, April, 1984.
[6] Peter Eades. A heuristic for graph drawing. Congressus Numerantium 42:149-160, 1984.
[7] C. Esposito. Graph Graphics: Theory and Practice. Comput. Math. Applic. 15(4):247-253, 1988.
[9] Bruce L. Hitson. Knowledge-Based Monitoring and Control: An Approach to Under-standing the Behavior of TCP/IP Network Protocols. In Proc. SIGCOMM ’88 Symposium on
Communications Architectures and Protocols, pages 210-221. Stanford, CA, August, 1988.
[10] Van Jacobson. Congestion Avoidance and Control. In Proc. SIGCOMM ’88 Symposium
on Communications Architectures and Protocols, pages 314-329. Stanford, CA, August, 1988.
[11] Van Jacobson, Craig Leres, and Steve McCanne. tcpdump (manual page) Lawrence Berkeley Laboratory, Berkeley, CA, 1988.
[12] Tomihisa Kamada and Satoru Kawai. An Algorithm for Drawing General Undirected Graphs. Information Processing Letters 31:7-15, 1989.
[13] Gerry Kane. MIPS R2000 RISC Architecture. Prentice-Hall, Englewood Cliffs, NJ, 1987.
[14] Robert M. Metcalfe and David R. Boggs. Ethernet: Distributed Packet Switching for Local Computer Networks. Communications of the ACM 19(7):395-404, July, 1976.
[15] Jeffrey C. Mogul, Richard F. Rashid, Michael J. Accetta. The Packet Filter: An Efficient Mechanism for User-Level Network Code. In Proc. 11th Symposium on Operating Systems
Principles, pages 39-51. Austin, Texas, November, 1987.
[16] John F. Schoch and Jon A. Hupp. Measured Performance of an Ethernet Local Network.
Communications of the ACM 23(12):711-721, December, 1980.
[17] Michael D. Schroeder, Andrew D. Birrell, Michael Burrows, Hal Murray, Roger M. Needham, Thomas L. Rodeheffer, Edwin H. Satterthwaite, and Charles P. Thacker.
Autonet: a High-speed, Self-configuring Local Area Network Using Point-to-point Links.
Research Report 59, Digital Equipment Corporation Systems Research Center, April, 1990.
[18] SunOS Reference Manual Revision A edition, Sun Microsystems, Inc., Mountain View,
CA, 1988. Part #800-1751-10.
[19] C. P. Thacker, E. M. McCreight, B. W. Lampson, R. F. Sproull, and D. R. Boggs. Alto: A personal computer. In D. P. Siewiorek, C. G. Bell, and A. Newell (editor), Computer
Struc-tures: Principles and Examples, pages 549-572. McGraw-Hill, 1982. Also CSL-79-11, Xerox
Palo Alto Research Center.
[20] Songnian Zhou. EtherTap. Source code. 1989
Unix is a registered trademark of AT&T.
WRL Research Reports
‘‘Titan System Manual.’’ ‘‘MultiTitan: Four Architecture Papers.’’
Michael J. K. Nielsen. Norman P. Jouppi, Jeremy Dion, David Boggs, Mich-WRL Research Report 86/1, September 1986. ael J. K. Nielsen.
WRL Research Report 87/8, April 1988. ‘‘Global Register Allocation at Link Time.’’
David W. Wall. ‘‘Fast Printed Circuit Board Routing.’’ WRL Research Report 86/3, October 1986. Jeremy Dion.
WRL Research Report 88/1, March 1988. ‘‘Optimal Finned Heat Sinks.’’
William R. Hamburgen. ‘‘Compacting Garbage Collection with Ambiguous WRL Research Report 86/4, October 1986. Roots.’’
Joel F. Bartlett.
‘‘The Mahler Experience: Using an Intermediate WRL Research Report 88/2, February 1988. Language as the Machine Description.’’
David W. Wall and Michael L. Powell. ‘‘The Experimental Literature of The Internet: An WRL Research Report 87/1, August 1987. Annotated Bibliography.’’
Jeffrey C. Mogul.
‘‘The Packet Filter: An Efficient Mechanism for WRL Research Report 88/3, August 1988. User-level Network Code.’’
Jeffrey C. Mogul, Richard F. Rashid, Michael ‘‘Measured Capacity of an Ethernet: Myths and
J. Accetta. Reality.’’
WRL Research Report 87/2, November 1987. David R. Boggs, Jeffrey C. Mogul, Christopher A. Kent.
‘‘Fragmentation Considered Harmful.’’ WRL Research Report 88/4, September 1988. Christopher A. Kent, Jeffrey C. Mogul.
WRL Research Report 87/3, December 1987. ‘‘Visa Protocols for Controlling Inter-Organizational Datagram Flow: Extended Description.’’
‘‘Cache Coherence in Distributed Systems.’’ Deborah Estrin, Jeffrey C. Mogul, Gene Tsudik,
Christopher A. Kent. Kamaljit Anand.
WRL Research Report 87/4, December 1987. WRL Research Report 88/5, December 1988.
‘‘Register Windows vs. Register Allocation.’’ ‘‘SCHEME->C A Portable Scheme-to-C Compiler.’’
David W. Wall. Joel F. Bartlett.
WRL Research Report 87/5, December 1987. WRL Research Report 89/1, January 1989.
‘‘Editing Graphical Objects Using Procedural ‘‘Optimal Group Distribution in Carry-Skip
Ad-Representations.’’ ders.’’
Paul J. Asente. Silvio Turrini.
WRL Research Report 87/6, November 1987. WRL Research Report 89/2, February 1989.
‘‘The USENET Cookbook: an Experiment in ‘‘Precise Robotic Paste Dot Dispensing.’’ Electronic Publication.’’ William R. Hamburgen.
Brian K. Reid. WRL Research Report 89/3, February 1989.
‘‘Simple and Flexible Datagram Access Controls for ‘‘Link-Time Code Modification.’’
Unix-based Gateways.’’ David W. Wall.
Jeffrey C. Mogul. WRL Research Report 89/17, September 1989. WRL Research Report 89/4, March 1989.
‘‘Noise Issues in the ECL Circuit Family.’’ ‘‘Spritely NFS: Implementation and Performance of
Jeffrey Y.F. Tang and J. Leon Yang. Cache-Consistency Protocols.’’
WRL Research Report 90/1, January 1990. V. Srinivasan and Jeffrey C. Mogul.
WRL Research Report 89/5, May 1989.
‘‘Efficient Generation of Test Patterns Using Boolean Satisfiablilty.’’
‘‘Available Instruction-Level Parallelism for
Super-Tracy Larrabee. scalar and Superpipelined Machines.’’
WRL Research Report 90/2, February 1990. Norman P. Jouppi and David W. Wall.
WRL Research Report 89/7, July 1989.
‘‘Two Papers on Test Pattern Generation.’’ Tracy Larrabee.
‘‘A Unified Vector/Scalar Floating-Point
Architec-WRL Research Report 90/3, March 1990. ture.’’
Norman P. Jouppi, Jonathan Bertoni, and David
‘‘Virtual Memory vs. The File System.’’ W. Wall.
Michael N. Nelson. WRL Research Report 89/8, July 1989.
WRL Research Report 90/4, March 1990. ‘‘Architectural and Organizational Tradeoffs in the
‘‘Efficient Use of Workstations for Passive Monitor-Design of the MultiTitan CPU.’’
ing of Local Area Networks.’’ Norman P. Jouppi.
Jeffrey C. Mogul. WRL Research Report 89/9, July 1989.
WRL Research Report 90/5, July 1990. ‘‘Integration and Packaging Plateaus of Processor
Performance.’’ Norman P. Jouppi.
WRL Research Report 89/10, July 1989.
‘‘A 20-MIPS Sustained 32-bit CMOS Microproces-sor with High Ratio of Sustained to Peak Perfor-mance.’’
Norman P. Jouppi and Jeffrey Y. F. Tang. WRL Research Report 89/11, July 1989.
‘‘The Distribution of Instruction-Level and Machine Parallelism and Its Effect on Performance.’’ Norman P. Jouppi.
WRL Research Report 89/13, July 1989.
‘‘Long Address Traces from RISC Machines: Generation and Analysis.’’
Anita Borg, R.E.Kessler, Georgia Lazana, and David W. Wall.
WRL Technical Notes
‘‘TCP/IP PrintServer: Print Server Protocol.’’ Brian K. Reid and Christopher A. Kent. WRL Technical Note TN-4, September 1988.
‘‘TCP/IP PrintServer: Server Architecture and Im-plementation.’’
Christopher A. Kent.
WRL Technical Note TN-7, November 1988.
‘‘Smart Code, Stupid Memory: A Fast X Server for a Dumb Color Frame Buffer.’’
Joel McCormack.
WRL Technical Note TN-9, September 1989.
‘‘Why Aren’t Operating Systems Getting Faster As Fast As Hardware?’’
John Ousterhout.
WRL Technical Note TN-11, October 1989.
‘‘Mostly-Copying Garbage Collection Picks Up Generations and C++.’’
Joel F. Bartlett.
Table of Contents
1. Introduction 1
1.1. Why use a workstation? 1
1.2. Previous work 2
2. Tapping the network 3
2.1. The packet filter 4
2.2. Performance issues 6
3. Efficient and correct calculation of network loading 8
3.1. Sources of Inaccuracy 8
3.2. An accurate algorithm 10
3.3. Subtle issues 11
3.4. Performance 12
3.5. Visualization 12
4. Automatic displays of traffic patterns 13
4.1. Collecting a traffic matrix 13
4.2. Automatic graph layout 14
5. Summary 17
6. Acknowledgements 18
List of Figures
Figure 1: Relationship between packet filter and other system components 5
Figure 2: Delivery without received-packet batching 7
Figure 3: Delivery with received-packet batching 7
Figure 4: Plot of Ethernet load versus time 8
Figure 5: Computation of Ethernet load 9
Figure 6: Poor choice of interval hides actual peak 10
Figure 7: Ethernet load by packet type 13
Figure 8: Ethernet load by source host 13
Figure 9: Traffic matrix on an Ethernet 15