ISSN: 1992-8645 www.jatit.org E-ISSN: 1817-3195
FLOW STRESS BEHAVIOR AND MATHEMATICS
MODELING OF SEMI-HOT FORMING FOR CF53 STEEL
FANXIN KONG,ZHENHONG LI
1
School of Material Engineering, Nanjing Institute of Technology, Nanjing, 211167, China
ABSTRACT
Using the isothermal compression experiment, the article study the flow stress change law in the semi-hot temperature range for Cf53, discuss the change mechanisms of flow stress, and develop a flow stress mathematical model applied to Cf53 steel semi-hot forming based on creep theory and statistical analysis which provides the basis for reasonable controlling of numerical simulation and thermal parameters for
Cf53 steel semi-hot forming. The experiment parameter variation of deformation temperature (from 800 ℃
to 950 ℃) and strain rate (from 0.1s-1 to 20s-1) have been realized. Pressure, temperature and displacement
during deformation are directly recorded by a computer and automatically transformed into the true strain and true stress, and draw the true stress - true strain curves.
Keywords: Cf53 Steel, Semi-Hot Forming, Flow Stress, Creep Theory
1. INTRODUCTION
The forming of structure steel is mainly divided as cold forming, warm forming and hot forming. Warming forming is in a temperature range of
650℃~850℃ and combines advantages of cold
and hot forming: high precision, low oxidation and decarburization tendency, long life of the mold, good formability and without softening treatment step[1]. These advantages have made warm forming achieve automatic production and therefore being widely used[2]. However there are some kinds of steel still can not get good formability in the warm forming temperature, the formed part are normally defective caused by poor liquidity. For this reason, slightly higher temperature can be used to form these steel parts[3, 4].
Under this condition, lower heating temperature can improve the precision of formed part and also higher heating temperature can conserve energy because light tonnage press is capable to form steel parts. This semi-hot forming technique, which the temperature is between warm forming and hot forming, has its particular advantages for precision forming manufacturing. By controlling billet heating, lubrication condition, accuracy of the mold and deformation parameters during the process, semi-hot forming can produce precision metal parts which with good surface quality and small dimensional tolerance. Most dimensions even all of the parts do not need subsequent machine working, which saves in row material and energy
consumption. Semi-hot forming has some
properties differ from warm forming and thermo forming because of different heating temperature. For a better understanding of the deformation mechanism of this advanced forming technique and exerting its advantages, the properties of semi-hot forming need to be researched[5].
CF53 is a kind of common steel used as truck transmission shaft part, so the use of semi-hot precision forming instead of existing hot forming can considerably improve production efficiency and reduce production cost. But there is little information about the research of semi-hot deformation mechanical properties, and lack of scientific basis to develop the process technology. Using the isothermal compression experiment, this paper studied the change law and mechanism of
flow stress of Cf53 at temperature of 800℃, 850℃,
900℃, 950℃ and 1000℃, a reliable frame of
reference is made to establish the semi-hot forming process of this material[4].
2. EXPERIMENTAL METHOD
Test material is Cf53 steel, its chemical composition is given in table 1:
Select cylinder compression sample, apply lubricant at the ends of sample to ensure uniformity
of deformation. Sample size is Φ8mm×12mm
ISSN: 1992-8645 www.jatit.org E-ISSN: 1817-3195
Table 1: Chemical Composition of Cf53 (wt% )
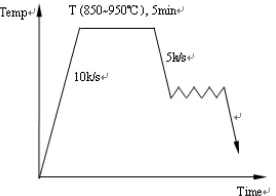
Hot compression experiment was carried out on the Gleeble-3500 thermo-simulated tester[6]. The tester automatically gives applied process strain (reduction), strain rate and temperature by program. Heating technique: the samples directly heated to
800℃, 850℃, 900℃ and 950℃, and then began to
deform after kept for 5 min (as Figure 1). Parameter
variation of deformation temperature (from 800 ℃
to 950 ℃) and strain rate (from 0.1s-1 to 20s-1)
[image:2.612.105.243.333.431.2]have been realized. Pressure, temperature and displacement during deformation are directly recorded by a computer and automatically transformed into the true strain and true stress, and draw the true stress - true strain curves.
Figure 1: Heating Technique Of Hot Compression
3. EXPERIMENT RESULTS AND
ANALYSIS
3.1True Stress - True Strain Curves
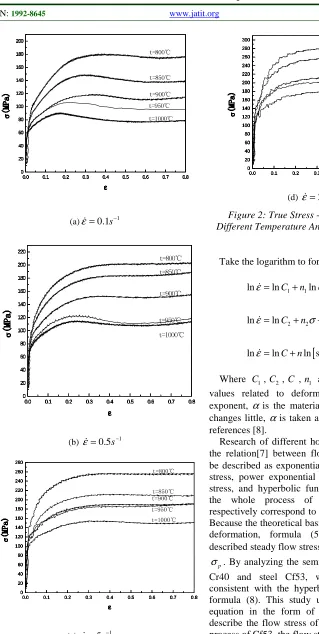
Figure 2 shows true stress - true strain curves at different temperature and different strain rate.
(1) Under the same deformation condition, work hardening caused by the increase of strain, flow stress rapidly increased while strain was increasing.
Then dynamic recrystallization softening was carried out after deforming over a certain point, the flow stress reached the maximum point when softening rate balanced with hardening rate; softening rate became greater than hardening rate with the progress of dynamic recrystallization and the flow stress decreased gradually; after perfect dynamic recrystallization true-stress continually but not significantly increased, as shown steady state flow characteristics; true stress increased with deformation at the same temperature.
(2) Under the same strain rate condition, the higher the deformation temperature, the lower the flow stress during steady deforming stage; when the deformation temperature remained unchanged, the lower the strain rate, the lower the flow stress during steady deforming stage.
(3) Figure 2 (a) shows the most magnificently softening phenomena of flow stress curve appears
when the strain rate ε
•
was 0.1s-1. This is because
softening was fully performed when the
deformation rate was low and it offset the work hardening caused by deformation increasing.
(4) Peak strain increased as T decreased andε
•
increased, indicating that dynamic recrystallization blocked when T decreased, the peak stress moved
towards the direction of ε increased, also
indicating the impact trend which T had on the critical deformation occurred while dynamic recrystallizing: the smaller the T, the greater the peak strain, the more difficult for recrystallization.
3.2 Creep Equation And Prediction Method Of Semi-Hot Deformation Flow Stress
Zener and Sellars[7] thought flow stress is related to deformation temperature, deformation speed and strain in a progress of high temperature deformation and put the general expression of material flow stress model:
( , , )
f T
σ = ε ε& (1)
Where σ is the flow stress (MPa), ε& is the
equivalent strain rate (s-1), ε is the equivalent
strain, T is the absolute deformation temperature.
The relation between T and ε& can expressed by
parameterZ
exp( / )
Z=ε& Q RT (2)
Where Z is Zener-Hollomon parameter, its
physical meaning is the deformation rate factor of
temperature compensation; Q is the hot
deformation activation energy, it reflects the ease of material hot deformation and is an important
mechanical property during hot deformation; Ris
the gas constant, its value is 8.314J·mol-1·K-1.
There are three expression form of Z.
1 1
exp( / ) n
Z=ε& Q RT ≈Cσ (3)
2 2
exp( / ) exp( )
Z=ε& Q RT ≈C nσ (4)
[
]
exp( / ) sinh( )n
Z=ε& Q RT ≈C ασ (5)
C Si Mn P S
ISSN: 1992-8645 www.jatit.org E-ISSN: 1817-3195
0.0 0.1 0.2 0.3 0.4 0.5 0.6 0.7 0.8 0 20 40 60 80 100 120 140 160 180 200
0.0 0.1 0.2 0.3 0.4 0.5 0.6 0.7 0.8 0 20 40 60 80 100 120 140 160 180 200
0.0 0.1 0.2 0.3 0.4 0.5 0.6 0.7 0.8 0 20 40 60 80 100 120 140 160 180 200
0.0 0.1 0.2 0.3 0.4 0.5 0.6 0.7 0.8 0 20 40 60 80 100 120 140 160 180 200
0.0 0.1 0.2 0.3 0.4 0.5 0.6 0.7 0.8 0 20 40 60 80 100 120 140 160 180 200 σσσσ ( M P a ) ( M P a ) ( M P a ) ( M P a ) εεεε σσσσ ( M P a ) ( M P a ) ( M P a ) ( M P a ) εεεε σσσσ ( M P a ) ( M P a ) ( M P a ) ( M P a ) εεεε σσσσ ( M P a ) ( M P a ) ( M P a ) ( M P a ) εεεε t=800℃ t=850℃ t=900℃ t=950℃ t=1000℃ σσσσ ( M P a ) ( M P a ) ( M P a ) ( M P a ) εεεε
(a)ε&=0.1s−1
0.0 0.1 0.2 0.3 0.4 0.5 0.6 0.7 0.8
0 20 40 60 80 100 120 140 160 180 200 220
0.0 0.1 0.2 0.3 0.4 0.5 0.6 0.7 0.8
0 20 40 60 80 100 120 140 160 180 200 220
0.0 0.1 0.2 0.3 0.4 0.5 0.6 0.7 0.8
0 20 40 60 80 100 120 140 160 180 200 220
0.0 0.1 0.2 0.3 0.4 0.5 0.6 0.7 0.8
0 20 40 60 80 100 120 140 160 180 200 220
0.0 0.1 0.2 0.3 0.4 0.5 0.6 0.7 0.8
0 20 40 60 80 100 120 140 160 180 200 220 σσσσ ( M P a ) ( M P a ) ( M P a ) ( M P a ) εεεε σσσσ ( M P a ) ( M P a ) ( M P a ) ( M P a ) εεεε σσσσ ( M P a ) ( M P a ) ( M P a ) ( M P a ) εεεε t=800℃ t=850℃ t=900℃ t=950℃ t=1000℃ σσσσ ( M P a ) ( M P a ) ( M P a ) ( M P a ) εεεε σσσσ ( M P a ) ( M P a ) ( M P a ) ( M P a ) εεεε
(b) ε&=0.5s−1
0.0 0.1 0.2 0.3 0.4 0.5 0.6 0.7 0.8 0 20 40 60 80 100 120 140 160 180 200 220 240 260 280
0.0 0.1 0.2 0.3 0.4 0.5 0.6 0.7 0.8 0 20 40 60 80 100 120 140 160 180 200 220 240 260 280
0.0 0.1 0.2 0.3 0.4 0.5 0.6 0.7 0.8 0 20 40 60 80 100 120 140 160 180 200 220 240 260 280
0.0 0.1 0.2 0.3 0.4 0.5 0.6 0.7 0.8 0 20 40 60 80 100 120 140 160 180 200 220 240 260 280
0.0 0.1 0.2 0.3 0.4 0.5 0.6 0.7 0.8 0 20 40 60 80 100 120 140 160 180 200 220 240 260 280 t=950℃ t=1000℃ σσσσ ( M P a ) ( M P a ) ( M P a ) ( M P a ) εεεε t=800℃ t=850℃ t=900℃ σσσσ ( M P a ) ( M P a ) ( M P a ) ( M P a ) εεεε σσσσ ( M P a ) ( M P a ) ( M P a ) ( M P a ) εεεε σσσσ ( M P a ) ( M P a ) ( M P a ) ( M P a ) εεεε σσσσ ( M P a ) ( M P a ) ( M P a ) ( M P a ) εεεε
(c) ε&=5s−1
0.0 0.1 0.2 0.3 0.4 0.5 0.6 0.7 0.8 0 20 40 60 80 100 120 140 160 180 200 220 240 260 280 300
0.0 0.1 0.2 0.3 0.4 0.5 0.6 0.7 0.8 0 20 40 60 80 100 120 140 160 180 200 220 240 260 280 300
0.0 0.1 0.2 0.3 0.4 0.5 0.6 0.7 0.8 0 20 40 60 80 100 120 140 160 180 200 220 240 260 280 300
0.0 0.1 0.2 0.3 0.4 0.5 0.6 0.7 0.8 0 20 40 60 80 100 120 140 160 180 200 220 240 260 280 300
0.0 0.1 0.2 0.3 0.4 0.5 0.6 0.7 0.8 0 20 40 60 80 100 120 140 160 180 200 220 240 260 280 300 σσσσ ( M P a ) ( M P a ) ( M P a ) ( M P a ) εεεε t=800℃ t=850℃ σσσσ ( M P a ) ( M P a ) ( M P a ) ( M P a ) εεεε σσσσ ( M P a ) ( M P a ) ( M P a ) ( M P a ) εεεε σσσσ ( M P a ) ( M P a ) ( M P a ) ( M P a ) εεεε t=900℃ t=950℃ t=1000℃ σσσσ ( M P a ) ( M P a ) ( M P a ) ( M P a ) εεεε
[image:3.612.104.423.68.702.2](d) ε&=20s−1
Figure 2: True Stress - True Strain Curves At Different Temperature And Different Strain Rate
Take the logarithm to formula (3), (4) and (5):
1 1
ln lnC n ln Q
RT
ε&= + σ− (6)
2 2
ln lnC n Q
RT
ε&= + σ− (7)
[
]
ln lnC nln sinh( ) Q
RT
ε&= + ασ − (8)
Where C ,1 C , C ,2 n and 1 n are the constant 2
values related to deformation, n is the stress
exponent, α is the material constant and its value
changes little, α is taken as 0.012 according to the
references [8].
Research of different hot-forming data indicates
the relation[7] between flow stress σ and Z can
be described as exponential relationship under low stress, power exponential relationship under high stress, and hyperbolic function relationship under the whole process of stress change, which respectively correspond to formula (6), (7) and (8). Because the theoretical basis of formula (5) is creep deformation, formula (5) commonly used to
described steady flow stress σsand peak flow stress
p
σ . By analyzing the semi-hot flow stress of steel
ISSN: 1992-8645 www.jatit.org E-ISSN: 1817-3195
When we keep ε&constant, according to formula
(8), by requiring partial derivative of 1/T, we get:
ln sinh( )
(1 / )
p
Q Rn Rn
T ε
ασ
β ∂
= =
∂
&
(9)
When we keep T constant, according to formula (8), value n can be obtained by requiring partial derivative of lnε&:
ln
ln sinh( p) T
n ε
ασ
∂
=
∂
& (10)
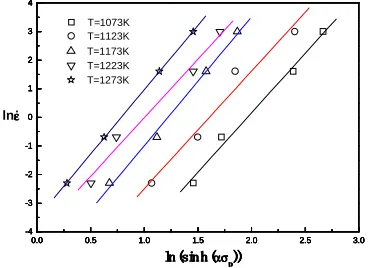
Equation (10) shows the linear relationship
between ln sinh(ασp) and lnε&, using least squares
regression, the average slope of relation curve is n .
By taking ln sinh(ασp) and 1/T as coordinates to
establish relation curve and then require average
slope βof the curve. Substitute the resultant value
β , n and gas constant Rin the formula (9), and
then the deformation activation energy of Cf53 under different stress condition can be calculated.
According to formula (8), we can express flow stress by using Zener-Hollomon parameter as follows:
1
1 2 2
1
ln Z n Z n 1
C C
σ α
= + +
(11)
3.3 Semi-Hot Deformation Steady-State Stress Model Of Cf53
Figure 3 is the relational graph of Cf53 steel
strain rate and ln sinh(ασp) , Figure 4 is the
relational graph of 1/T o f Cf53 steel and
ln sinh(ασp). By averaging the straight slope of
Figure 3 we get n , by averaging the straight slope
of Figure 4 we get β , and then deformation
activation energy of Cf53 steel can be worked out. Given a deforming condition as T=1173K and
ε& =5s-1 , constant value C can be worked out. Calculated values of each parameter shown as table 2. Substitute deformation activation energy in the formula (2), the sub-expression of parameter Z in the semi-hot temperature range of Cf53 steel can be obtained:
5
2.90782 10
exp( )
Z
RT
ε ×
= & (12)
Substitute constant value C and index n in
formula (11), the flow stress model for Cf53 steel in semi-hot temperature range can be obtained:
1
1 2 2
4.273 4.273
11 11
83.333ln 1
1.0198 10 1.0198 10
Z Z
σ
= + +
× ×
(13)
Table 3 calculated value ln Z corresponded to
different experimental condition by the formula (12):
0.0 0.5 1.0 1.5 2.0 2.5 3.0
-4 -3 -2 -1 0 1 2 3 4
0.0 0.5 1.0 1.5 2.0 2.5 3.0
-4 -3 -2 -1 0 1 2 3 4
0.0 0.5 1.0 1.5 2.0 2.5 3.0
-4 -3 -2 -1 0 1 2 3 4
0.0 0.5 1.0 1.5 2.0 2.5 3.0
-4 -3 -2 -1 0 1 2 3 4
0.0 0.5 1.0 1.5 2.0 2.5 3.0
-4 -3 -2 -1 0 1 2 3 4
ln ln ln
ln (((sinh(sinhsinhsinh ((((ασασασασpppp))))))))
T=1073K
lnεεεε
T=1173K T=1223K T=1273K
.
[image:4.612.315.527.148.201.2]T=1123K
Figure 3: Peak Stress Versus Strain Rate For The Cf53
0 .0 0 0 7 8 0 .0 0 08 1 0 .0 00 8 4 0 .0 0 0 8 7 0 .0 0 0 9 0 0 .0 0 0 9 3 0 .0
0 .5 1 .0 1 .5 2 .0 2 .5 3 .0
0 .0 0 0 7 8 0 .0 0 08 1 0 .0 00 8 4 0 .0 0 0 8 7 0 .0 0 0 9 0 0 .0 0 0 9 3 0 .0
0 .5 1 .0 1 .5 2 .0 2 .5 3 .0
0 .0 0 0 7 8 0 .0 0 08 1 0 .0 00 8 4 0 .0 0 0 8 7 0 .0 0 0 9 0 0 .0 0 0 9 3 0 .0
0 .5 1 .0 1 .5 2 .0 2 .5 3 .0
0 .0 0 0 7 8 0 .0 0 08 1 0 .0 00 8 4 0 .0 0 0 8 7 0 .0 0 0 9 0 0 .0 0 0 9 3 0 .0
0 .5 1 .0 1 .5 2 .0 2 .5 3 .0
0 .1 s-1
1 /T 1 /T 1 /T 1 /T (((( KKKK-1-1-1-1))))
ln
(s
in
h
(
α
σ
α
σ
ασασp
))
0 .5 s-1
1 /T 1 /T 1 /T 1 /T (((( KKKK-1-1-1-1))))
ln
(s
in
h
(
α
σ
α
σ
ασασp
))
5 s-1
1 /T 1 /T 1 /T 1 /T (((( KKKK-1-1-1-1))))
ln
(s
in
h
(
α
σ
α
σ
ασασp
))
2 0 s-1
1 /T 1 /T 1 /T 1 /T (((( KKKK-1-1-1-1))))
ln
(s
in
h
(
α
σ
α
σ
ασασp
[image:4.612.318.503.255.389.2]))
[image:4.612.318.509.414.549.2]Figure 4: Peak Stress Versus Temperature For The Cf53
Table 2 The Parameters In The Flow Stress Model Of The Cf53
Parameter parameter value
n 4.273
β 8185.117 K·MPa
Q 290.782 KJ·mol-1
[image:4.612.325.527.628.704.2]ISSN: 1992-8645 www.jatit.org E-ISSN: 1817-3195
Table 3 Values Of Lnz At Different Conditions For The Cf53
1073 1123 1173 1223 1273
0.1 30.29
3
28.84
2 27.514
26.29 5
25.17 2
0.5 31.90
2
30.45
1 29.124
27.90 5
26.78 1
5 34.20
5
32.75
4 31.426
30.20 7
29.08 4
20 35.59
1
34.14
0 32.812
31.59 3
30.47 0
4. CONCLUSIONS
According to the Cf53 compression experiment carried out in a semi-hot temperature range of
800℃ ~ 1000℃, this paper has analyzed its forming
property and flow stress, conclusions as follows:
Peak strain increased as T decreased and ε
•
increased. When the strain rate was 0.1s-1,
because softening was fully performed as the deformation rate was low and it offset the work hardening caused by deformation increasing.
Flow stress formula in the semi-hot temperature range for Cf53 has been worked out based on creep theory by doing laboratory experiment. It can be used to calculate and predict flow stress in production, to guide the design of process and mold.
REFERENCES:
[1] Zhenhong Li, “Research on the forming process
simulation and die wear of semi-hot
temperature range”, Ph.D. Thesis, Dept. Plasticity Technology, Shanghai Jiao Tong University , Shanghai, China, 2009.
[2] T.Wu, G.Ren. “Research on warm forging/cold orbital forming technology for the straight bevel gear in differential case”,China Mechanical Engineering, Vol.26, No.16, 2005, pp.1106-1109.
[3] Hui Yang and Zhenhong Li,“Investigation on Zener-Hollomon in the warm-hot deformation behavior of 20CrMnTi”, Journal of Zhejiang University,Vol.7, No.8, 2006, pp.1453-1460. [4]Yang Hui, Li Zhenhong, “Investigation on
Zener-Hollomon in the warm-hot deformation of Cf53”, Journal of Shanghai Jiaotong University, Vol.12, No.3, 2007, pp.352-358.
[5]Zhiliang Zhang, “Warm Forming Technology”, (Shanghai Science and Technology Publishing House, 1986).
[6] Xuchuan Huang, “Thermal simulation
technology of tester GLEEBLE-3500”, Meishan Technology, Vol. 10, No.1, 2006, pp.44-46. [7]Sellars CM, “Hot deformation processing”.
Materials Science and Technology, Vol. 22, No.8, 1992, pp.134-139.
[8] A. Laasraoui, J.J.Jonas, “Prediction of temperature distribution, flow stress and microstructure during the multipass hot rolling of steel plate and strip”, ISIJ International, Vol.8, No.31, 1991, pp.95-105.
T(K)