Aggregate Analysis of Security Surveys in Quest of
Current Information Security Landscape
Anshu Tripathi
Department of Information Technology Mahakal Institute of Technology
Ujjain, India
Umesh Kumar Singh
Institute of Computer Science Vikram University
Ujjain, India
ABSTRACT
Security is often viewed as an arms race between attackers, who try to exploit vulnerabilities and security administrators, who try to protect system against these attacks. In this regard, analysis of emerging security trends can be helpful in planning proper countermeasures to ensure security. Several studies and surveys exist that provide statistical information on security trends and issues. By comparative and aggregate analysis of these surveys, good understanding of the current information security trends and issues can be gained. So, in order to get a holistic picture of current state of information security landscape, this paper made an analysis of the seven well known information security surveys conducted in year 2011. Results are generated by aggregating and analyzing recent survey reports to present a complete and comprehensive picture of current information security landscape. Furthermore, this paper also highlights key findings derived from this analysis.
General Terms
Information Security, Security Trends, Vulnerability.
Keywords
Information security trends, Security survey, Vulnerability trends, Attack trends, Security countermeasures.
1.
INTRODUCTION
In the past three decades, the information technology revolution has changed almost every aspect of human life. Tremendous potential enabled by IT systems, has significantly reshaped the technology landscapes and system capabilities in all major industry sectors. By now almost all kind of organizations are dependent on IT systems to perform large part of their business activity. Moreover, organizations are constantly building larger and more complex computing environments, populating them with critical and confidential data and connecting them to external networks, such as the Internet. Interconnected IT systems are beneficial to an organization because of their functionality, connectivity and accessibility, but also susceptible to attacks from both outsiders and internal users. Furthermore, in recent years, the huge diffusion of new technologies and Internet increases the need of security, because communication networks are used to transfer increasingly sensitive information that can be valuable and confidential, requiring protection against human misuse and also attracting attention of attackers. Moreover, attackers have evolved from computer enthusiasts to professional hackers [1]. Hacking community created freely available hacking tools and hence attackers changed from using worms and viruses to more sophisticated attacks. This has resulted in information security threats like identity theft, phishing, social engineering etc. Simple attacks have matured to become sophisticated, automatic, subtle and very hard to detect [2, 3].
In view of rise in scale and complexity of security incidents, two things are very clear: IT infrastructures are vulnerable and motivated attackers are always ready to exploit these vulnerabilities. Therefore, proactive approach is necessary to secure information and infrastructure. Further, this requires innovative ideas and insightful analysis of security issues to appropriately respond to the challenges posed by technological developments. Another challenge is that as information security moves to respond to new threats in current and future environments, simultaneously, it has to protect against old threats also. This makes very difficult to protect information and its infrastructure.
Security is often viewed as an arms race between attackers, who try to exploit vulnerabilities and security administrators, who try to protect system against these attacks. It is therefore desirable to know emerging trends in security in order to be able to think about countermeasures before these emerging trends become large-scale problems. Despite several studies aimed at providing much needed statistical information on security trends and issues, there is still an urgent need to find one that is complete and reliable. Symantech, CSI/FBI, HP, Secunia, Microsoft, Verizon and Ponemon are some well known names that had been gathering statistics and trends on information security for many years and produce surveys on yearly basis. A good understanding of the current information security trends and issues can be gained by using results of these surveys. But, in our knowledge, there is still no work that pays attention to the aggregation of above surveys to get a holistic picture of the information security landscape.
To develop a good understanding of current state of information security landscape, this paper made an analysis of the seven well known information security surveys conducted in year 2011: Symantech Global Internet Security Threat report [4], CSI/FBI computer crime and security survey [5], HP’s Top Cyber Security Risk report [6], Secunia Yearly report [7], Microsoft Security Intelligence report [8], Verizon 2010 Data Breach Investigations Report [9] and Ponemon Institute 2009 Annual Study: Cost of a Data Breach [10]. Further, results are presented by aggregating and analyzing these survey reports to present a complete and comprehensive picture of current information security landscape. Objective is to identify need of proactive security solutions in current information security landscape.
The organization of the paper is as follows. Section 2 discusses security trends in terms of vulnerability trends, attack trends and preferred security countermeasures, based on statistics and trends analyzed from selected set of surveys. Section 3 presents key findings derived from this analysis. Finally, conclusion is presented in section 4.
2.
SECURITY TRENDS
important, integral parts of everyday activities and communication. For example, worldwide Internet usage has grown by 448% to an estimated 2 billion users, since 2000 and networking has evolved from dedicated point to point connections to ubiquitous communication between people, platforms and applications [7]. Increased use of Internet, intranets and other open systems also increases potential security risks in the networked information system environment. Vulnerabilities are the major contributor to the risks that people and organizations face when working in such kind of open environment connected to Internet. Vulnerabilities are the major attack vector that opens the door for unauthorized system access and compromise. Cybercriminals and attackers use refined methods to identify and exploit vulnerable systems connected to the Internet in an automated fashion and on a large scale. Thus, proper mitigation of vulnerabilities is necessary in order to ensure the security. In current scenario, one of the big concerns for security administrator is the identification and remediation of vulnerabilities in the networked information system environment. Recent security trends are presented in this section, to justify the rising need of proactive security solutions that can help security administrator in vulnerability mitigation in optimal manner.
2.1
Vulnerability Trends
One might think that over time, security would get better and systems would be less vulnerable, but this is not true as witnessed by increase in vulnerabilities and attacks in past few years. Table 1 present vulnerability statistics of last twelve years, collected from two most popular and genuine vulnerability data sources: National Vulnerability Database (NVD) [11] and Open Source Vulnerability Database (OSVDB) [12]. NVD is U.S. government repository of standards based vulnerability management data. NVD currently contains 505081 CVE vulnerabilities. CVE publication rate by NVD is 13 vulnerabilities per day. CVE (Common Vulnerabilities and Exposures) [13], is a dictionary of publicly known information security vulnerabilities and exposures. CVE has become a de facto industry standard used to uniquely identify vulnerabilities which have achieved wide acceptance in security industry. OSVDB is an independent and open source database created by and for security community. The database currently covered 80,718 vulnerabilities, spanning 41,287 products from 4,735 researchers over 109 years.
In the year-by-year view of vulnerability data, it is clear that vulnerability reporting peaked in 2006 and has been in a slow decline ever since. Despite this decline, the general trend over time is still upward as Symantech discovered approximately 95 new vulnerabilities per week, as reported in Symantech Internet Security Threat report 2011 [4]. In 2011, the Symantec VeriSign website malware scanning service scanned over 8.2 Billion URLs for malware infection and approximately 1 in 156 unique websites were found to contain malware. Websites with vulnerabilities are at more risk of malware. Between October and the end of the year 2011, Symantec identified that 35.8% of websites had at least one vulnerability and 25.3% had at least one critical vulnerability. In HP’s, 2011 top cyber security risk report [6], it is analyzed that decline in disclosure of new vulnerabilities doesn’t mean
that vulnerabilities don’t exist. Rather, it is indicative of a change in the vulnerability landscape- including how these vulnerabilities are being discovered, how they are disclosed and where they exist. Few of the reasons reported are: vulnerability reports can be sold and significant number of vulnerabilities are being discovered, but disclosed only to private clients. This leaves a significant quantity of vulnerabilities uncounted. Increasing complexity of products developed also made it more difficult to discover vulnerabilities.
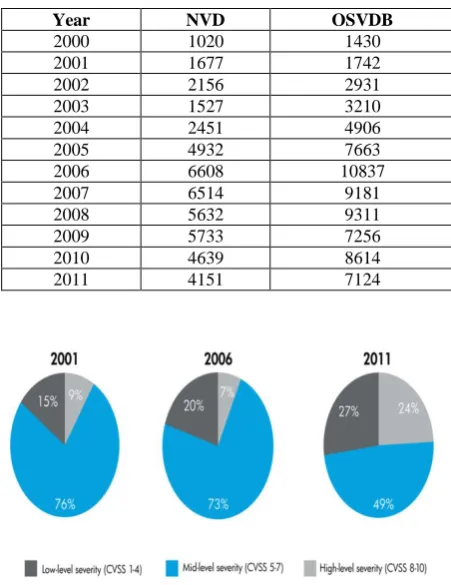
[image:2.595.314.540.390.683.2]Besides vulnerability counts, it is also important to investigate the evolution and distribution of important vulnerability aspects; such as the criticality, the impact, the attack vector and availability of patches. Figure 1, highlights how the percentage of high severity vulnerabilities has increased in last ten years. High severity vulnerabilities make up 24% of the total vulnerabilities in 2011 as compared to relatively very less, 9% in 2001. More important to note is that 77% of the total number of vulnerabilities are remotely exploitable, while only 15% need local network access and merely 8% need local system access for exploitation in 2011 [7]. Further, as quoted in Secunia yearly report 2011 [7], “Cybercriminals do not need 0-day vulnerabilities; there are always plenty of opportunities in unpatched programs”.
Table 1. Vulnerability statistics
Year NVD OSVDB
2000 1020 1430
2001 1677 1742
2002 2156 2931
2003 1527 3210
2004 2451 4906
2005 4932 7663
2006 6608 10837
2007 6514 9181
2008 5632 9311
2009 5733 7256
2010 4639 8614
2011 4151 7124
Figure 1. Severity of OSVDB vulnerabilities broken out over 10 years
the disclosure of the vulnerability and 77% had a patch available within 30 days of disclosure [7]. This data indicates that there is limited room for 0-day exploits. Microsoft even reports that less than 1% of the attacks in the first half of 2011 were attributed to 0-day exploits. [8]. Further, as reported in [4], on PCs a four-year old vulnerability in many Microsoft operating systems was, by far, the most frequently attacked vulnerability in 2011, clocking in at over 61 million attacks against the Microsoft Windows RPC component. Moreover, patches are available for all five of the most-attacked vulnerabilities in year 2011. This confirms the claim by CERT that greater than 95% of security incidents result from exploitation of vulnerabilities or configuration errors where countermeasures were available [14].
By above discussion, it is apparent that high vulnerability counts, paired with the high criticality ratings makes accurate information about vulnerabilities, an essential, security-critical requirement for effective risk assessment, prioritization and vulnerability remediation. Moreover, focusing on sheer number of vulnerabilities is not enough, but knowing what to patch is even more important. A case study conducted in [7], results that 80% reduction in risk can be achieved by patching 10 most critical programs, in an organizational infrastructure with 200 different programs installed. This implies that, challenge is to identify and patch the right 10 programs out of the 200. Thus, efficient identification of critical vulnerabilities and patching them is the optimal approach to achieve the largest reduction of risk with limited resources.
2.2
Attack Trends
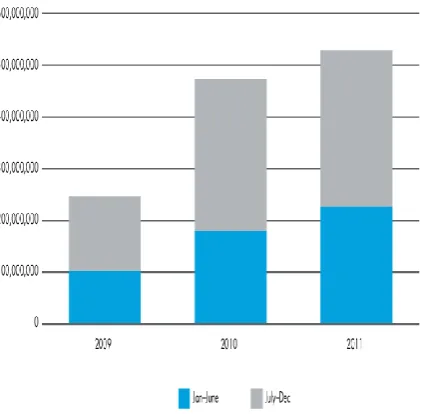
A greater understanding of risk can be gained by identification of attacks exploiting the vulnerabilities and frequency of these attacks. Keeping this point in mind, recent attack trends are presented in this subsection. In recent years, attacks have been rising steadily and in some cases dramatically. Symantech blocked more than 5.5 billion malicious attacks in 2011, an increase of more than 80% from the previous year [4]. This increase was due to a surge in polymorphic malware attacks, particularly from those found in web attack kits and social engineering attacks using email-borne malware. In addition to the 80% surge in attacks, the number of unique malware variants also increased by 41% and the number of web attacks blocked per day also increased dramatically, by 36% [4]. Most of the widespread attacks employed advanced techniques like server-side polymorphism that enables attackers to generate an almost unique version of their malware for each potential victim. Further, vast adoption of social networks also working as propagation vector as, these sites attract million of users and provide fertile ground for attackers. Moreover, attacks are rising despite of slow decrease in number of vulnerabilities. This indicates that attackers are able to efficiently use existing vulnerabilities. In [6], data on attacks that exploited known vulnerabilities are presented that shows that, attacks more than doubled in the second half of 2011. Details of year by year attack statistics is shown in Figure 2. Further, 2011 cyber security report [6]
states that web application attacks grew almost 50% from 2010 to 2011.
Moreover, in 15th annual 2010/2011 CSI Computer crime and Security Survey [5], 41% of respondents admitted that they experienced security incidents in last one year period. 22% of CSI survey respondents confirm that at least some of their security incidents involved targeted attacks and 3% experienced more than 10 targeted attacks. 22% isn’t any kind of majority, but it’s a strong indication that this kind of attack has become more than a theoretical discussion point. This statistics is shown in Figure 3. With a targeted attack, it is almost impossible to know, when one is being targeted, as by their very nature they are designed to slip under the radar and evade detection. As reported in [4], the number of targeted attacks increased dramatically during 2011 from an average of 77 per day in 2010 to 82 per day in 2011.
[image:3.595.320.531.474.681.2]CSI survey also asked respondents about type of attacks they’ve experienced. This part of survey statistics very helpful in understanding current attack landscape. This is depicted in Figure 4. Malware infection continued to be the most commonly seen attack since 2005, with 67.1% of respondents reporting it this year. Prior to the timeframe of CSI 2011 survey, a report issued by Breach Security [9] analyzed global security incidents that occurred from January 1 through July 31, 2009 and found a 30% increase in overall web attacks compared to 1H 2008. It’s hard to find statistics like this that directly measure web attack frequency. However, there’s a strong hint of the extent that web is used as an attack vector in the Verizon report [9]. 70% of Verizon’s breaches resulted from external sources, 40% resulted from hacking and 98% of data records were lost from servers.
Figure 3. Percentage of CSI survey participants experienced targeted attacks in 2011
Verizon also says that 94% of the data breaches involved malware in some way. One of the interesting finding from the Ponemon report [10] is that data losses increased markedly from 12% to 24%, which suggests a greater criminal effort to steal data records.
It’s also important to have a note of financial losses incurred due to these attacks experienced by organizations. In year 2011’s CSI survey lowest number of respondents in the survey’s history, 77 were willing to share numerical estimates of their financial losses. There were only two cases out of the 77 where genuinely large losses were shared. One amounted to $20 million in overall losses, another to $25 million. If the two large figures reported above are discarded then average loss across the group that shared financial data would fall below $100, 000 per respondent. 2009’s CSI survey [15] reported: average losses were $234,000 in 2009, $289,000 in 2008 and $345,000 in 2007. Figure 5 show trends in financial losses in last five years. This sounds good, but it must be noted that not all participants shared details of their financial losses.
[image:4.595.83.521.333.713.2]Figure 5. Average financial losses per respondent in CSI survey
2.3
State
of
Proactive
Security
Countermeasures
CSI survey also collected statistics about reactions taken by respondents after the security incidents. Respondents appear to be more proactive when dealing with incidents than they have been in past years. In year 2011, 62.3% of respondents had patched vulnerabilities following an incident [2]. This was markedly up from prior years when the number was below 50%. There was significant jump to those reporting that they installed additional security software, rising from 37.8% last year to 48.6%. The attempt to identify the perpetrator continues to drop, from 60% two years ago, to 37.2% last year and now this year down to 23.9%. Details are shown in Figure 6. It would seem that protection and mitigation are much higher priorities than attempting to find the wrongdoer.
By way of broad generalization, CSI survey [2], found that respondents are focusing on being proactive about defence. In year 2011, 67.5% of respondents used vulnerability/patch management security technology to protect their organization, while in year 2010, it was around 55%. The reported use of intrusion detection system which is a reactive security technology fell from 72.6% in last year’s survey to 62.4% this year. Figure 7 shows details about type of security technology used by respondents in last two years. When respondents are asked about the satisfaction with security technology on a scale of 1 to 5, vulnerability/patch management rated at level 3. Moreover, when asked about usefulness of sources of information while prioritizing security needs and developing a security strategy, vulnerability notification services was rated 3.5 on a scale of 1 to 5.
All these trends unanimously indicate that vulnerabilities as being the root cause of security incidents are required to be properly mitigated, in view of increasing number of attacks and vulnerabilities. Further, in view of limited resources, proper patching strategy is an effective approach for reducing vulnerability risks. Moreover, organizations are now focusing more on deploying proactive security technologies and vulnerability/patch management is prominently used in last two years.
But, satisfaction level with vulnerability/patch management solutions is not good. This raises the urgent need to improve vulnerability/patch management solutions, so that usefulness of these solutions can be increased, while protecting organizational IT resources.
[image:5.595.74.536.456.691.2]Figure 7. Type of security technology used by percentage of respondents in CSI survey
3.
KEY FINDINGS
Key findings from the analysis of seven well established security surveys published in year 2011, mentioned in section 1, are:
Vulnerability reporting peaked in 2006 and has been in a slow decline ever since. Decline in disclosure of new vulnerabilities indicative of a change in the vulnerability landscape instead of decline in presence of number of new vulnerabilities.
Percentage of high severity vulnerabilities increasing gradually.
More than 70% of vulnerabilities had a patch available within one day of the disclosure of the vulnerability. Hence, there is limited room for 0-day exploits.
Focusing on sheer number of vulnerabilities is not enough, but knowing what to patch is even more important. As, approximately, 80% reduction in risk can be achieved by patching most critical programs. Challenge is to identify and patch right vulnerabilities.
Number and sophistication of attacks are rising despite of slow decrease in number of
vulnerabilities. This indicates that attackers are able to efficiently use existing vulnerabilities.
Increase in number of attacks is mainly due to surge in polymorphic malware attacks and vast adoption of social networks.
Number of targeted attacks is increasing. This is a serious issue, because with a targeted attack, it is almost impossible to know, when one is being targeted, as by their very nature they are designed to slip under the radar and evade detection.
Organizations are focusing on being proactive about defense when dealing with incidents than they have been in past years.
Vulnerability/patch management solutions are gaining popularity. Patching vulnerabilities is an effective means to mitigate increasing number of security attacks, as they remediate the root cause of compromise.
4.
CONCLUSIONS
Holistic picture of the current state of information security landscape is presented based on aggregate analysis of security surveys from well known and established sources like CSI, Symantech, Verizon, HP, Secunia, Microsoft and Ponemon. Further, need of preventive security technologies also identified. Recent trends unanimously indicate that number of Internet users, vulnerabilities and attacks that exploit these vulnerabilities are increasing year by year. Moreover, targeted attacks and sophistication of attacks are also increasing. This suggests that vulnerabilities as being the root cause of security incidents are required to be mitigated to control increasing number of attacks. Further, trends show that organizations are now focusing more on deploying proactive security technologies. Vulnerability/patch management is prominently used security technology in last two years, but, satisfaction level with vulnerability/patch management solutions is not good, hence, need to be improved.
5.
ACKNOWLEDGMENTS
We would like to thank the anonymous reviewers who provided helpful feedback on our manuscript.
6.
REFERENCES
[1] Gelbstein E., “Information security for policy makers: what it means- why it matters- what to do about it?”, [Online] Available: http://www.unitarny.org/mm/File/ Webinars /Unitar%20eg%20presentation%2030_08.pdf, (Accessed on 14-05-12).
[2] Schneier B., “The speed of security”, IEEE Security and Privacy, Vol. 1, Issue 4, 2003.
[3] Carey L., “The evolution of computer virus and anti virus
protection”, [Online] Available:
http://www.identitytheftsecrets.com/the-evolution-of-computer-virusesand-anti-virus-p.html, (Accessed 14-05-12).
[4] Symantec Global Internet Security Threat Report 2011, [Online] Available: http://eval.symantec.com/mktginfo/ enterprise/white_papers/b-whitepaper_internet_security
_threat_report_xv_04-2010.en-us.pdf, (Accessed on 25-05-2012).
[5] Robert Richardson, "15th Annual 2010/2011 Computer Crime and Security Survey”, 2011.
[6] 2011 Top Cyber Security Risks Report, [Online] Available: http://www.hpenterprisesecurity.com/ solutions/2011-cyber-security-risk-report, (Accessed on 25-05-2012).
[7] Secunia Yearly Report, 2011, [Online] Available: http://secunia.com/company/2011_yearly_report, (Accessed on 25-05-2012).
[8] Microsoft Security Intelligence Report, Volume 11, 2011, [Online] Available: http://www.microsoft.com/ security/sir/, (Accessed on 25-05-2012).
[9] Verizon 2010 Data Breach Investigations Report, [Online] Available: http://www.verizonbusiness.com/ resources/reports/rp_2010-data-breach-report_en_xg.pdf, (Accessed on 25-05-2012).
[10]Ponemon Institute 2009 Annual Study: Cost of a Data Breach, [Online] Available: http://www.ponemon.org/ local/upload/fckjail/generalcontent/18/file/US_Ponemon _CODB_09_012209_sec.pdf, (Accessed on 25-05-2012).
[11]National Vulnerability Database (NVD), [Online] Available: http://nvd.nist.gov/scap.cfm (Accessed on 27-05-2012).
[12]OSVDB, “The open source vulnerability database”, [Online] Available: http://www.osvdb.org/ (Accessed on 27-05-2012).
[13]The MITRE Corporation. “Common Vulnerabilities and Exposures (CVE),” [Online] Available: http://www.cve.mitre.org/, (Accessed on 27-05-2012).
[14]CERT/CC Statistics, [Online] Available: http://www./CERT Statistics Full Statistics.mht (Accessed on 27-05-2012).