Machine Learning Classification Algorithms to
Recognize Chart Types in Portable Document Format
(PDF) Files
V. Karthikeyani
Department of Computer Science, Government Arts College, Salem-8. TamilNadu. India
S. Nagarajan
Department of Computer Science, K.S.R College of Arts and Science, Tiruchengode,
Namakkal (Dist)-17 Tamil Nadu, India
ABSTRACT
Chart recognition system from PDF files is a relatively young research field where techniques and algorithms are proposed to identify type of charts and interpret them. This paper focus on recognition of chart type that is a part of PDF document using texture features and classification algorithm. Eleven types of texture features and three classifiers, namely, Multilayer perceptron, support vector machine and K nearest neighbour, are used. Performance analysis of the proposed chart type recognition systems show that texture features for chart type recognition has promising future and produces best result while using KNN and SVM algorithm.
Keywords
Chart Classification, Texture Feature, Neural Network. Support Vector Machine, K Nearest Neighbour Classifier.
1. INTRODUCTION
Portable Document Format, commonly referred to as PDF, is open standard for document exchange, created by Adobe systems in 1993. A typical PDF file encapsulates many objects which contain text (in different fonts and size), graphics, tables, figures and other information needed to display the content of a document. Usage of PDF files offers two main advantages. The first advantage is that it preserves the layout and design of the document as determined by the author and the second reason is that it is entirely self-contained, that is, all information, such as the various fonts, needed to display the files is integrated inside the format itself. Moreover, a PDF file has the advantage of representing documents in an application, operating system, software and hardware independent format. These advantages have made PDF the most used format and is now considered as a universal document format.
Document analysis is a field of research which discovers knowledge from a scanned document image. Owing to the wide usage of PDF files by common people, researchers and industries, document analysis is also been extended to PDF files. As a consequence, the need for ‘conversion tools’ that can extract text, tables, figures and graphs from PDF file is also growing. The need for conversion tools has arisen because many devices like embedded devices cannot handle PDF formats and online users and often have difficulty in reading multi-column documents.
Several researchers have focused on text knowledge extraction (data mining) of PDF and image documents ([10], [13]). This field is termed as text mining and many organizations internationally have already realized the potentiality of text mining. The process of text mining extract useful business knowledge from the unstructured documents by first converting
them into structured text and then use data mining techniques like clustering and classification on them to derive valuable insights. The accuracy of these converters depends on the efficiency of the segmentation algorithms that can separate different objects in a PDF.
However, on the other hand, only a few studies have devoted to extract images from PDF/image documents as it is more complicated and challenging. The difficulty arises because the graph objects consist of several small components which have features that are similar to text [2].Identification of graphs in a PDF file is composed of three steps. The first step is to locate the chart object, the second step is to extract the graph object and the third step is to identify the type of chart. The first two steps are dealt in [11]. This paper focus on the third step that is to identify the type of graph located from the PDF file using machine learning classification algorithms.
Graph or Chart classification is an area in image processing where the primary goal is to separate a set of chart images according to their visual content into one of a number of predefined categories. Eight types of charts are considered, namely, 2D, 3D bar chart, 2D, 3D pie chart, 2D, 3D doughnut chart, Line chart and mixed chart. The present work analyzes the applicability of three classifiers, namely, Multi Layer Perceptron (MLP), Support Vector Machine (SVM) and K Nearest Neighbour Classifiers for the recognition of eight chart types. The visual content of the graph image is identified using feature extraction step, where texture features that best represents the graph image are extracted and stored as feature vector. These feature vectors are then used to train and test the selected classifiers. The rest of the paper is organized as follows. Section 2 provides a brief discussion on some of the previous work in the related area, Section 3 presents the proposed methodology and Section 4 presents the results of experimentation. The study is concluded with future research ideas in Section 5.
2. PREVIOUS STUDIES
Hough Transformation [3], curvature estimation [15] and vector-based techniques [5] are also used for line graph recognition. It is well known fact that the usage of Hough transformation is computation expensive and do not work well with all types of charts. To solve this problem, a raster-to-vector conversion algorithm was used to identify three types of charts namely, 2D bar chart, 2D pie chart and 2D line chart [18].
Futrelle et al. [7] and [16] proposed a scheme for recognizing and classifying vector format graphics in PDF documents using techniques like spatial analysis and classified graphs into five categories namely, line, bar, curve, tree and other charts. Another method is based on pattern discovery algorithms that find local structures appearing frequently ([12], [9]), and these structures are used as features. The pattern-discovery-based method has an advantage in that it can make use of unlabelled data. Yet another approach is to use kernel methods such as Support Vector Machines (SVMs).
From the literature study, it was understood that existing algorithms have two main drawbacks. First, most of the methods are designed for a specific chart type only. Moreover, the existing techniques assume the availability of predefined structural models and constraints of all types of charts. To solve these problems, classifiers that use texture features are used to recognize the chart type. The methodology used is discussed in the following section.
3. METHODOLOGY
Chart classification system involves the processing of two main tasks, feature extraction (extracts image features and forms a feature vectors) and classification (uses the extracted features to discriminate the classes). Both these processes take place after locating the chart image in the PDF document. Feature extraction task is used to identify a set of texture features from the located graph images. It is a well-known fact that when small portions of a bigger unit are independently processed, texture features provide a better description of the selected region [8]. It captures the spatial variations in intensities of an image which form certain repeated pattern. These features are extracted for all chart images in a PDF database. The three classifiers analyzed in this paper are MLP, SVM and KNN, which are used to perform a multi-class classification of chart images. Each of these steps are explained below.
3.1.
Features Extracted
The GLCM (Gray Level Co-Occurrence Matrix) features were used as texture features in this study. The selected features are area, median, minimum and maximum intensity, contrast, homogeneity, energy, entropy, mean, variance, standard deviation and correlation. A brief explanation of each of these features is given in this section. Since its invention, the GLCM has played vital role in many texture based image analysis applications ([14], [1]).
The GLCM uses co-occurrence matrix to extract texture features of an image using statistical equations. A co-occurrence matrix is a matrix or distribution that is calculated from the distribution of co-occurring values of an image at a given offset. Features generated using this technique is usually called Haralick features, named after its founder. Area of an image in square pixels is calculated by multiplying number of rows and number of columns of the image. The Minimum, maximum intensity and median values are calculated by considering all the pixels in the image. Equation (1) is used to calculate the contrast of an image.
1 0 , 2 , N ji
P
iji
j
contrast
(1)In this equation, three conditions arises. The first is when i and j values are equal, indicating that the pixels are in diagonal positin and its neighbours are similar and (i-j) = 0. The second condition is when (i-j) is between 0 and 1. This indicates a small contrast difference between the pixels and weight value of 1 is used. The third condition is when the difference between i and j is 2. This indicates that the contrast is increasing in which case the weight is assigned a value 4. Thus, the weights continue to increase exponentially as (i-j) increases. The Homogenity feature is calculated as
1 0 , 2 ,1
N j i j ij
i
P
Homogenity
(2)When the contrast in a image window is low, energy is best calculated using a measure called Homogeneity. The energy of an image is calculated as described below. To calculate energy (also called uniformity) first the Angular Second Moment (ASM) is to be calculated. Both ASM and Energy use each Pij
as a weight for itself.
1 0 , 2,
N ji
P
i
j
ASM
(3)Energy is now calculated as the square root of the ASM (Equation 4) and the entropy is calculated using the formula given in Equation 5.
ASM
Energy
(4)
10
, ,
1
, Nj
i
P
i jnP
ijEntropy
(5)The GLCM mean, variance and standard deviation for the horizontal and vertical directions are calculated as below.
1 0 , , 1 0 , ,,
N ji ij
j N
j
i ij
i
i
P
j
P
Mean
(6)
1 0 , , 2 1 0 , , 2,
var
N ji j ij
j
N j
i i ij
i
P
j
P
i
iance
(7) 2 2,
tan
j j i iion
dardDeviat
S
(8)The Correlation feature is calculated using Equation (9)/
1 0, , 2 2
,
N j i j i j i j ij
i
P
n
Correlatio
(9)Struct FeatureVector {
float feature1; float feature2; float feature3; float feature4; float feature5; float feature6; float feature7; float feature8; float feature9; float feature10; float feature11; float feature12; int target;
}
3.2. Classifiers
As mentioned earlier, three classifiers are used to perform a multi-class classification during chart recognition process. The working of the three classifiers is discussed in this section.
3.2.1 SVM Classification
SVM is a classification algorithm based on optimization theory and initially developed by [4]. Here, an object is viewed as an n-dimensional vector and it separates such objects with an n-1 dimensional hyperplane. This is called a linear classifier. There are many hyperplanes to classify data and this paper is also emphasized on finding out the possibility of maximum margin between the two data sets. (Figure 1)
[image:3.595.309.519.285.538.2]The figure shows three Hyperplanes in 2-dimentional space. H3 does not separate the two classes; H1 does, with a small margin and H2 with the maximum margin.
Figure 1: Example of SVM
3.2.2 MLP Classification
The MLP neural network has feedforword architecture within input layer, a hidden layer and an output layer. Multi-Layer Perceptron (MLP) with a back propagation learning algorithms is chosen for the proposed system because of its simplicity, robustness and high computation rates.
It is assumed that that training dataset access of l pairs (xi, yj)
where xi is a vector containing the pattern, while yi is the class
of the corresponding pattern. In our case an 8-class task, yij can
be coded 1 to 8(for identifying eight different chart) [17]. The MLP model consists of an input layer that accepts the input neuron i used in the classification, hidden layers and an output layer. A summation of each neuron j in the hidden layer by its input neurons xi, after multiplying the connection weight wij
gives the output yj as a Activation function of the sum, that is
i j ii
f
w
x
y
, (10)where f is the sigmoid or hyperbolic tangent transfer function. Using the Back propagation training algorithm, the weights are minimized based on the squared differences between the actual and desired output values in the output neurons given by
22
/
1
d
iy
iE
(11)Where yj is the actual output of the neuron and dj is the desired
output of neuron j.
3.2.3 KNN Classification
The K-Nearest Neighbour(KNN) machine learning algorithm is the most frequently used algorithm in many applications. This algorithm uses distance measures during classification and assigns an data object to a category which is closest to the data being examined. When K is 1, the KNN algorithms works like nearest neighbour algorithm. In general scenario, the Euclidean distance measure is used to calculate the distance between two data points and is given in Equation (12).
N
i
i
i
q
p
q
p
d
1
2
,
(12)where d is distance and pi (or qi) is the coordinate of p (or q) in
dimension i
3.3.
Chart Classification System
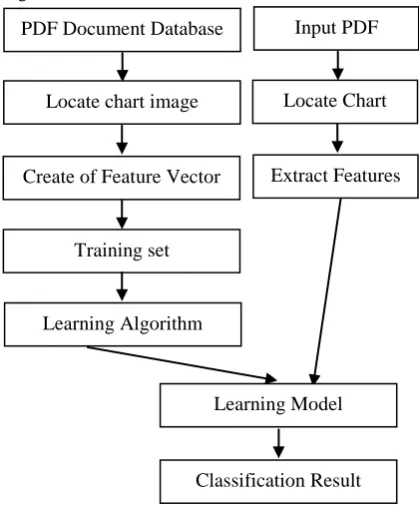
The schematic block diagram of scientific chart image recognition system consists of various stages as shown in Figure 2.
Figure 2: Proposed Chart Classification Model
The proposed chart classification system thus considers the use of the three machine learning algorithms to classify the charts into eight types. The input data for a classification task is a set of 11 texture features arranged as in row-wise fashion (records). Each record, otherwise termed as instance or example, is described by as(X, y) where X is the attribute set and y is a special attribute, designated as the class label (also known as category or target attribute).
The classification step is then defined as a task of learning a target function ‘f’ that maps each attribute set X to one of the predefined class labels y. The target function is also known informally as a classification model and is useful for classification purpose. The classifier then uses a systematic approach to build the classification learning model from an input data set using a learning algorithm. The main goal of the learning algorithm is to identify a model that identifies the best correlation relationship among the feature sets and class categories of the input data. Satisfying this goal provides dual advantages. The first is it makes sure that both the input data
PDF Document Database
Locate chart image
Create of Feature Vector
Training set
Input PDF
Locate Chart
Extract Features
Learning Algorithm
Learning Model
[image:3.595.97.247.353.459.2]and learning algorithm fit each other in an efficient manner and the second it to improve the performance prediction while supplied with new records.
The classifier is trained using a data set (training set) that consists of records with target category provided. The test dataset consist of records with no knowledge of the target category. The classifier uses the trained knowledge and performs the classification.
4. EXPERIMENTAL RESULTS
Experiments were carried out with a dataset having 155 images belonging to all seven kinds of charts (Table 1). All the images are 256*256 RGB color images. Experiment were conducted using a Pentium IV dual processor with 512MB RAM. Zhou and Tan [21] used feed forward backpropagation neural network for chart type recognition. This model, referred to as Zhou Model, used model based matching algorithm for chart recognition. The performance of the classifiers proposed in this paper is compared with Zhou model.
Table 1: Details on Dataset
Chart Type
No of Charts
Chart Type
No of Charts
2DBar chart 40 Doughnut 2D 7
3DBar chart 16 Doughnut 3D 11
2D Pie chart 13 Line 35
3D Pie Chart 20 Mixed Chart 13 The performance of system is analyzed based on error rate, classification accuracy and speed of classification. During experiments, a 10-fold cross-validation method is used. The average results were taken as the final outcome. As a preprocessing step, all the image features were calculated prior to classification and was converted to a feature vector which was given as input to the classifiers. The formula for calculating error rate is given below
100 Size
raining
prediction y incorrectl .
Rate
x
T of No
Error
The accuracy of the classifiers is calculated as 1 – Error Rate. An effective classifier should reduce the error rate while increasing the accuracy. The time taken by the classifiers to classify an input chart image into any one of the selected seven chart types is taken as the speed of classifier.
4.1.
Error Rate
[image:4.595.331.517.119.258.2]Table 2 shows the error rates obtained by the selected classifiers using the 11 derived texture features.
Table 2 : Error Rate
Classifier Error Rate (%)
MLP 0.30
K-NN 0.22
SVM 0.23
Zhou 0.19
One of the primary aims of automatic chart recognition systems is to achieve low error rates. With regard to this, it could be seen from the results that K-NN classifier produces the lowest error rate, followed by SVM and then MLP. While considering the efficiency gain obtained with respect to error rate, the KNN classifier produced 26.67%, while it was 4.35% while comparing KNN and SVM.
4.2.
Classification Accuracy
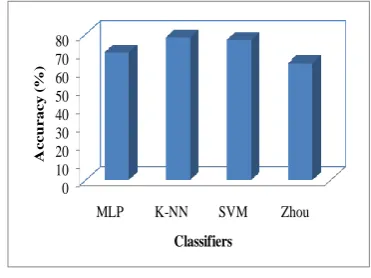
The next performance metric used to evaluate the proposed classification models is accuracy. Figure 3 shows the results obtained by all the proposed chart classifier systems.
0 10 20 30 40 50 60 70 80
MLP K-NN SVM Zhou
A
c
c
u
r
ac
y
(%)
Classifiers
Figure 3: Classification Accuracy
The results with regard to classification accuracy again prove that the KNN classifier produces improved classification results when compared with MLP and SVM while using texture features. The accuracy obtained by KNN classifier (78.06%) will make a great impact while using in a chart recognition system when compared to MLP (69.68%) and SVM (76.77%).
4.3.
Classification Speed
[image:4.595.373.481.403.481.2]The classification time of a model is calculated as the sum of training and testing time. The results obtained with respect to classification time are shown in Table 3.
Table 3 : Classification Speed (Seconds)
Classifier Time Taken
MLP 8.38
K-NN 0.26
SVM 0.31
Zhou 0.52
In par with the previous results, the execution time of the KNN classifier base system is lower when compared to MLP and SVM. Moreover, the experimental results further prove that the usage of MLP, KNN and SVM algorithms showed significant improvement when compared with the base model (Zhou Model). Thus, from the various results it can be understood that KNN classifiers using texture features produce best PDF chart classification results.
5. CONCLUSION
Research on chart recognition is relatively young field and this paper analyzes the use of texture features with three frequently used classifiers. While all the three classifiers produce high accuracy and low error rate, the performance of KNN classifier shows promising results. In future, more features with respect to shape and text are to be considered and methods for ensemble classification in chart classification are also to be probed.
6. REFERENCES
[1] Caylak, E. (2010) The studies about phonological deficit theory in children with developmental dyslexia, Review. Am. J. Neurosci., Vol. 1, Pp. 1-12.
[image:4.595.110.231.598.689.2]Document Analysis and Recognition, ICDAR 2007, Pp. 619-623.
[3] Conker, R.S. (1988) Dual Plane Variation of the Hough Transform for Detecting Non-Concentric Circles of Different Radii, CVGIP, Vol. 43, Pp 115-132.
[4] Cortes, C. and Vapnik, V. (1995) Support Vector Networks, Machine Learning, Vol. 20, Pp. 273-297.
[5] Dori, D. (1995) Vector-Based Arc Segmentation in the Machine Drawing Understanding System Environment, IEEE Transactions on PAMI, Vol. 17, No. 11, Pp 1057-1068, 1995.
[6] Futrelle, R.P., Kakadiaris, I.A., Alexander, J., Carriero, C.M., Nikolakis, N. and Futrelle, J.M. (1992) Understanding diagrams in technical documents, IEEE Computer, Vol. 25, Issue 7, Pp. 75-78.
[7] Futrelle, R.P., Shao, M., Cieslik, C. and Grimes, A.E. (2003) Extraction, layout analysis and classification of diagrams in PDF documents, Intl. Conf. Document Analysis & Recognition. Edinburgh, Scotland, Pp. 1007-1014.
[8] Haralic, R.M., Shanmugam, K. and Dinstein, I. (1973) Textural features for image classification, IEEE Transactions on Systems, Man and Cybernetics, Vol. SMC-3, No. 6, Pp. 610-621.
[9] Inokuchi, A., Washio, T. and Motoda, H. (2000) An Apriori-based algorithm for mining frequent substructures from graph data, Proceedings. of the 4th PKDD, Pp.13–23.
[10]Islam, R., Saha, R.S. and Hossain, A.R. (2009) Automatic Reading from Bangla PDF Document Using Rule Based Concatenative Synthesis, International Conference on Signal Processing Systems, IEEE Computer Society, Pp. 521-525.
[11]Karthikeyani, V. and Nagarajan, S. (2011) Scientific Chart Image Property Identification using Connected Component Labeling in PDF document, 3rd International Conference on Electronics Computer Technology, Kanyakumari, India, Vol.4, Pp.209-212.
[12]Kramer, S. and Raedt, L.D. (2001) Feature construction with version spaces for biochemical application. Proceedings of the 18th ICML Conference,
[13]Martinez-Alvarez, R.P., Costas-Rodriguez, S., Gonzalez-Castao, F.J. and Gil-Castieira, F. (2010) Automated Document Conversion System for Simple Multimedia Platforms, 7th IEEE Consumer Communications and Networking Conference (CCNC), Pp. 1-2.
[14]Omaima, N.A. (2010) Improving the performance of backpropagation neural network algorithm for image compression/decompression system, J. Comput. Sci., Vol. 6, Pp. 1347-1354.
[15]Rosin, P.L. and West, G. A. (1989) Segmentation of Edges into Lines and Arcs, Image and Vision Computing, Vol. 7, No.2, Pp 109-114.
[16]Shao, M. and Futrelle, R.P. (2006) Recognition and Classification of Figures in PDF Documents, W. Liu and J. Lladós (Eds.): Selected papers from Workshop on Graphics Recognition, GREC 2005, LNCS 3926, Springer, Pp. 231-242.
[17]Smach, F., Atri., M., Miteran , J. and Abid, M. (2005) Design of a Neural Networks Classifier for Face Detection, World Academy of Science, Engineering and Technology, Vol. 11, Pp. 123-127.
[18]Song, J., Su, F., Chen, J., Tai, C. L. and Cai, S. (2000) Line net global vectorization: an algorithm and its performance analysis, IEEE Conference on Computer Vision and Pattern Recognition, South Carolina, Pp. 383-388.
[19]Yokokura, N. and Watanabe, T. (1997) Layout-Based Approach for extracting constructive elements of bar-charts, GREC'97, Pp. 163-174. 1997
[20]Zhou, Y. and Tan, C.L. (2001a) Hough-based Model for Recognizing Bar Charts in Document Images, SPIE conference on Document image and retrieval, Vol. 4307, Pp. 333-340.