Handwriting Identification using Connected Component
Analysis and 2D- Discrete Wavelet Transform
S Arunkumar
Dept of Information TechnologyInstitute of Engineering and Management, Kolkata. India.
Pallab Kumar Sahu
Dept of Computer Science andEngineering Institute of Engineering and Management, Kolkata. India
Sudeep Gorai
Dept of Computer Science andEngineering Institute of Engineering and Management, Kolkata.India
ABSTRACT
Handwriting identification has become a major area for research these days. It refers to the ability of the computer to receive the image of the handwritten character from sources such as paper documents, touch screens, etc and compare it with an existing database. Handwriting and hand-printing analysis is applied to many types of investigation: fraud, homicide, suicide, drug trafficking and clandestine labs, sexual offences, threats and extortion, blackmail, arson, bombings, and theft. It is also implemented in many subjective handwritten exams in cases of discrepancies. This paper is aimed at obtaining a unique and unambiguous approach to do the same using the Discrete Wavelet Transform. Each and every character scribbled is treated as a specific shape and hence its corresponding features are extracted using DWT. These features are used to compare the handwritten characters of various individuals with the database. The algorithm developed in this paper is done using the English script calligraphy and could be comfortably applied to every other script using the same procedure.
Keywords
Connected Components, Minimum Bounding Rectangles, Discrete Wavelet Transform, Aspect Ratio and Euclidean Distance.
1.
INTRODUCTION
Many papers have been published in handwriting identification. Multichannel Gabor filter and texture analysis has had immense applications in this field [1] [2]. Wavelet filters has found its applications in offline signature verifications [3] where again each signature is treated as curve pregnant with a specific pattern inside it.
Handwriting identification is unlike signature verification where only certain characters of an individual„s handwriting comes into play. It is quite easy to forge one‟s signature than to forge one‟s handwriting. A handwritten document comprising of several lines usually involves almost all the characters of a particular script and thus one needs to imitate the style of each and every character of an individual‟s handwriting, which is expected to be quite difficult. This paper is aimed at checking each and every character of an individual‟s handwriting separately and thus obtaining a
The basic concepts considered in this paper are (i) that no two people can have the same handwriting style and (ii) that every time an individual writes, his or her handwriting style encounters a slight variation [4].One of the main targets of this paper is to identify the threshold limit for the variations in the handwriting styles of an individual using the Discrete Wavelet Transform and thus identifying an individual‟s handwriting.
The Discrete Wavelet Transform has wide applications in the field of human biometrics [5] [6].This paper is aimed at obtaining a robust approach by carefully scrutinizing the values of approximate co-efficient and details matrix of each and every character of an individual‟s handwriting by passing it through low and high pass filters respectively. The complexity of the algorithm is usually associated with the type of language used. Complexity increases in those languages where the numbers of characters are more. For example in the English script we have only 52 characters to deal with (considering both upper case as well as lower case).
2.
PROPOSED METHOD
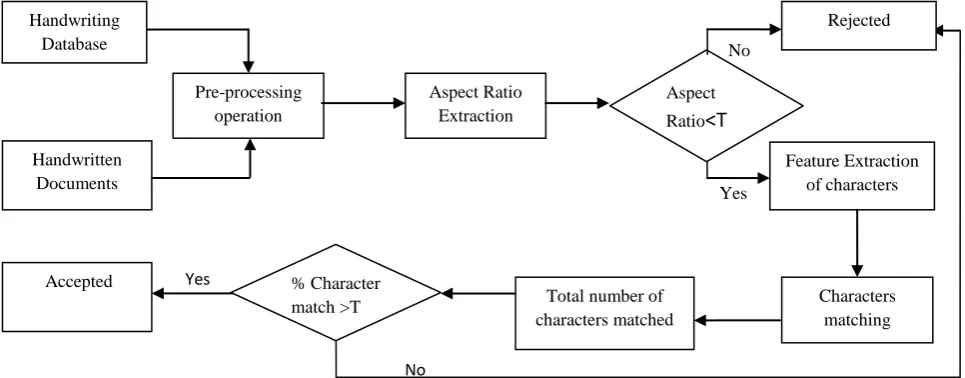
The proposed method is depicted by a flowchart shown in Fig(1).
2.1
Database:
Yes
[image:2.595.57.540.64.253.2]No
Fig 1: Flowchart of the proposed algorithm
2.2
Preprocessing:
[image:2.595.344.518.519.699.2]Each document scanned (Fig (2)) is first converted into gray scale image. The gray scale image is then converted into binary image (Fig (3)) such that the background is assigned with zero intensity value and the handwritten part script is assigned with the intensity value one. Thresholding is done to separate the image into two sets: a) the background b) the script. Threshold is determined as the average intensity value of the total image. Since the scanned document is a white paper (as in our case) therefore the set above the threshold intensity is considered to be the background and the remaining as script.
Fig 2: The scanned handwritten document
Fig 3: The image converted into binary.
2.3
Aspect Ratio (AR) determination using
Connected Component Analysis:
A Minimum Bounding Rectangle (MBR), the smallest rectangle enclosing a connected component, is calculated for each and every connected component, based on the MBR, a Clipping Window is defined such that it‟s width is determined as the sum of the widths of all MBRs divided by the total number of characters (which in this case is 33) and the height is taken as the maximum of all the MBRs. This means that a unique Clipping window is defined for every individual. The Aspect Ratio (AR) is determined by a
No
Yes
feature: [Hmax/Wavg]where Hmax and Wavg denotes the
maximum height of all MBRs and the average width of all MBRs respectively. Characters when matched with the database are first compared on the basis of their ARs. They are sent for further matching only if their AR difference is less than a suitable threshold value which is obtained by comparing the documents of the first four individuals with the database. In cases where dimensions of the characters in the document are bigger as compared to that of the database, the former is resized. Only those MBR‟s are considered whose width is greater than a particular value, this is done to reduce noise(Punctuation marks such as dot, comma etc are thus neglected).
The above defined clipping window is used to extract each and every character from a given sentence(Fig4).This may also result in error prone extraction of characters(Fig5).This however can be ignored in cases where the same error is encountered in the individual‟s document as well.
Fig 4: Proper clipping of character‘s’ from a given sentence.
Handwriting Database
Pre-processing operation Handwritten
Documents
Aspect Ratio Extraction
Feature Extraction of characters
Total number of characters matched
Characters matching % Character
match >T Accepted
Rejected
Aspect Ratio
<T
Fig 5: Error prone clipping: the characters „o‟ and „g‟ both has been clipped by the clipping window.
2.4
Feature Extraction:
DISCRETE WAVELET THEORY:
The basic idea behind wavelets is to scrutinize a signal according to scale. It has found wide applications in the area of signal processing, numerical analysis and mathematics during recent years [7] [8]. The wavelet transform could also be considered as an advanced technique of signal and image analysis. It was developed as an alternative to the short time Fourier [9] to overcome problems related to its frequency and time resolution properties. The basic idea of DWT is to provide the time-frequency representation. The 2D-DWT represents an image in terms of a set of shifted and dilated wavelet functions ψ LH ,ψ HL ,ψ HH and scaling functions φ LL that form an orthonormal basis for L2 (R2 ) . Given a J-scale DWT, an image x(s, t) of NxN is decomposed as: x(s,t)= 𝑁𝑗 −1𝑘,𝑖=0𝑢J,K,i фLL J,K,i(s,t) + 𝐵έ𝐵 𝑗 =1 𝑁−1𝑘,𝑖=0 𝐵έ𝐵𝜔B j, k,iψB
J,K,i(s,t) …………..(1)
The function 1 can be described as: ФLL J,K,i(s,t) ≡ 2-j/2ф(2-j
s-k,2-jt-i),ψBJ,K,i(s,t),ψBJ,K,i(s,t) ≡ 2-j/2ψB
(2-js-k,2-jt-i),BέB,B ……..(2)
LH, HL and HH used here are called wavelet or DWT sub-bands. uJ ,k,i = ∫ ∫ x(s, t)φ J ,k,i dsdt is a scaling coefficient and wB j,k,i=∫∫x(s,t) ψB j,k,idsdt denotes the (k,i)th wavelet
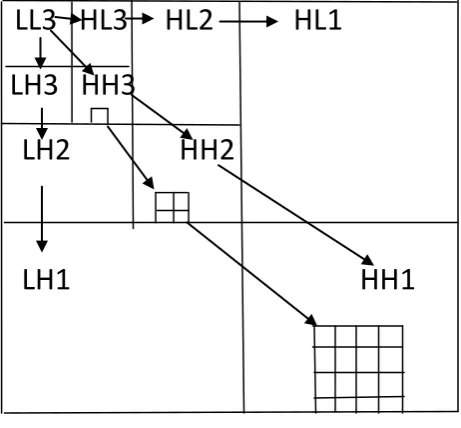
coefficient in scale j and sub-band B. Fig(6) shows the scaling concept in wavelet transform
LL3 HL3 HL2 HL1
LH3 HH3
LH2 HH2
LH1 HH1
Fig 6 :Scaling concept of 2D-DWT
The wavelet transform describes a multi-resolution
decomposition process in terms of expansion of an image onto a set of wavelet basis functions. Discrete Wavelet Transformation has its own excellent space frequency
localization property. Applying DWT in 2D images corresponds to 2D filter image processing in each dimension. The input image is divided into 4 non-overlapping
multi-resolution sub-bands by the filters, namely LL1
(Approximation coefficients), LH1 (vertical details), HL1 (horizontal details) and HH1 (diagonal details). The sub-band (LL1) is processed further to obtain the next coarser scale of wavelet coefficients, until some final scale “N” is reached. When “N” is reached, we‟ll have 3N+1 sub-bands consisting of the multi-resolution sub-bands (LLN) and (LHX), (HLX) and (HHX) where “X” ranges from 1 until “N”. Generally most of the Image energy is stored in these sub-bands. Here the „haar‟ wavelet is used for all the subsequent operations in the „Feature Extraction‟ process.
After applying DWT, a feature vector is defined for each and every character. Since we have decomposed the image up to
the3rd level therefore the feature vector comprises of 10
(3N+1) elements. Of the 10 elements the first 9 elements consists of the Average Intensity Value (AIV) of the matrixes that are obtained when passed through high pass filters, which are of course the horizontal, vertical and diagonal details
matrix obtained at each level, whereas the 10th element
consists of the AIV of the approximate co-efficient matrix
(the sub-band obtained when passed through the low pass filter). The feature vector is thus defined as [h1 h2 h3 d1d2 d3
v1 v2 v3 a]. Where hi,, di and vi are the AIVs of the
horizontal, diagonal and vertical details matrix at the ith level
respectively and a is the AIV of the approximate coefficient matrix. This feature vector is used as a signature to each and every character.
Fig 7: Fig (a)the diagonal details image,Fig (b)the horizontal detaisl image,Fig (c)the vertical details image and Fig (d)the image of the character ‘g’ respectively.The details shown are of the first level of decomposition.
2.5
Euclidean Distance:
Euclidean distance is given by Eq. (3) and is used to compute the match value between two given vectors. A perfect match is implied by a value zero. The signature tends towards mismatch as the distance value increases.The Euclidean distance is calculated between the feature vectors of each and every character of a certain number of individuals to obtain a
threshold distance value for a particular character. Eg Ta is the
threshold distance value for lower case „a‟. Similarly thresholds of all the 52 characters are obtained.
𝐷𝐸𝑢𝑐𝑙𝑖 = 𝑁 (𝑥-y)2 ………(3)
Fig (a) Fig (b) Fig (c) Fig (d)
Fi
F
[image:3.595.313.525.453.536.2] [image:3.595.54.285.478.692.2]2.6
Percentage Character Match:
Once the thresholds for the characters are determined two vectors comprising 26 elements each are defined as follows:
A= [ta,tb,tc. . . .tz] and B = [Ta,Tb,TC. . . . .Tz]
The vector A consists of the thresholds of the smaller case handwritten characters of 26 alphabets whereas the vector B consists of the thresholds of the upper case handwritten characters.
When a given individual‟s handwriting is tested with the database two vectors are formed as following.
T1 = [ea,eb,. . . .ez] and T2 = [eA,eB.. . . .eZ]
The above two vectors consists of the Euclidean distances of lower case and upper case of handwritten characters of an
individual respectively when compared with the database.The
vectors T1 and T2 are compared with A and B respectively and
new vectors R1 and R2 are formed. Such that:
{R1(i)=1 for T1(i)<A(i), Else 0}
Similarly: {R2(i)=1 for T2(i)<B(i) , Else 0}
Thus R1 and R2 are vectors comprising of elements „0‟ and
„1‟ respectively. The percentage of matching is thus defined in
Eq( 4).
[ 26𝑖=1𝑅1 𝑖 + 26𝑖=1𝑅2 𝑖 ]
52
x
100………….(4)
Thus a character match threshold is obtained to determine the minimum number of characters that needs to match to identify an individual‟s handwriting. An individual‟s handwritten document is considered to be his or her own if it‟s percentage character matching is greater than the threshold.(Note: an individual‟s handwritten document may not include all the characters of a particular script, in that case the formula for percentage matching changes, but the threshold value remains almost the same)
3.
RESULTS
The algorithm was tested on a database consisting of handwritings of 30 individuals .The threshold vectors A=[ta,tb,tc…...tz] and B=[Ta,Tb,TC…...Tz] was
obtained by calculating the mean of each elements of vectors T1 = [ea,eb,…...ez] and T2 =[eA,eB…...eZ] respectively from
the first four individuals each having ten documents(apart from the one in the database).Example: (4𝑋 10) 𝑒𝑎 is calculated to
determine ta(4X10 means 4 individual having 10 documents
each). The obtained threshold vector was now tested again
with the same set of (first four) individuals to obtain the
threshold value percentage character match. The algorithm
was then applied to the remaining databasewith the obtained
set of thresholds. The results obtained are shown in Table 1. All the results were calculated using MATLAB 7.5.0.342 (R2007b).
4.
CONCLUSION
The average efficiency is highest when calculated based on the parameter AR (Aspect Ratio), but the FAR (False Acceptance Ratio) reduces considerably when the parameters LCC (Lower Case Character) or UCC (Upper Case Character) are considered for matching. FAR is least when the matching is done based on the criteria UCC, this is so because UCC seldom encounters the error shown in Fig (4).
The results obtained could be further improved if worked on a larger database. The thresholds obtained would then turn up to give more efficient results.
In some scripts where the characters are well separated and equally spaced Eg. like Chinese, Tamil, Telegu etc. this algorithm may prove out to be more efficient. These languages would seldom encounter the error shown in Fig( 4). The future work remaining is to increase the size of the feature vector (by increasing the number decompositions further) and to study the size (level of decomposition) at which the results obtained would turn out to be more efficient. Moreover efforts to increase the time complexity of the above algorithm would also be emphasized in the near future
5.
REFERENCES
[1] H.E.S Said, T.N Tan and K.D. Baker “Personal
Identification based on Handwriting”, Pattern
Recognition, vol 33. No 1, pp 146-169,2000.
[2] Shashank Mathur,Vaibhav Aggarwal,Himanshu Joshi
and Anil Ahlawat “Offline Handwriting Recognition using Genetic Algorithm”,International Book Series “Information Science and Computing”.
[3] Samaneh Ghandali, Mohsen Ebrahimi Moghaddam
“Off-Line Persian Signature Identification and Verification based on Image Registration and Fusion”, Journal of Multimedia, Vol 4, No 3,2009.
[4] Somaya Al-Ma‟adeed, “Text-Dependent Wrirter
Identification for Arabic Handwriting”.
Criteria FRR(False Rejection Ratio)
percentage
FAR(False Acceptance Ratio)
percentage
AVER AGE EFFIC IENC Y (%)
Aspect Ratio(AR)
0% 12.73% 87.3%
Lower Case Characters
(LCC) only
26.66% 2.33% 71.1%
Upper Case Characters
(UCC) only
16.66% 1.33% 82.01%
UCC+LCC 21.66% 1.78% 76.56%
AR+LCC+ UCC
[5] Ms. Lenina Vithalrao Birgale, Manesh Kokare “Iris Recognition Using Discrete Wavelet Transform”,
International Conference on Digital Image
Processing,2009.
[6] Md. Imdadul Islam,Nasima Begum, Mahbul Alam and
M.R.Amin “Fingerprint Detection Using Canny Filter and DWT a New Approach”, Journal of Information Processing Systems, Vol 6, No 4,2010.
[7] Daubechies”Orthonormal bases of compactly supported wavelets”. Comm on pure and Applied Mathematics,vol XLI,pp909-996,1998
[8] O Stromberg, “A modified Franklin system and Higher order splines as unconditional basis for Hardy spaces”in Proc. Conf in harmonic Analysis in Honor of antoni Zygmud(Beckner W et. Al ed),vol II.Wadworth Mathematical Series, 1983.
[9] S.G. Mallat “A Theory for multi-resolution signal decomposition: the wavelet representation”, IEEE Transactions on Pattern Analysis and Machine
intelligence !!:674-693,189
Photogrammetric”,Enginnering and Remote Senesing 64:pp 1171-1177,1998.