Value-eroding Teacher Behaviors Scale: A Validity
and Reliability Study
Zeynep Arseven
1, Abdurrahman Kılıç
1, Şeyma Şahin
2,*1Department of Educational Sciences, Faculty of Education, Duzce University, Turkey 2Institute of Social Sciences, Department of Educational Sciences, Duzce University, Turkey
Copyright©2016 by authors, all rights reserved. Authors agree that this article remains permanently open access under the terms of the Creative Commons Attribution License 4.0 International License
Abstract
In the present study, it is aimed to develop a valid and reliable scale for determining value-eroding behaviors of teachers, hence their values of judgment. The items of the ‘Value-eroding Teacher Behaviors Scale’ were designed in the form of 5-point likert type rating scale. The exploratory factor analysis (EFA) was conducted to determine the construct validity of the scale. Afterwards, the validity of the structure obtained through EFA was tested by using the confirmatory factor analysis (CFA). To determine the reliability of the scale, the Cronbach's alpha was calculated, and an item analysis was performed based on the corrected item total correlation. Based on the findings obtained from the validity and reliability studies of the scale, it can be said that the scale is a valid and reliable measuring tool to be used for measuring teachers’ value-eroding behaviors.Keywords
Values, Value-eroding Teacher Behaviors, Teacher Behaviors Scale, Validity, Reliability1. Introduction
Value can be explained as “the level of relationship, behavior pattern, and perspective that an individual represents/desires to represent when he or she gets in contact with his or her own kind and all other beings beyond and the meaning he or she attributes to the relationship” [1]. Values are principles and standards that guide behaviors and actions, and shape the manners and attitudes of individuals in different situations. Values act as the source of individuals’ correct behaviors by carrying the function of preventing their unapproved behaviors and leading them to obey social norms. Ideally, positive values and attitudes manifest well-adjusted behaviors [2, 3, 4, 5, 6].
There are various research findings which show that teachers’ values influence the students’ behaviors [7, 8, 9, 10, 11, 12]. The values that teachers hold influence their teaching strategies, teaching styles, choices of content,
disciplinary practices, and attitudes and behaviors towards students [13]. At school, children observe numerous things they set out and do not set out to learn and every individual thing they observe contributes to their developing an understanding of good, bad, right, and wrong [14, 15]. If a teacher does not have the values that are desired to be practiced in teaching activities, he might not only fail in being a good model for the students, but he could also cause the values held by students to become dim and even to disappear [16, 17, 18]. For this reason, determining our teachers’ values is considered to be highly important.
Among various methods used for measuring values, one of the two most frequently used tools in social psychology is Rokeach’s List of Values, and the other one is the Value Survey by Schwartz. In our country, there are several studies conducted to determine the values possessed by teachers by using Rokeach’s List of Values and Schwartz’s Value Survey [2, 19, 13, 20, 21, 22, 23, 12]. However, there are only a limited number of scale development studies aimed at determining teachers’ values. The “Pedagogical Values Scale” developed by Tomul and Çelik (2014) [24] consists of 42 items determined by Husu and Tirri (2007) and three factors named as “social, individual and relational values”.
Tunca and Sağlam (2013) [25] developed the “Teachers'
Professional Values Scale” consisting of four factors as “showing respect to differences”, “individual and social responsibility”, “being against violence”, and “being open to cooperation” for primary school teachers. The “Moral Virtues Scale” developed by Balay (2011) [26] to determine the moral value orientations of preservice teachers consists of the factors of respect, justice, loyalty, courage, honesty, grace, and trust. In addition, there is the “Teachers’ Ethical Values Scale according to Student Perception” developed by
Gündüz and Coşkun (2012) [27].
tool for measuring teachers’ values from the perspective of teachers will contribute to filling this gap in the literature. Based on this need, in the present study, it is aimed to develop a valid and reliable scale for determining value-eroding behaviors of teachers, hence their values of judgment.
2. Method
2.1. Study Group
Exploratory and confirmatory factor analyses of the “Value-eroding Teacher Behaviors Scale” were conducted on different samples. The exploratory factor analysis of the scale was conducted on 310 teachers who worked at primary, secondary, and high schools in the province center of Düzce in the academic year of 2014-2015. In the group, 58.38% of the participants were female (n=181) and 41.61% were male (n=140).
The confirmatory factor analysis of the scale was conducted on 349 teachers who worked at primary, secondary, and high schools in the province center of Düzce in the academic year of 2015-2016. In the group, 59.31% of the participants were female (n=207) and 40.69% were male (n=142). Tabachnick and Fidell (2007) [28] regard a sample size of 300 as “good”, 500 as “very good”, and 1000 as “excellent” for factor analysis. According to these criteria, it can be said that the sample size of the present study was appropriate for factor analysis.
2.2. Data Collection and Analysis
The first step of the item writing stage of the study was to review the related literature. Besides, the qualitative studies of the researchers entitled “A Study of Teacher Behaviors in Terms of Values Education Based on Teachers’ Opinions” and “The Impact of Primary School Teachers on Shaping the Future of Individuals” were also taken as reference for item writing. Within the scope of the mentioned research, semi-structured interviews were conducted on 12 teachers working at primary, secondary, and high schools. As a result, it was found that the negative teacher behaviors that were grouped under 22 categories eroded 10 core values. A question pool of 72 items was created by the three researchers by considering the results obtained in the mentioned study and the related literature.
One of the most commonly used methods for determining the content validity of scales is to take the opinions of experts [29]. For this purpose, the draft scale items were sent to three experts to be assessed in terms of content. The experts were asked to assess the items as “applicable”, “inapplicable”, and “needs revision” and to write the reasons for their evaluations in the explanation sections given next to the items. After revising some of the items based on the opinions of the experts and taking four items out of the scale, a final
trial form consisting of 68 items was created. The items of the scale were designed in the form of 5-point Likert type rating scale. The scale items were organized in the form of “1- I completely agree”, “2 - I agree”, “3 - I am not sure”, “4 - I disagree” and “5 - I completely disagree”.
The exploratory factor analysis (EFA) was conducted to determine the construct validity of the scale. Afterwards, the validity of the structure obtained through EFA was tested by using the confirmatory factor analysis (CFA). To determine the reliability of the scale, the Cronbach's alpha internal consistency reliability coefficient was calculated, and an item analysis was performed based on the corrected item total correlation.
3. Findings
3.1. Exploratory Factor Analysis
Factor analysis is a multivariate statistical method used to get lower number of uncorrelated variables from a large set of correlated variables. The exploratory factor analysis is a technique that is used to identify the underlying relationships between measured variables and to explore the underlining theoretical structure of the phenomena [30].
For testing the construct validity of the scale, first, the Kaiser-Meyer-Olkin and Barlett's tests were implemented and the results of these tests were found to be statistically significant (KMO = 0.861 and p < 0.01). According to Hutcheson and Sofroniou (1999) [31], a KMO value between 0.8 and 0.9 indicates a very good sample size. The significance of Bartlett’s values show that the data come from a multivariate normal distribution. Based on these values, it was decided that the exploratory factor analysis could be applied to the data.
When deciding on the number of factors, as a practical approach it can be preferred to examine the data and to obtain a factor structure that provides the best explanation of the data by trial [32]. In order to decide on the factor structure of the scale, both the single-factor structure and the multi-factor structures (2, 3, 4, 5, 6, 7, 8, 9, 10) were examined by exploratory factor analysis and the obtained structures were theoretically evaluated. It was seen that other than the five-factor structure, the scale items were not clustered under the related factor structures in a statistically and theoretically significant way.
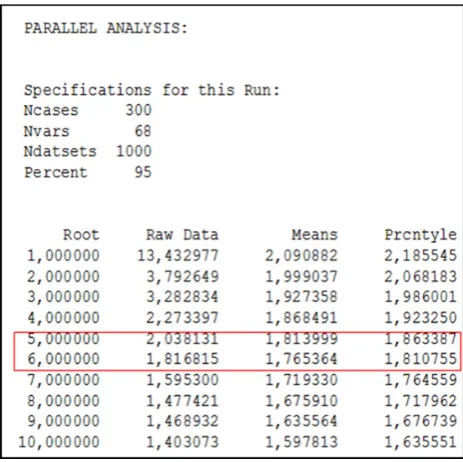
Figure 1. The Results of The Horn's Parallel Analysis
Horn's Parallel Analysis is a method developed in order to determine the number of factors through generating random variables. Randomly generated variables and the eigenvalues computed based on the existing variables are calculated separately. Selection is performed in a way that the eigenvalues related to the variables in the existing dataset are bigger than the expected value of the eigenvalues obtained from the randomly selected variables. The number of factors determined will be the number of eigenvalues selected [34]. The Horn's Parallel Analysis conducted in our study showed that there was a small difference between the value generated for the 6th factor (1.816) and the value from the dataset (1.810). In this case, it would be possible to determine the number of factors as 6 or 5. The results of the Horn's Parallel Analysis are presented in Figure 1.
Velicer’s MAP Test is based on the examination of a series of partial correlation matrices and principle component analysis. The lowest level of the eigenvalues for the squares of the partial correlation values gives the number of factors [35]. It can be seen that according to the MAP test the suggested number of factors was found as five. When the results of these two tests are evaluated together, it was considered appropriate to determine the number of factors as five. The results of the Velicer’s MAP Test are shown in Figure 2.
Although the load value of an item is expected to be 0.45 or bigger when determining the factor structure of a scale, the reduction of this value until 0.30 is also regarded as acceptable [29]. High factor loads are seen as an indicator of the possibility that the variable may fall under the said factor. In the present study, item load values were taken as minimum 0.45.
[image:3.595.61.293.74.305.2]In the exploratory factor analysis, the factor structure of the study was determined by using the “principal components analysis” and “varimax rotation” as a vertical rotation technique. Principal component analysis is one of the most commonly used multivariate tools to describe and summarize large data sets by finding the subspace in the space of the original variables where the data most vary. In Principal component analysis, the possibly correlated original variables are converted into sets of linearly uncorrelated variables called principal components which are in number less or equal than the number of original variables [36]. Factor rotation involves a transformation of the initial factor loadings so that a greater simple structure is obtained thus creating a more interpretable solution. This transformation does not change underlying mathematical relationship in the data thereby keeping the overall fit of the factor analysis result intact [37]. Varimax rotation ensures that each variable is maximally correlated with only one principal component while having a near-zero association with the other components [38].
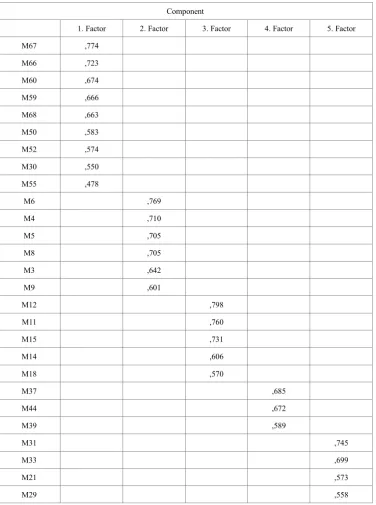
The number of factors was determined as five and the load value was determined as 0.45. Afterwards, exploratory factor analysis was performed and a scale consisting of 27 items under a total of five factors was created. It was seen that these 27 items explained the 51.06% of the total variance. The findings regarding the factor loads of the scale and the variance rates that these factors explain are shown in Table 1.
Table 1. Rotated Component Matrix
Component
1. Factor 2. Factor 3. Factor 4. Factor 5. Factor
M67 ,774
M66 ,723
M60 ,674
M59 ,666
M68 ,663
M50 ,583
M52 ,574
M30 ,550
M55 ,478
M6 ,769
M4 ,710
M5 ,705
M8 ,705
M3 ,642
M9 ,601
M12 ,798
M11 ,760
M15 ,731
M14 ,606
M18 ,570
M37 ,685
M44 ,672
M39 ,589
M31 ,745
M33 ,699
M21 ,573
M29 ,558
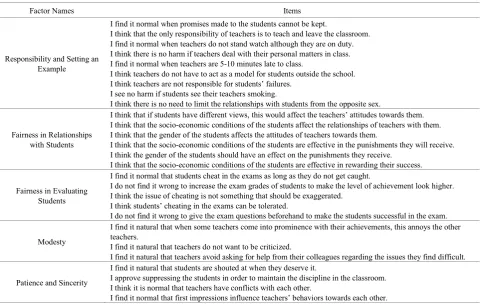
Table 2. The Names of the Factors and the Items Gathered under Each Factor
Factor Names Items
Responsibility and Setting an Example
I find it normal when promises made to the students cannot be kept.
I think that the only responsibility of teachers is to teach and leave the classroom. I find it normal when teachers do not stand watch although they are on duty. I think there is no harm if teachers deal with their personal matters in class. I find it normal when teachers are 5-10 minutes late to class.
I think teachers do not have to act as a model for students outside the school. I think teachers are not responsible for students’ failures.
I see no harm if students see their teachers smoking.
I think there is no need to limit the relationships with students from the opposite sex.
Fairness in Relationships with Students
I think that if students have different views, this would affect the teachers’ attitudes towards them. I think that the socio-economic conditions of the students affect the relationships of teachers with them. I think that the gender of the students affects the attitudes of teachers towards them.
I think that the socio-economic conditions of the students are effective in the punishments they will receive. I think the gender of the students should have an effect on the punishments they receive.
I think that the socio-economic conditions of the students are effective in rewarding their success.
Fairness in Evaluating Students
I find it normal that students cheat in the exams as long as they do not get caught.
I do not find it wrong to increase the exam grades of students to make the level of achievement look higher. I think the issue of cheating is not something that should be exaggerated.
I think students’ cheating in the exams can be tolerated.
I do not find it wrong to give the exam questions beforehand to make the students successful in the exam.
Modesty
I find it natural that when some teachers come into prominence with their achievements, this annoys the other teachers.
I find it natural that teachers do not want to be criticized.
I find it natural that teachers avoid asking for help from their colleagues regarding the issues they find difficult.
Patience and Sincerity
I find it natural that students are shouted at when they deserve it.
I approve suppressing the students in order to maintain the discipline in the classroom. I think it is normal that teachers have conflicts with each other.
I find it normal that first impressions influence teachers’ behaviors towards each other.
3.2. Confirmatory Factor Analysis
Table 3. Confirmatory Factor Analysis Results Compliance Criteria Values
X2 494.87
sd 314
X2/sd 1.57
p-Value 0.000
RMSEA 0.041
NFI 0.87
NNFI 0.94
RMR 0.052
GFI 0.90
AGFI 0,89
CFI 0.95
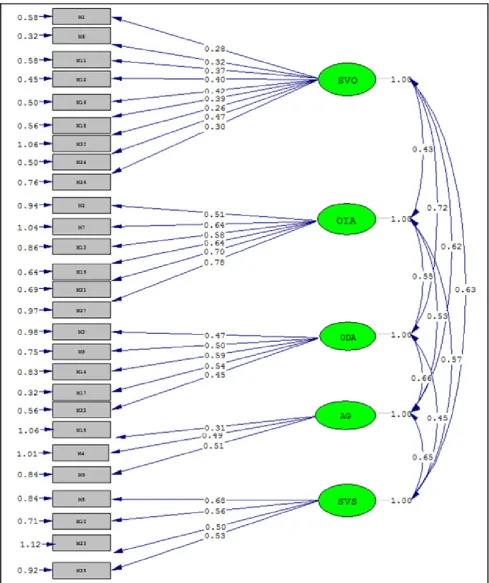
The model that was formed as the result of the exploratory factor analysis was tested through the confirmatory factor analysis. Confirmatory factor analysis is used to test whether the data fit a hypothesized measurement model. This hypothesized model is based on theory and/or previous analytic research [28]. As the result of the analyses, the fit values calculated regarding the convenience of the model are given in Table 3.
When the values given above are examined, it can be said that all the values were considerably good and within acceptable fit limits according to the fit index limits stated
Figure 3. Confirmatory Factor Analysis Path Diagram
3.3. Item Total Correlation
An item analysis was conducted based on item total correlation in order to ensure the internal reliability of the scale. Item statistics point out to the relationship between
correlations are expected to be not negative for the additivity of the scale [40, 41].
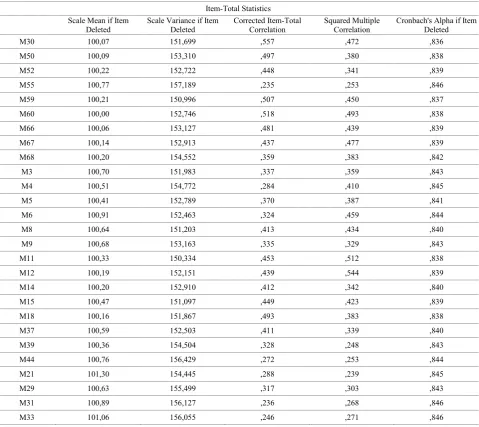
In the present study, the item analysis was conducted to check the presence of items that showed a significant correlation with the scale scores at a level of 0.20 and above. As the result of the item total correlation analysis conducted for 27 items, it was seen that none of the items were below 0.2, and the lowest item correlation coefficient was 0.235. The correlations between the score series of each item and the total score of the scale are shown in Table 4.
3.4. Cronbach’s Alpha
[image:7.595.66.546.227.654.2]In the internal consistency analysis of the scale, which consisted of 27 items in its final form, the Cronbach’s Alpha coefficient was calculated as 0.846. Cronbach’s Alpha reliability coefficient is an indicator of the internal consistency among the test scores of the scale, and a value of 0.70 or higher is accepted to be adequate for the reliability of the scale [29]. According to the findings, it can be said that the scale is adequately reliable.
Table 4. Corrected Item-Total Correlation Results Item-Total Statistics
Scale Mean if Item
Deleted Scale Variance if Item Deleted Corrected Item-Total Correlation Squared Multiple Correlation Cronbach's Alpha if Item Deleted
M30 100,07 151,699 ,557 ,472 ,836
M50 100,09 153,310 ,497 ,380 ,838
M52 100,22 152,722 ,448 ,341 ,839
M55 100,77 157,189 ,235 ,253 ,846
M59 100,21 150,996 ,507 ,450 ,837
M60 100,00 152,746 ,518 ,493 ,838
M66 100,06 153,127 ,481 ,439 ,839
M67 100,14 152,913 ,437 ,477 ,839
M68 100,20 154,552 ,359 ,383 ,842
M3 100,70 151,983 ,337 ,359 ,843
M4 100,51 154,772 ,284 ,410 ,845
M5 100,41 152,789 ,370 ,387 ,841
M6 100,91 152,463 ,324 ,459 ,844
M8 100,64 151,203 ,413 ,434 ,840
M9 100,68 153,163 ,335 ,329 ,843
M11 100,33 150,334 ,453 ,512 ,838
M12 100,19 152,151 ,439 ,544 ,839
M14 100,20 152,910 ,412 ,342 ,840
M15 100,47 151,097 ,449 ,423 ,839
M18 100,16 151,867 ,493 ,383 ,838
M37 100,59 152,503 ,411 ,339 ,840
M39 100,36 154,504 ,328 ,248 ,843
M44 100,76 156,429 ,272 ,253 ,844
M21 101,30 154,445 ,288 ,239 ,845
M29 100,63 155,499 ,317 ,303 ,843
M31 100,89 156,127 ,236 ,268 ,846
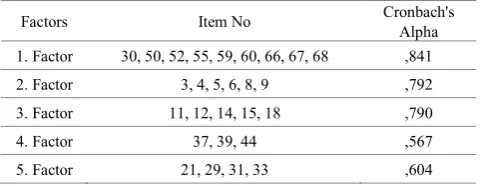
Cronbach’s Alpha coefficients of the factors of the scale were also separately calculated. A Cronbach’s Alpha value lower than 0.50 indicates low reliability, a value between 0.50 and 0.80 indicates appropriate reliability, and a value higher than 0.80 shows that the scale has high reliability [42]. In this case, it can be said that the 1st factor had high reliability, whereas the other factors had appropriate reliability levels. It can be stated that the low internal consistency coefficients of the 4th and the 5th factors compared to other factors was related to the small number of the items in these factors. The Cronbach’s Alpha coefficients of the factors of the scale are given in Table 5.
Table 5. The Cronbach’s Alpha Coefficients of the Factors
Factors Item No Cronbach's Alpha 1. Factor 30, 50, 52, 55, 59, 60, 66, 67, 68 ,841 2. Factor 3, 4, 5, 6, 8, 9 ,792 3. Factor 11, 12, 14, 15, 18 ,790
4. Factor 37, 39, 44 ,567
5. Factor 21, 29, 31, 33 ,604
4. Conclusions
The aim of the present study was to develop a valid and reliable scale to evaluate the value-eroding behaviors of teachers, hence the professional and ethical values that teachers are required to have through a holistic perspective.
The items of the Value-eroding Teacher Behaviors Scale, which initially consisted of 68 items, were designed in the form of 5-point Likert type rating scale. Since the scale consisted of entirely negative items, these were scored in the form of 1- I completely agree, 2 - I agree, 3 - I am not sure, 4 - I disagree and 5 - I completely disagree. The draft scale was conducted on 310 teachers, and validity and reliability analyses of the scale were performed on the data obtained from this trial procedure.
As the result of the exploratory factor analysis, the number of the items of the Value-eroding Teacher Behaviors Scale decreased to 27. It was seen that the items were grouped under the factors of “responsibility and setting an example” (9 items), “fairness in relationships with students” (6 items), “fairness in evaluating students” (5 items), “modesty” (3 items) and “patience and sincerity” (4 items). These five factors explained the 51.06% of the total variance.
The 27-item scale was reapplied to a different sample in order to confirm the scale structure, and the construct validity of the scale was tested by using confirmatory factor analysis. All the results obtained from the confirmatory factor analysis were found to be considerably good and the model fit was at an acceptable level (X2/sd=1.57, RMSEA=0.041, NFI=0.87, NNFI=0.94, RMR=0.052, GFI=0.90, AGFI=0.89, CFI=0.95). Besides, the internal consistency reliability coefficients of the scale were calculated, and the results showed that the scale had a good level of reliability (item total correlation coefficients were
higher than 0.2 and the Cronbach’s Alpha coefficient was .846).
Based on the findings obtained from the validity and reliability studies of the Value-eroding Teacher Behaviors Scale, it can be said that the scale is a valid and reliable measuring tool to be used for measuring teachers’ value-eroding behaviors.
REFERENCES
[1] Kılıç, A. (2012). The relationship of values in elementary school 4th grade social studies textbook with the attainments and their level of being included in student workbooks.
Educational Sciences: Theory & Practice, 12(2), 1593-1604. [2] Aktay, A., & Ekşi, H. (2009). The relationship between organizational citizenship behaviours and value preferences of teachers and principals. Turkish Journal of Business Ethic, 2(3), 19-65.
[3] Okumuş, E. (2010). Society and moral education. Eğitime Bakış Dergisi, 6(18), 28-32.
[4] Bektaş, F., & Nalçacı, A. (2012). The relationship between personal values and attitude towards teaching profession.
Educational Sciences: Theory & Practice, 12(2), 1244-1248. [5] Gül, R. (2013). Education of Honesty as a Value Education
During a Primary Education. (Unpublished doctoral
dissertation thesis). Hitit University, Çorum.
[6] Özdaş, F. (2013). The Evaluation of Teacher’s Opinions Regarding the Student Misbehaviours and The Training of Values at Secondary Schools. (Unpublished doctoral dissertation thesis). Fırat University, Elazığ.
[7] Yıldırım, K. (2009). Values education experiences of Turkish class teachers: A phenomeonological approach. Eurasian Journal of Educational Research, 35, 165-184.
[8] Yiğittir, S., & Öcal, A. (2011). High school history teachers’ views on values and values education. Journal of Social and Economic Research, 13(20), 117-124.
[9] Yalar, T., & Yelken, T. Y. (2011). Determining the teachers opinions on improving values education and developing a programme module sample. Electronic Journal of Social Sciences, 10(38), 79-98.
[10] Halstead J. M., & Taylor, M. J. (2000). Learning and teaching about values: A review of recent research. Cambridge Journal of Education, 30, 169-202.
[11] Brophy, J., & Good, T. (1986). Teacher behavior and student achievement. In M. Wittrock (Ed.), Handbook of research on teaching (3rd ed., pp. 328-375). New York, NY: Macmillan. [12] Yılmaz, E. (2009). The study into teachers’ value perceptions
in terms of various variables. Journal of Values Education, 17(7), 109-128.
[13] Balcı, F. A., & Yelken, T. Y. (2014). Meaning attributed to the concept of ‘value’ by primary school teachers. H.U. Journal of Education, 39, 81-90.
preservice teachers. Educational Sciences: Theory & Practice, 12(2), 1559-1572.
[15] Çengelci, T., Hancı, B., & Karaduman, H. (2013). Teacher and student views about values education at the school setting.
Journal of Values Education, 11(25), 33-56.
[16] Can, N. (2004). Effective teacher development and behavior of teachers. Journal of the Institute of Social Sciences, 16, 103-119.
[17] Çakıroğlu, A. (2013). The Effect of Culture of Fear on Values Education. (Unpublished doctoral dissertation thesis). Abant Izzet Baysal University, Bolu.
[18] Önen, A. S. (2012). The effect of student teachers’ personality traits & EQ levels on stress coping. H.U. Journal of Education, 42, 310-322.
[19] Aktepe, V., & Yel, S. (2009). The description of value judgments of primary school teachers: The case of Kırşehir.
Turkish Journal of Educational Sciences, 7(3), 607-622. [20] Dündar, H. (2012). The relationship between the teachers’
values and their organizational citizenship behaviors. The Journal of Erzincan University, 14(2), 215-234.
[21] Fırat, N. Ş., & Açıkgöz, K. (2012). Value sytems of teachers with different variables. H.U. Journal of Education, 43, 422-435.
[22] Kolaç, E., & Karadağ, R. (2012). Meanings assigned to the notion of value and value ranking by pre-service Turkish-language teachers. Elementary Education Online, 11(3), 762-777.
[23] Yapıcı, A., Kutlu, M. O., & Bilican, F. I. (2012). Value orientations of teacher candidates. Electronic Journal of Social Sciences, 11(42), 129-151.
[24] Tomul, E., & Çelik, K. (2014). A scale on teachers’ pedagogical values: A reliability and validity analysis.
Pamukkale University Journal of Education, 36, 215-227. [25] Tunca, N., & Sağlam, M. (2013). Reliability and validity
work conducted on a professional values scale designed for elementary school teachers. Journal of Educational Sciences Research, 3(1), 139-164.
[26] Balay, R. (2011). The applicability of the moral virtues scale in higher education. Journal of Educational Sciences Research, 1(2), 99–118.
[27] Gündüz, Y., & Coşkun, Z. S. (2012). Development of teachers’ ethical values scale according to student perception: A study of validity and reliability. Journal of Kirsehir Education Faculty, 13(1), 111-131.
[28] Tabachnick, B. G., & Fidell, L. S. (2007). Using multivariate statistics (5nd ed.). New York: Allyn and Bacon.
[29] Büyüköztürk, Ş. (2007). Sosyal bilimler için veri analizi el kitabı.Ankara: Pegem A Yayıncılık.
[30] Çokluk, Ö., Şekercioğlu, G., & Büyüköztürk, Ş. (2014).
Sosyal bilimler için çok değişkenli istatistik SPSS ve LISREL uygulamaları.Ankara: Pegem A Yayıncılık.
[31] Hutcheson, G. D., & Sofroniou, N. (1999). The multivariate social scientist: introductory statistics using generalized linear models. London: Sage Publications.
[32] Özdamar, K., & Dinçer, S. (1987). Bilgisayarla istatistik değerlendirme ve veri analizi. Eskişehir: Bilim Teknik Yayınevi.
[33] Yavuz, G., & Doğan, N. (2015). Using Velicer’s Map Test and Horn’s Parallel Analysis for determining component number. H.U. Journal of Education, 30(3), 176-188.
[34] Horn, J. L. (1965). A rationale and test for the number of factors in factor analysis. Psychometrika, 30(2). 179-185. [35] Velicer, W. F. (1976). Determining the number of
components from the matrix of partial correlations.
Psychometrka, 41, 321-327.
[36] Saccenti, E., & Camacho, J. (2015). Determining the number of components in principal components analysis: A comparison of statistical, crossvalidation and approximated methods. Chemometrics and Intelligent Laboratory Systems,
149, 99–116.
[37] Finch, H. (2006). Comparision of the performance of varimax and promax rotations: Factor structure recovery for dichotomous items. Journal of Educational Measurement, 43(1), 39-52.
[38] Soares, P. K., Bruns, R. E., & Scarminio, I. S. (2008). Statistical mixture design: Varimax factor optimization for selective compound extraction from plant material.Analytica Chimica Acta, 613, 48–55.
[39] Şimşek, Ö. F. (2007). Yapısal eşitlik modellemesine giriş temel ilkeler ve lisrel uygulamaları. Ankara: Ekinoks. [40] Özgüven, İ. E. (1994). Psikolojik testler.Ankara: Yeni Doğuş
Matbaası.
[41] Tekin, H. (1996). Eğitimde ölçme ve değerlendirme. Ankara: Yargı Yayınları.