Modelling and Simulation of Robust Biometric
Fingerprint Recognition Algorithm
Sylvester Michael Ekpo, Kingsley M. Udofia, Ozuomba Simeon*
Department of Electrical/Electronic and Computer Engineering, University of Uyo, Akwa Ibom, Nigeria
Received April 26, 2019; Revised September 16, 2019; Accepted September 23, 2019
Copyright©2019 by authors, all rights reserved. Authors agree that this article remains permanently open access under the terms of the Creative Commons Attribution License 4.0 International License
Abstract
Fingerprint is a type of biometrics that is used for human recognition because it is rich in details called minutiae. The focus of this paper is to develop an algorithm for fingerprint recognition through extracting and matching of fingerprint image minutiae. In order to achieve accurate results, the fingerprint is first pre-processed to enhance its quality. An alignment-based matching algorithm was developed for minutia matching. This algorithm is capable of finding the correspondences between the input minutia pattern and the stored template minutia pattern without resorting to exhaustive search. The performance of the developed system was evaluated with matrix laboratory (MATLAB) software along with fingerprint from the standard FVC2000 fingerprint database and fingerprints from different people at university of Uyo. From the curves of false match rate (FMR) and false non match rate (FNMR) against similarity score, a threshold value of 0.4 was obtained as guided by the equal error rate (EER) value. For verification and identification testing, the developed system was able to accurately differentiate between genuine users and imposter irrespective of the orientation and noise level of the fingerprints.Keywords
Biometrics, Fingerprint, Minutiae, Matching of Fingerprint Image, Alignment-based Matching Algorithm, Minutia Matching, Similarity Score1. Introduction
One major problem of the existing fingerprint image recognition system is the poor quality of the image acquired from the capturing device and this has plagued a lot of fingerprint recognition systems [1, 2, 3, 4]. The low quality can be caused by the capturing device or the condition of the skins such as sweat, dry or wet skin or
deformation of the skin [5]. The orientation of the fingerprint during capturing is also another problem confronting the system [6, 7, 8]. Some of the existing fingerprint recognition systems lack the ability to handle effectively the stated problems and as such, results in false rejection of authentic fingerprints and false acceptance of fake fingerprints. In order to improve on the quality, an enhancement algorithm based on the combination of Gabor filter [9, 10, 11, 12] and Fast Fourier transform (FFT) [13, 14, 15, 16] is developed.
The results of the two enhancement processes (Gabor filtering and FFT) are combined to get the final image before the minutiae are extracted. With regards to the image orientation, this system has a way of detecting a reference point (core point) for the image in the database and that of the queried image. Then, with the two reference points, the two images are rotated to the same direction (orientation) and the images are superimposed (matched) before computing the similarity score. The relevant mathematical expressions and procedure to achieve this are presented in this paper. Also, the proposed fingerprint system is simulated with MATLAB software and the performance analysis of the system is conducted using FVC2002 fingerprint database.
2. Methodology
Figure 1. Block diagram for fingerprint registration
Figure 2. Block diagram for fingerprints matching
2.1. The Finger Print Registration Process
The detailed steps used in fingerprint registration in this paper are given in Figure 3.
[image:2.595.89.490.78.297.2] [image:2.595.128.470.375.666.2]2.2. Fingerprint Image Enhancement
Fingerprint Normalization: Normalization transforms an n-dimensional gray-scale image from one intensity range to another. Consider an n-dimensional gray-scale image with maximum intensity (denoted as MAX) and with minimum intensity (denoted as MIN) which gives a range of intensity denoted as MAX-MIN. Normalization will transform the image into another range of intensity with new maximum intensity (denoted as newMAX) and with new minimum intensity (denoted as newMIN) which gives a new intensity range given as newMAX-newMIN. The transformation to the new intensity, IN is carried out by interpolation which is given as follows;
IN = (1 − 𝑀𝑖𝑛)𝑛𝑒𝑤𝑀𝑎𝑥−𝑛𝑒𝑤𝑀𝑖𝑛𝑀𝑎𝑥−𝑚𝑖𝑛 + 𝑛𝑒𝑤𝑀𝑖𝑛 (1)
Determination of the intensity threshold value: Determination of appropriate intensity threshold value is essential in fingerprint image enhancement process. The determination of the intensity threshold value is done using the following iterative method:
i. Select an initial threshold (Tk) where K is the iteration counter , K =0
ii. Segment the image into object and background pixels thereby creating two sets:
iii. G1 = {f(m,n):f(m,n)>T} (object pixels) and G2 = {f(m,n):f(m,n) ≤T} (background pixels); where f(m,n) denotes the the pixel located in the mth column and nth row
iv. Compute the average of each set; where m1 = average value of G1 (object pixels) and m2 = average value of G2 (background pixels) v. Increase K by 1; K = K +1
vi. Generate a new threshold 𝑇𝑇𝑘𝑘 as follows;
𝑇𝑇𝑘𝑘 =(𝑚1+𝑚2)2 (2)
vii. If 𝑇𝑇𝑘𝑘 ≠ 𝑇𝑇𝑘𝑘−1then go to step ii, otherwise
convergence point is reaches; output the threshold, 𝑇𝑇𝑘𝑘.
Segmentation: Firstly, the image is divided into blocks and the grey-scale variance, V (k) for a block of size W x W is calculated for each block in the image as follows;
V (k) = �𝑤12� ∑ � (I(𝑖, 𝑗) − M(𝑘))2
𝑤−1 𝑗=0 𝑤−1
𝑖=0 (3)
Where I(i; j) is the grey-level value at pixel (i; j), and M(k) is the mean grey-level value for the block k. If V (k) < 𝑇𝑇𝑘𝑘, then the block is assigned to be a background region; otherwise, it is assigned to be part of the foreground.
Binarization: Binarization is a process that is used to transform the image from a 256 level image to a 2 level image that gives the same information. It is accomplished by first dividing the image into blocks of 32 by 32. Then, the mean is calculated after which a binary image is created by colouring each pixel white or black, depending on a
pixel's label (black for 0, white for 1).
𝑔(𝑥𝑥) = �1; 𝑖𝑓 𝑓(𝑥𝑥, 𝑦𝑦) > 𝑙𝑜𝑐𝑎𝑙 𝑚𝑒𝑎𝑛0; 𝑜𝑡ℎ𝑒𝑟𝑤𝑖𝑠𝑒 (4)
Normally, an object pixel has a value of “1” while a background pixel has a value of “0.”
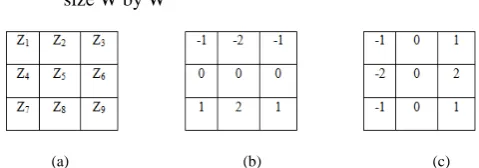
Orientation Estimation: The image orientation estimation is essential in the fingerprint image enhancement process. For a normalized image, N, the algorithm for the image orientation estimation is as follows:
i. Segment the normalized image, N into block of size W by W
(a) (b) (c)
Figure 4. Sobelmasks for (a) the image, (b) vertical gradient and (c) horizontal gradient
ii. The gradients, δx(p, q) and δy(p, q) are computed for every given pixel, (p, q) in the block, where δx(p, q) and δy(p, q) are the gradient magnitudes in the x and y directions, respectively. The horizontal Sobel operator is used to compute the δx(p, q) while the vertical Sobel operator is used to compute the δy(p, q). The δx(p, q) and δy(p, q) are
calculated as follows;
δy(p,q) = (Z7+2Z8+Z9)-(Z1+Z2+Z3) (5) δX (p,q) = (Z3+2Z6+Z9)-(Z1+Z4+Z7) (6) iii. Estimation of the local orientation: First, the image
is divided into W by W blocks. Then, the local orientation of each block centered at pixel (i, j) is computed as follows;
Vy = ∑𝑖+𝑤/2𝑝=𝑖+𝑤/2.��𝑗+𝑤/2𝑞=𝑗+𝑤/22 δX (p, q) δy (p, q) � (7)
Vx = ∑𝑖+𝑤2 .
𝑝=𝑖+𝑤2 �� 2 δ2X(p, q) − δ2y(p, q) 𝑗+𝑤2
𝑞=𝑗+𝑤2 � (8)
The tangent value of the block direction is estimated as follows;
θ (𝐼, 𝑗) =12𝑡𝑎𝑛−1 Vy
Vx (9)
Where θ is the block orientation. Next, the maximum reliability peak is computed. Furthermore, based on the estimated direction of each block, those blocks without significant information (ridges) are discarded.
2.3. Ridge Frequency Estimation
[image:3.595.303.543.227.311.2]represents the local frequency of the ridges in a fingerprint. The first step in the local ridge frequency estimation stage is to divide the image into blocks of size W x W. Then, project the grey level values of all the pixels located inside each block along a direction orthogonal to the local ridge. The ridge spacing is calculated by counting the number of pixels between consecutive minutiae points in the projected waveform. Given R (i,j) as the ridge spacing, for a block of size W×W, then the ridge frequency F (i,j) is given as;
𝐹(𝑖, 𝑗) =𝑅(𝑖,𝑗)1 (10) The ridge frequency values are presented in terms of ridge wavelength.
Gabor filtering is used in image enhancement process. The filtering stage is applied to enhance the clarity of the ridge structures while reducing noise in the image. Filtering is used for edge detection, for finding the boundaries of objects or structures within images. The even-symmetric Gabor filter is constructed using ridge orientation and ridge frequency parameters. A Gabor filter can be viewed as a sinusoidal plane of particular frequency and orientation modulated by a Gaussian envelope as follows;
G(x, y) = g(x, y) s(x, y) (11) s(x, y) : Complex sinusoid (12)
The Gabor filter is given as; G(𝑥𝑥, 𝑦𝑦, 𝜃, 𝑓) = exp �− 𝑥𝜃2
2𝜎2𝑥+
𝑦𝜃2
2𝜎2𝑦� exp(𝑖(2𝜋𝑓𝑥𝑥𝜃))(13)
Where f is the frequency of the cosine wave, 𝜃 is the local orientation, 𝜎𝜎𝑥𝑥and 𝜎𝜎𝑦𝑦are the standard deviations of the Gaussian envelope along the x and y axes, respectively,
and 𝑥𝑥θ and 𝑦𝑦θ define the x and y axes of the filter coordinate frame, respectively.
2.4. Fingerprint Enhancement by Fourier Transform
To enhance the image using the Fourier transform, the image is divided into small processing blocks (32 by 32 pixels) and the Fourier transform (FFT) is determined as follows;
𝐹(𝑢, 𝑣) = � � 𝐹(𝑥𝑥, 𝑦𝑦)𝑒𝑥𝑥𝑝 �−𝑗2𝜋𝑋(𝑢𝑥𝑀+𝑉𝑦𝑁� 𝑁−1
𝑦=0 𝑀−1
𝑥=0
(14) for u = 0, 1, 2, ..., 31 and v = 0, 1, 2, ..., 31. In order to enhance a specific block by its dominant frequencies, the FFT of the block is multiplied by its magnitude a set of times; where the magnitude of the original FFT = abs�𝐹(𝑢, 𝑣)� = |𝐹(𝑢, 𝑣)| gives the enhanced block as follows;
𝑔(𝑥𝑥, 𝑦𝑦) = 𝐹−1(𝐹(𝑢, 𝑣) × |𝐹(𝑢, 𝑣)|𝑘𝑘) (15)
Where F-1 is the inverse of Fourier transformation for x = 0, 1, 2, ..., 31 , y = 0, 1, 2, ..., 31 and k is an experimentally determined constant; the value of k = 0.45 is used in this work.
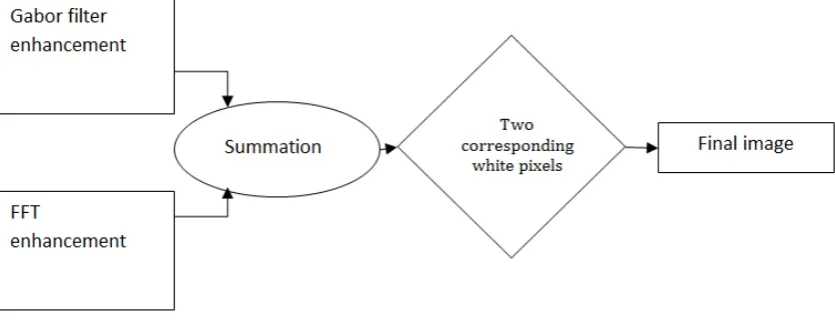
2.5. Combination of Gabor filtering and Fourier Transform (FFT) Fingerprint Enhancement Processes
In this work, a combination of Gabor filtering and Fourier Transform (FFT) fingerprint enhancement processes are used as shown in Figure 5.
[image:4.595.91.509.508.668.2]2.6. Secondary Features
Secondary features, such as Euclidean distance and oriental estimation are the two major types of minutiae features: the ridges ending points (that is, where a ridges ends) and the bifurcation points (that is, the spot where a ridge splits into two ridges) as shown in Figure 6. After extracting minutiae points, the distance in between all minutiae points are mapped for provide robustness of algorithm of fingerprint matching system.
Figure 6. Crossing number for ridge ending and bifurcation
2.7. Minutiae Extraction
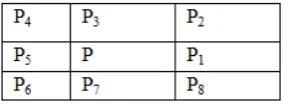
In this work minutiae extraction was perform using the skeleton image and the crossing number method. The approach involves using a 3 x 3 window (Table 1) to examine the local neighbourhood of each ridge pixel in the image. A pixel is then classified as a ridge ending if it has only one neighbouring ridge pixel in the window, and a pixel is classified as a bifurcation if it has three neighbouring ridge pixels. The CN value which is defined as half the sum of the differences between pairs of adjacent pixels in the eight neighbourhoods is then computed as shown in Table 1.
Table 1. The 3 x 3 window used for the calculation of the crossing number
Crossing number n is calculated as follows;
𝑛 =12∑ 𝑖 = 1 … 8|𝑣𝑎𝑙(𝑝(𝑖𝑚𝑜𝑑) − 𝑣𝑎𝑙(𝑝𝑖 − 1)| (16) Fingerprint image post processing: False minutiae may be introduced into the image due to factors such as noisy images, and image artefacts created by the thinning process. Hence, after the minutiae are extracted, it is necessary to employ a post processing stage in order to validate the minutiae. In this paper, the minutiae validation algorithm by Tico and Kuosmanen [17, 18] is used to eliminate false minutiae.
2.8. Fingerprint Matching
After the fingerprint registration, the next stage is the matching which is the process used to determine whether two sets of fingerprints come from the same finger. Prior to
the matching process, minutiae alignment is executed to improve the robustness of the image. In order to match an input image to those in the database, the core points of both fingerprint images (cropped around the core) are chosen as reference points. This is done after the orientation field of the image has been calculated. In order to align, translate and rotate all other minutia with respect to the reference minutia, the following mathematical expression is used;
θr= θ’(i,j) − θ (i,j))+ (θ’(𝑚,𝑛) − θ (𝑚,𝑛)))2 (17) where θ’(i, j) and θ (i, j) are orientations of the reference point blocks of processed (test) image and database fingerprint images, respectively. Similarly, θ’(m, n) and θ(m, n) are orientations of any block (m, n) of processed image and database fingerprint images respectively. The test fingerprint image is then rotated by θr.
2.9. Fingerprint Alignment
Aligning two fingerprints is carried out based on the following procedure:
Step 1: Define the reference point, known as the core that will be used to align the two fingerprints efficiently.
Step 2: Shift the two fingerprint images so that the locations of the cores of the two fingerprints are at the same fixed point.
Step 3: Rotate the two fingerprint images to minimize the rotation variance. One approach is to make use of the average orientation of two regions located at both sides of the core, in which case the fingerprint image is rotated with respect to the core point and the rotation stops when the angles between the average orientations of both regions and the vertical axis have a minimized difference.
2.10. Matching Score
The fingerprints matching similarity score value is calculated as a percentage of the paired number of minutia points (with some variations).The similarity between minutia points from the two fingerprints, as a percentage of the paired minutia points is done using the following mathematical expression;
S =(NT+NQ)2×Nm (18) Where Nm denotes the number of paired minutia points, while NT and NQ denote the number of minutia points in sets T and Q respectively. The score ranges from 0 to 1. It can also be expressed as percentage using 100*S.
3. Results and Discussion
[image:5.595.63.287.204.275.2] [image:5.595.105.248.486.538.2]made up of four different databases (DB1, DB2, DB3 and DB4) collected using different sensors and technologies. For DB1, low cost optical sensor “Secure Desktop Scanner” by Key Tronic was used; for DB2, low cost capacitive sensor “Touch Chip” by ST Microelectronics was used; for DB3, optical sensor “DF-90” by Identicator Technology was used; and for DB4, synthetic fingerprint generation was used.
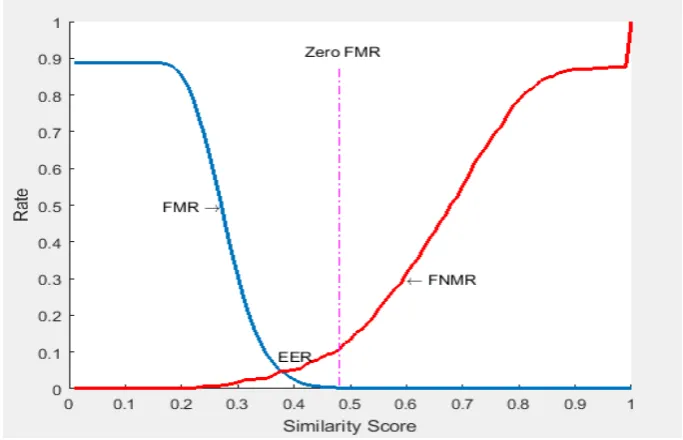
3.1. Similarity Score Curve
All the fingerprints in the database were matched with
one another separately, and similarity score was generated for each matching set. The plot of the false matching rates and false non-matching rates against common similarity scores is shown in Figure 7.
3.2. Registration of Fingerprints
From the FVC 2002, fingerprints from nine different people were pre-processed; the minutiae were extracted and stored as templates. The original images and minutiae for each of the fingerprint of the person is presented in Figure 8 for Fingerprint of 101_1 to Fingerprint of 109_1.
[image:6.595.126.468.239.459.2]Figure 8. The original images and minutiae for each of the fingerprint of the 8 persons
3.3. Fingerprint Verification
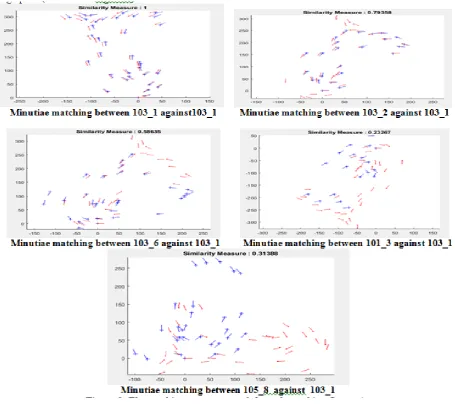
[image:7.595.75.524.74.617.2]Figure 9. The matching score generated for each matching fingerprint
3.4. Fingerprint Identification
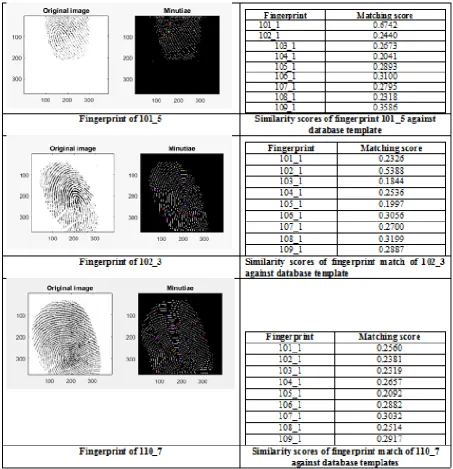
Figure 10. The fingerprints with their minutiae and the matching scores of the presented fingerprints against each of the template’s fingerprints
From the similarity score curve in Figure 7, it can be seen that equal error rate (EER) is 0.38 which can be used as the threshold. However, 0.4 was chosen as the threshold to ensure that no genuine user is rejected. Again, in Figure 9, the matching scores gotten for minutiae matching of fingerprint103_1 against103_1, minutiae matching of fingerprint 103_2 against 103_1 and minutiae matching of fingerprint 103_6 against 103_1 are above the threshold value, whereas, the matching scores gotten for minutiae matching of fingerprint101_3 against 103_1 and minutiae matching of fingerprint 105_8 against 103_1 are below the threshold value. With this, it is clear that the developed system is able to accurately verify authentic fingerprints.
From the results on similarity scores of fingerprint in Figure 10, it can be seen that it is only when a fingerprint
(to be identified) is matched against the fingerprint of the same finger in the database template that the matching score was above the threshold. For instance, in Figure 10, the fingerprint 101_5 against 101_1 gave a matching score of 0.6742, while 101_5 against 102_1 gave a matching score of 0.2440. With this, it is clear that the developed system is able to accurately identify authentic fingerprints.
4. Conclusions
orientation. In this work the quality of the fingerprint was enhanced with a combination of Fourier Transform (FFT) and Gabor filters approaches. Sample fingerprints were used to evaluate the fingerprints matching capability of the system and the results show that the developed system is able to accurately identify authentic fingerprints.
REFERENCES
Khalil, M. S. (2015). Reference point detection for [1]
camera-based fingerprint image based on wavelet transformation. Biomedical engineering online, 14(1), 40. Zhang, D., Liu, F., Zhao, Q., Lu, G., & Luo, N. (2011). [2]
Selecting a reference high resolution for fingerprint recognition using minutiae and pores. IEEE Transactions on Instrumentation and Measurement, 60(3), 863-871. Szczepanik, M., Jóźwiak, I. J., Jamka, T., & Stasiński, K. [3]
(2016). Security lock system for mobile devices based on fingerprint recognition algorithm. In Information Systems Architecture and Technology: Proceedings of 36th International Conference on Information Systems Architecture and Technology–ISAT 2015–Part III (pp. 25-35). Springer, Cham.
Chandrasekaran, A., & Thuraisingham, B. (2007, April). [4]
Fingerprint matching algorithm based on tree comparison using ratios of relational distances. In The Second International Conference on Availability, Reliability and Security (ARES'07) (pp. 273-280). IEEE.
Drahansky,M., Dolezel,M., Urbanek,J ., Brezinova, E and [5]
Kim, T. (2012) Influence of Skin Diseases on Fingerprint Recognition Journal of Biomedicine and Biotechnology 14p Available at https://scholar.google.com/scholar?client=fire fox-b-d&um=1&ie=UTF-8&lr&q=related:49E1DjkARoyo UM:scholar.google.com Accessed on 14th October 2018 Jain, A. K., Feng, J., & Nandakumar, K. (2010). Fingerprint [6]
matching. Computer, 43(2), 36-44.
Dimaunahan, E. D., Ballado Jr, A. H., & Cruz, F. R. G. [7]
(2017, August). Raspberry Pi and IOT Based-Automated Teller Machine Security for the DSWD 4P's Biometric System Using Fingerprint Recognition with Fast-Fourier Transform Image Enhancement, Multi-Stage Minutia Extraction. In Proceedings of the International Conference on Algorithms, Computing and Systems (pp. 3-8). ACM. Wang, Y., & Hu, J. (2011). Global ridge orientation [8]
modeling for partial fingerprint identification. IEEE Transactions on Pattern Analysis and Machine Intelligence,
33(1), 72-87.
Areekul, V., Watchareeruetai, U., & Tantaratana, S. (2004, [9]
July). Fast separable gabor filter for fingerprint enhancement. In International Conference on Biometric Authentication (pp. 403-409). Springer, Berlin, Heidelberg. Jadhav, J. B., Joshi, M. V., & Hire, V. R. (2012). [10]
Fingerprint Verification Using Gabor Filter. International Journal of Electronics, Communication and Soft Computing Science & Engineering (IJECSCSE), 2(1), 50.
Wen, M. L., Liang, Y., Pan, Q., & Zhang, H. C. (2005, [11]
October). A Gabor filter based fingerprint enhancement algorithm in wavelet domain. In IEEE International Symposium on Communications and Information Technology, 2005. ISCIT 2005. (Vol. 2, pp. 1468-1471). IEEE.
Gopi, K., & Pramod, J. T. (2012). Fingerprint recognition [12]
using Gabor filter and frequency domain filtering. Journal of Electronics and Communication Engineering, 2(6), 17-21.
Kaur, A., & Ameeta, B. (2014). Minutiae extraction and [13]
variation of fast Fourier transform on fingerprint recognition. International Journal of Engineering Research and General Science, 2(6).
Aguilar, G., Sánchez, G., Toscano, K., Nakano-Miyatake, [14]
M., & Pérez-Meana, H. (2008). Automatic fingerprint recognition system using fast fourier transform and gabor filters. The proceeding of Scientifica, 12(1), 9-16.
Neethu, S., Sreelakshmi, S., & Sankar, D. (2015). [15]
Enhancement of Fingerprint using FFT×| FFT| n Filter.
Procedia Computer Science, 46, 1561-1568.
Aguilar, G., Sanchez, G., Toscano, K., Salinas, M., Nakano, [16]
M., & Perez, H. (2007, July). Fingerprint recognition. In
Second International Conference on Internet Monitoring and Protection (ICIMP 2007) (pp. 32-32). IEEE.
Afsar, F. A., Arif, M., & Hussain, M. (2004, December). [17]
Fingerprint identification and verification system using minutiae matching. In National Conference on Emerging Technologies (Vol. 1, No. 2, pp. 141-146).
Medina-Pérez, M. A., García-Borroto, M., [18]