Apprehensions in the Graphic Register of
Two-variable Functions
Katia Vigo Ingar
1,*, Maria José Ferreira da Silva
21Pontifical Catholic University of Peru, Peru 2Pontifical Catholic University of São Paulo, Brazil
Copyright©2017 by authors, all rights reserved. Authors agree that this article remains permanently open access under the terms of the Creative Commons Attribution License 4.0 International License
Abstract
The objective of this article is to present part of a doctoral thesis, which deals with an extension of Duval’s study in relation to apprehensions in the graphic register of a two-variable function. Its relevance is extensive in teaching and learning Differential Calculus of two variables since the information the graph of this type of functions may provide is important to build knowledge on two-variable functions and for its applications. For graphic representation and knowledge building, we rely on CAS Mathematica, given that its dynamism allows performing operations in the graphic register. Because of this, we ask ourselves, how do apprehensions take place in the CAS graphic register of two-variable functions? Our research is qualitative and exploratory since the proposed object of study has not been studied a lot. We believe the interaction of apprehensions in the CAS graphic register allows students to conjecture properties of the two-variable functions when, for instance, a student applies those notions to optimization problems.Keywords
Visualization, Apprehensions, Graphic Representation, Calculus1. Introduction
In the last two decades, the study of two-variable functions has developed progressively, as shown by the works of Yerushalmy [12], Kabel [7], Montiel et al [9] and Trigueros and Martínez-Plannel [10], [11] since the theoretical frameworks of the APOS theory (Action, Process, Object, Schema), the Onto-semiotic approach and the Anthropological Theory of the Didactic (ATD), even though the studies on the visualization process are scarce in the area of calculus in two variables. This is demonstrated with the works of Zimmermann and Cunningham [13], Guzmán [4] and Duval [2].
For Zimmerman and Cunningham [13], the term visualization describes the process of production or the use of geometric representations or graphs of mathematical
concepts, principles or problems, through handmade design or computer generation. According to the authors, sciences, engineering and mathematics are enjoying the rebirth of the interest in visualization. Moreover, they state that:
in visualization what we are interested in is precisely the student’s ability to draw an appropriate diagram (with pencil and paper, or in some cases, with a computer) to represent a mathematical concept or problem and to use the diagram to achieve understanding, and as an aid in problem solving (Zimmermann y Cunningham, 1991, p.3).
In the same vein, and emphasizing the way those representations are produced, Guzmán [4] states that:
the ideas, concepts and methods of mathematics present great visual content wealth, which can be intuitively and geometrically represented, and the use of them turns out to be very beneficial, both in the tasks of filing and handling such concepts and methods, as well as for the resolution of problems. (p. 1).
In this context, however, we will adopt visualization as a fundamental notion for mathematical comprehension, given that Duval [2] states that there is no understanding without visualization, since visualization allows a full apprehension of any organization of relations among units of representation. As an example, when we try to understand a graphic representation of a two-variable function, those units called visual variables would be the axis of the surface and the sections on the xy plane, the intersection with the origin of coordinates and the sections with the coordinate planes (Ingar and Silva, [6]).
According to Duval [2], visualization is a process consisting in clearly understanding the whole configuration of those relations and determining what is notable in it. Besides, the author points out that it is common to find students who only achieve a local apprehension of the images, without being capable of seeing the global organization.
visualization in Geometry based on the figural register, and understanding that it is necessary to pay attention to apprehension all together, i.e., to pay attention to the organization of relations among units of representation mentioned by Duval [2], we resolved to study two-variable functions and their different registers of semiotic representation, i.e., to visualize the graphic register of this type of functions since, according to Kashefi et al. [8], its lacking comprehension will cause obstacles in learning other concepts that involve this type of functions.
2. Visualization in the Graphic Register
According to Duval [3], Cartesian graphic representations have a relatively extensive use due to the fact that they are not only found in manuals or articles, but also in journals. Those graphs can be seen in two ways: a specific one that indicates a value at a given time, and an iconic one that evokes highs and lows, smooth or sudden rises from a baseline. For the author, however, none of those ways of seeing respond to a useful way of seeing from a mathematical point of view, i.e., there is a third way of seeing which allows to visualize a relation between two groups of values of different registers of semiotic representation.The author states that, in each one of these three ways of seeing, we distinguish what is observed in the Cartesian graph and what the observed aspects allow to identify. One of the specific problems of learning is how to make students pass from a local, iconic apprehension to a global, qualitative apprehension, since only with the latter we can coordinate with the algebraic register and its relations to the graphic register, thus the Cartesian graphs being able to work as a visualization.
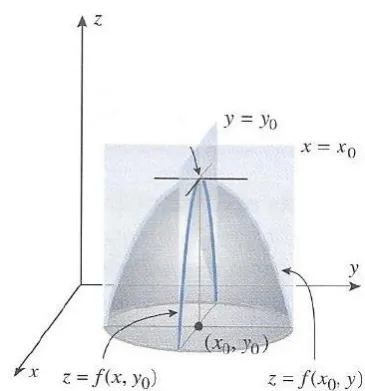
Visualizing a graph requires interpreting a graphic representation. According to the author, for that interpretation, discriminating the visual variables is important, exposing that representation to all variations possible, on condition that the ones formed that way continue making sense. Therefore, we looked in Duval [1] for the notion of apprehension of a geometric figure to study and understand those possible variations in the graphic register, particularly in the graphic register of functions of two real variables, when we built the concept and properties of maximum values and local minimums.
3. Apprehension in the Graphic Register
of Two-variable Functions
There are four ways to apprehend a figure: perceptual, discursive, sequential and operative apprehension. Perceptual apprehension is the one that allows identifying or recognizing a shape or a mathematical object. For Duval, “perceptual apprehension has the epistemological function of identifying objects in two or three dimensions, that is,
performed by cognitive processes automatically, and thus unconsciously” (Duval [1], p.124).
[image:2.595.320.545.186.313.2]In the graphic register of a two-variable function, Ingar [5] states that the perceptual apprehension of the CAS graph (graphic register using Mathematica), as the example shown in figure 1, allows identifying a paraboloid, fulfilling the epistemological function to identify objects, as stated by Duval [1].
Figure 1. Perceptual apprehension of a CAS graphic register From the cognitive point of view, the author states that such apprehension requires more from the student than the perceptual apprehension of the square, for example, since in this graphic register it is observed, besides the coordinate axes, the type of variable (two independent and one dependent), the values of variables X, Y, Z and the reading of the coordinate axes, which allows us to assert that perceptual apprehension of the CAS graphic register is more complex than perceptual apprehension of a figure in geometry. According to the author, this statement is more evident when the perceptual apprehension of the CAS_MATH graph shown in figure 2 allows identifying the same characteristics aforementioned, but it requires more cognitive resources from the student, such as to build the R3 Cartesian system, typical of Mathematica software, whose representation is not canonical, even more so, as Trigueros y Martínez [10] state, if it is not easy for students to understand graphs and build the concept of two-variable functions, in addition to interpret graphs and determine its domain and range.
[image:2.595.321.546.569.739.2]𝑓𝑓(𝑥𝑥,𝑦𝑦) has a relative maximum in (𝑥𝑥0,𝑦𝑦0) and the partial derivatives of f exist in (𝑥𝑥0,𝑦𝑦0), the curves of the surfaces represented by 𝑧𝑧=𝑓𝑓(𝑥𝑥,𝑦𝑦) on planes 𝑥𝑥=𝑥𝑥0 y 𝑦𝑦=𝑦𝑦0 have horizontal tangent lines in (𝑥𝑥0,𝑦𝑦0), then 𝑓𝑓𝑥𝑥�𝑥𝑥0,𝑦𝑦0�= 0 and 𝑓𝑓𝑦𝑦�𝑥𝑥0,𝑦𝑦0�= 0.
Figure 3. Discursive apprehension of the graphic register
For Duval [1], discursive apprehension explains mathematical properties of a figure, like the ones indicated in a legend or by hypotheses, that is configured as explanations of deductive nature with the epistemological function of demonstration. In the graphic register of a two-variable
[image:3.595.87.270.73.269.2]function, Ingar [5] states that discursive apprehension describes mathematical properties of the graphic register considering the semantics of the properties of the object in order to conjecture to build knowledge. As an example, in figure 3 we describe the properties of the local maximum value in point (𝑥𝑥0,𝑦𝑦0).
According to Duval [1], sequential apprehension is required every time it is necessary to build a figure or describe its construction, and it deals with the order in which a figure is built. This order does not only depend on the mathematical properties of the figure, but also on the technical tools used (the ruler and the compass).
In the graphic register of a two-variable function, Ingar[5] states that sequential apprehension is a sequence of steps to graph a function and highlights that, if that type of functions is graphed with the aid of a software, to build the CAS or CAS_MATH graphic register for instance, not only do we need to know the technical tools used, i.e., the command menu of the software and its syntax, but we also need the user’s or student’s mathematical knowledge to continue reasoning with the typical semiotic representations of the software.
For example, as shown below, we can see some steps using the Mathematica software to locate the local minimum in the CAS graphic register (figure 4).
Step 1: Write the command Plot3D [x^3-3 x y+y^3+2, {x,-3,3}, {y,-1,1}, AxesLabel→{"x", "y", "z"}] to graph a two-variable function Step 2: Write the command ContourPlot3D [z==10, {x, 0, 2.5}, {y, 0, 2.5}, {z, -20, 20}, Mesh→None, AxesLabel→{"x", "y", "z"}, ColorFunction→"Rainbow"] to graph the plane represented by z=10
Step 3: Write the command Show to represent in one single graph both the surface and the plane
Step 4: Write the command ContourPlot3D [z==5, {x, 0, 2.5}, {y, 0, 2.5}, {z, -20, 20}, Mesh→None, AxesLabel→{"x", "y", "z"}, ColorFunction→GrayLevel] to graph another plane represented by z=5.
[image:3.595.75.526.508.666.2]And so on and so forth until the existence of a possible minimum value is observed.
In figure 4 we observe that the sequential apprehension of building horizontal planes shows a pattern, which allows conjecturing that the two-variable function algebraically represented by𝑓𝑓(𝑥𝑥,𝑦𝑦) =𝑥𝑥3−3𝑥𝑥𝑦𝑦+𝑦𝑦3 has an absolute minimum at point (0,0) since, because of perceptual apprehension, the plane represented by z=0 is tangent to the surface in that point.
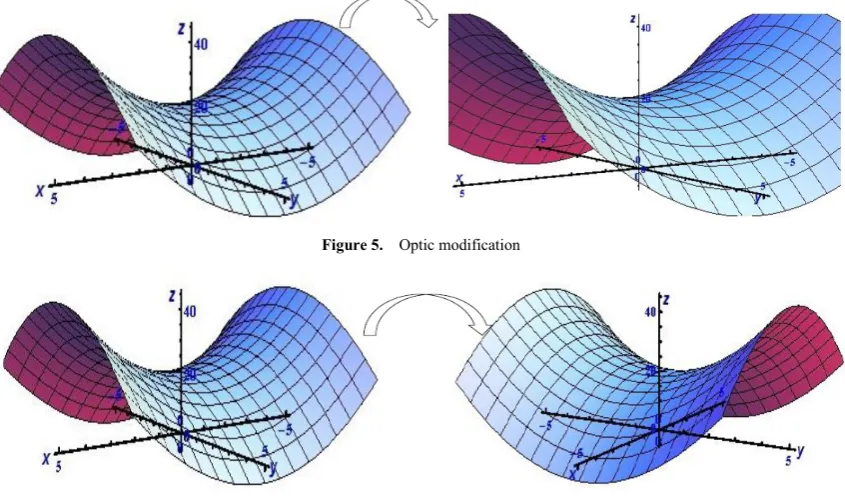
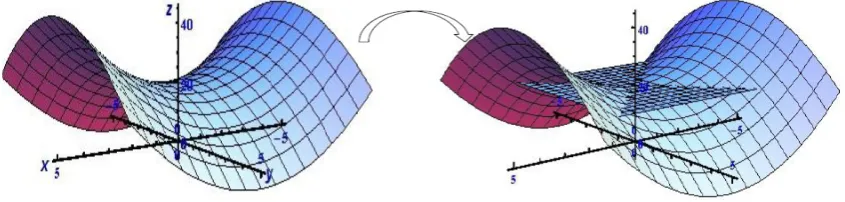
For Duval [1], operative apprehension corresponds to the transformation and/or modification of an initial figure into other possible figures and the perceptive organization of those modifications to show the idea of a solution for a given problem situation. It has a heuristic exploration function because the geometric figure is frequently transformed into others to show an idea of solution for a problem or a demonstration. The author distinguishes three types of modifications, one that may have the same shape and orientation, but with a size variation (optic modification); another one with the same size and shape, but with an orientation variation: rotation, translation (positional modification); and the last one with separation and recombination (mereological modification), looking for reciprocity between the design and the mental representation.
In the graphic register of a two-variable function, Ingar[5] states that the operative apprehension in the graphic register is the transformation or modification of an initial graph into other graphs to show the idea of a solution for a problem with the same heuristic exploration function because it allows to conjecture to resolve a problem. The author states this
heuristic exploration is possible with the support of the software, due to the fact that this allows dynamism in the graph register, which is not possible with the graph done with pencil and paper, especially when graphing two-variable functions.
The researcher distinguishes three modifications: optic, positional and mereological. The optic modification implies size variation and shape certainty. This occurs when, by pressing Ctrl key and clicking the left button of the mouse, we physically move the mouse and manipulate the graph in such a way that we enlarge it or reduce it. For example, in figure 5, the graph is enlarged.
Positional modification occurs when the same size and shape is kept, but the position varies. This happens when, by physically moving the mouse, we can rotate the graph around axis z, rotate it around plane xy and translate it. For example, figure 6 shows the rotation of the CAS graph around axis z.
[image:4.595.94.517.443.691.2]As for mereological modification, it is about sections, that is, the intersections between surfaces, when using two commands of the Mathematica software, we generate sections in the horizontal planes 𝑧𝑧=𝑘𝑘, with planes x=h, y=p and with leaning planes. For example, in figure 7, we show the section of the graph in the horizontal plane z=0, gotten when we wrote the command ContourPlot3D[{z==20}, {x, -3, 3}, {y, -3, 3}, {z, 0, 25}, AxesLabel→{“X”, “Y”, “Z”}, AxesOrigin→{0,0,0}, Boxed→False] and then the command Show to show the sections.
Figure 5. Optic modification
Figure 7. Mereological modification
Therefore, we believe these apprehensions are necessary to understand the possible variations in the graphic register of two-variable functions, due to the fact that we are interested in studying the cognitive activities students mobilize to develop visualization in such register, since the apprehensions in this register allow to organize relations among units of representation, i.e. among visual variables.
4. Final Considerations
We consider that the treatments performed in the CAS graphic register, such as the optic, positional and mereological modifications, are fundamental operations in the graphic register because they provide the possibility to make changes un such register and relate them to mathematical properties, thus facilitating the visualization process, which is important for understanding two-variable functions and calculus of two variables in general.
Likewise, we believe the organization of the apprehensions in the CAS graphic register allows students to conjecture the properties of two-variable functions and partial derivatives when, for example, the student applies those notions to optimization problems.
We recommend the use of the Mathematica software as a means to facilitate the visualization process, since it allows the user, through the organization of sequential, perceptive, operative and discursive apprehension, to mobilize and make connections with the knowledge of the elements of calculus of two variables that emerge in the graphic representation of two-variable functions.
REFERENCES
[1] Duval, R. Les différents fonctionnements possibles d’une figure dans une dérmarche géométric. Repères, 17, pp. 121-138; 1994
[2] Duval, R. Representation, vision and visualization: Cognitive functions in mathematical thinking. Basic issues for learning. En F. Hitt y M. Santos (Eds.), Proceedings of the 21st North American PME Conference, 1, pp. 3-26; 1999
[3] Duval, R. Los problemas Fundamentales en el Aprendizaje de la Matemáticas y las Formas Superiores en el Desarrollo
Cognitivo. Traducción de Myriam Vega Restrepo. Colombia: Universidad del Valle, Instituto de Educación y Pedagogía, Grupo de Educación Matemática; 2004
[4] Guzmán, M. El rincón de la pizarra. Ensayos de visualización en análisis matemático. España, Ediciones Pirámide, S.A; 1996
[5] Ingar, K. A visualização na Aprendizagem dos Valores Máximos e Mínimos Locais da Função de Duas Variáveis Reais. (Tesis doctoral en Educación Matemática). Pontifícia Universidade Católica de São Paulo, São Paulo, Brasil; 2014 [6] Ingar, K. y Silva, M. A visualização de valores máximos e
mínimos de funções de duas variáveis. 12th International Conference on Technology in Mathematics Teaching,
687-695; 2015
[7] Kabael, T. The effects of the function machine on students’ understanding levels and their image and definition for the concept of function. In Swars, S. L., Stinson, D.W., y Lemons-Smith, S. (Eds.). Proceedings of the 31st annual meeting of the North American Chapter of the International Group for the Psychology of Mathematics education, 5, 58-64; 2009
[8] Kashefi, H. Ismail, Zaleha y Mohammad, Y. Obstacles in the Learning of Two-variable Functions through Mathematical Thinking Approach. Procedia Social and Behavioral Sciences, 8, pp. 173-180. Available in: http://www.sciencedirect.com/science; 2010
[9] Montiel, M., Wilhelmi, M., Vidakovic, D. y Elstak, I. Using the onto-semiotic approach to identify and analyze mathematical meaning when transiting between different coordinate systems in a multivariate context, Educational Studies in Mathematics, 72(2), 139-160; 2009
[10]Trigueros, M y Martínez-Planell, R. Geometrical representations in the learning of two-variable functions.
Educational Studies in Mathematics, 73(1), 3-19; 2010 [11]Trigueros, M., & Martínez-Planell, R. How are graphs of two
variable functions taught? In L.R. Wiest y T. Lamberg (Eds.),
Proceedings of the 33rd Annual Meeting of the North America Chapter of the International Group for the Psychology of Mathematics Education. USA; 2011
[12]Yerushalmy, M. Designing representations: Reasoning about functions of two variables. Journal for Research in Mathematics Education, 28, 431-466; 1997